

Telemetry types at a glance
Telemetry typically falls into four categories. Each type serves distinct use cases and has different volume and retention characteristics:
For Datadog-specific implementation details see the Datadog documentation: https://docs.datadoghq.com/
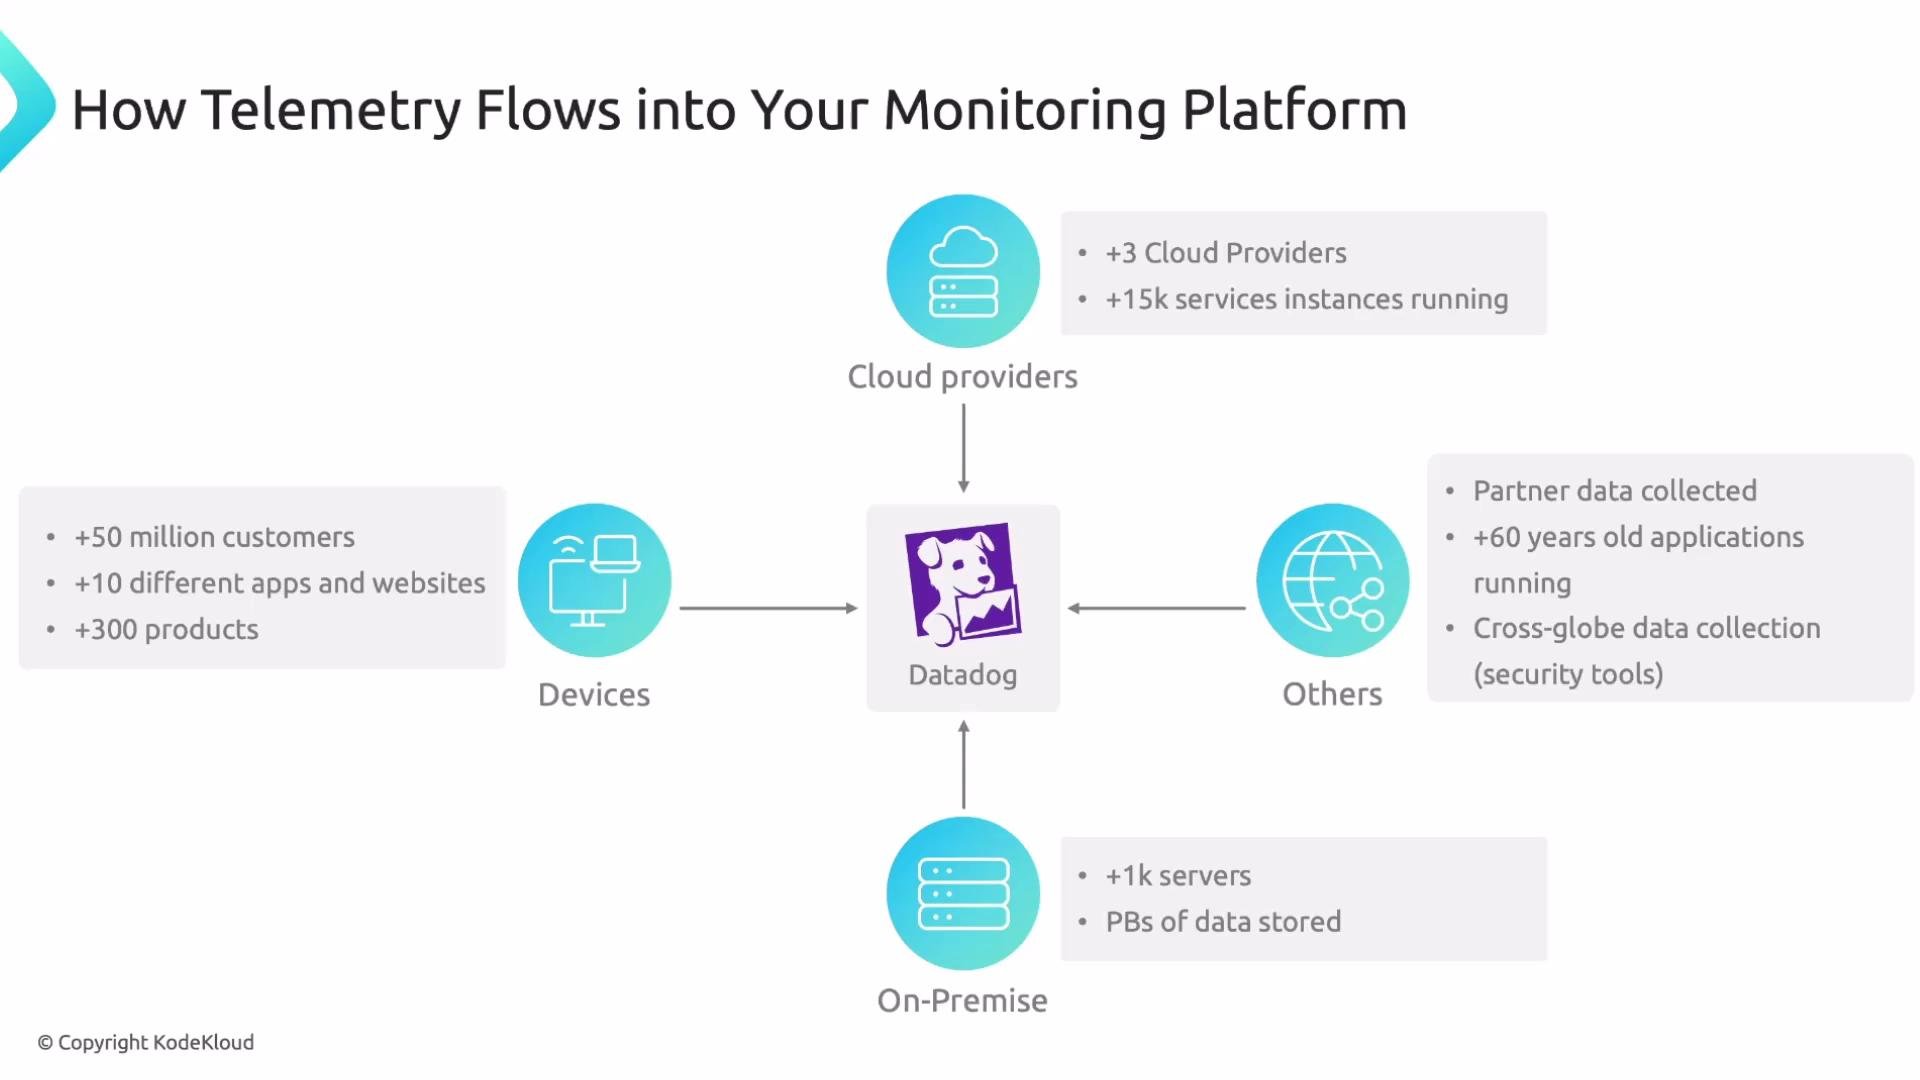
Where telemetry originates
Telemetry can come from many places across your environment:- End-user devices (browsers, mobile apps, IoT/wearables)
- Infrastructure (VMs, containers, serverless functions)
- Cloud provider services and managed platforms
- On-premises servers and legacy systems
- Third-party integrations and partner data feeds
- Custom instrumentation in business-critical services
This subdivision helps implement controls, apply security boundaries, and determine optimal collection points.
In modern systems, data sources emit a large and continuous volume of telemetry. That volume can quickly become costly and noisy if not managed intentionally.
Designing a scalable ingestion strategy
Because telemetry volume grows rapidly, treat ingestion as a design decision rather than an afterthought. Use the following practices to keep cost and noise under control while preserving observability value.
Practical checklist:
- Start with availability, performance, and error telemetry for critical services.
- Validate the business value before increasing retention or instrumenting additional sources.
- Apply consistent naming conventions and tags across services.
- Set log sampling rules and trace sampling rates per service.
- Monitor ingestion metrics (bytes ingested, events/sec, cardinality) for anomalies.
When designing ingestion, prioritize telemetry that answers your key questions: Is the service available? Is performance within SLO? Are errors rising? Begin with essential telemetry, validate its value, then expand integrations and retention as needed.
High-cardinality tags and unfiltered verbose logs are common causes of unexpected costs and query slowness. Apply tag governance and log-reduction rules early to avoid runaway ingestion bills.
Tips for implementation
- Use official Datadog agents and integrations where possible to simplify collection and security.
- For cloud-native environments, instrument at the service level (APM + traces) and rely on exporters for metrics (e.g., Prometheus exporters).
- Implement structured logging to make logs searchable and to enable efficient parsing and indexing.
- Leverage telemetry sampling: adjust trace sampling dynamically for high-traffic endpoints.
- Monitor your observability platform’s own telemetry (ingestion rates, costs, quota usage) and set alerts on unexpected changes.
- Datadog Observability: https://docs.datadoghq.com/
- Observability best practices: https://www.datadoghq.com/solutions/observability/