In this lesson we cover what Datadog is and how it helps organizations meet monitoring, observability, and security objectives. Datadog is a cloud-based observability and security platform that centralizes telemetry across an organization’s entire stack. It collects and correlates metrics, traces, and logs, while providing first-class features for application performance monitoring (APM), real user monitoring (RUM), synthetic testing, infrastructure monitoring, network performance, and security monitoring. This unified approach delivers end-to-end visibility—from frontend applications and services through cloud platforms and on-premises infrastructure to databases—so teams can rapidly detect, investigate, and remediate issues. Key benefits include:
  • Unified telemetry: correlate frontend errors with backend traces and infrastructure metrics to reduce mean time to resolution (MTTR).
  • Security + observability: enrich security events with contextual telemetry for faster investigation.
  • Broad integrations: native and community integrations across cloud providers, container platforms, orchestration systems, databases, and third-party services.
  • Advanced analytics: AI/ML-powered anomaly detection, automated root cause analysis, and forecasting.
  • Open standards and modern tech: support for OpenTelemetry, eBPF, and deep Kubernetes integration.
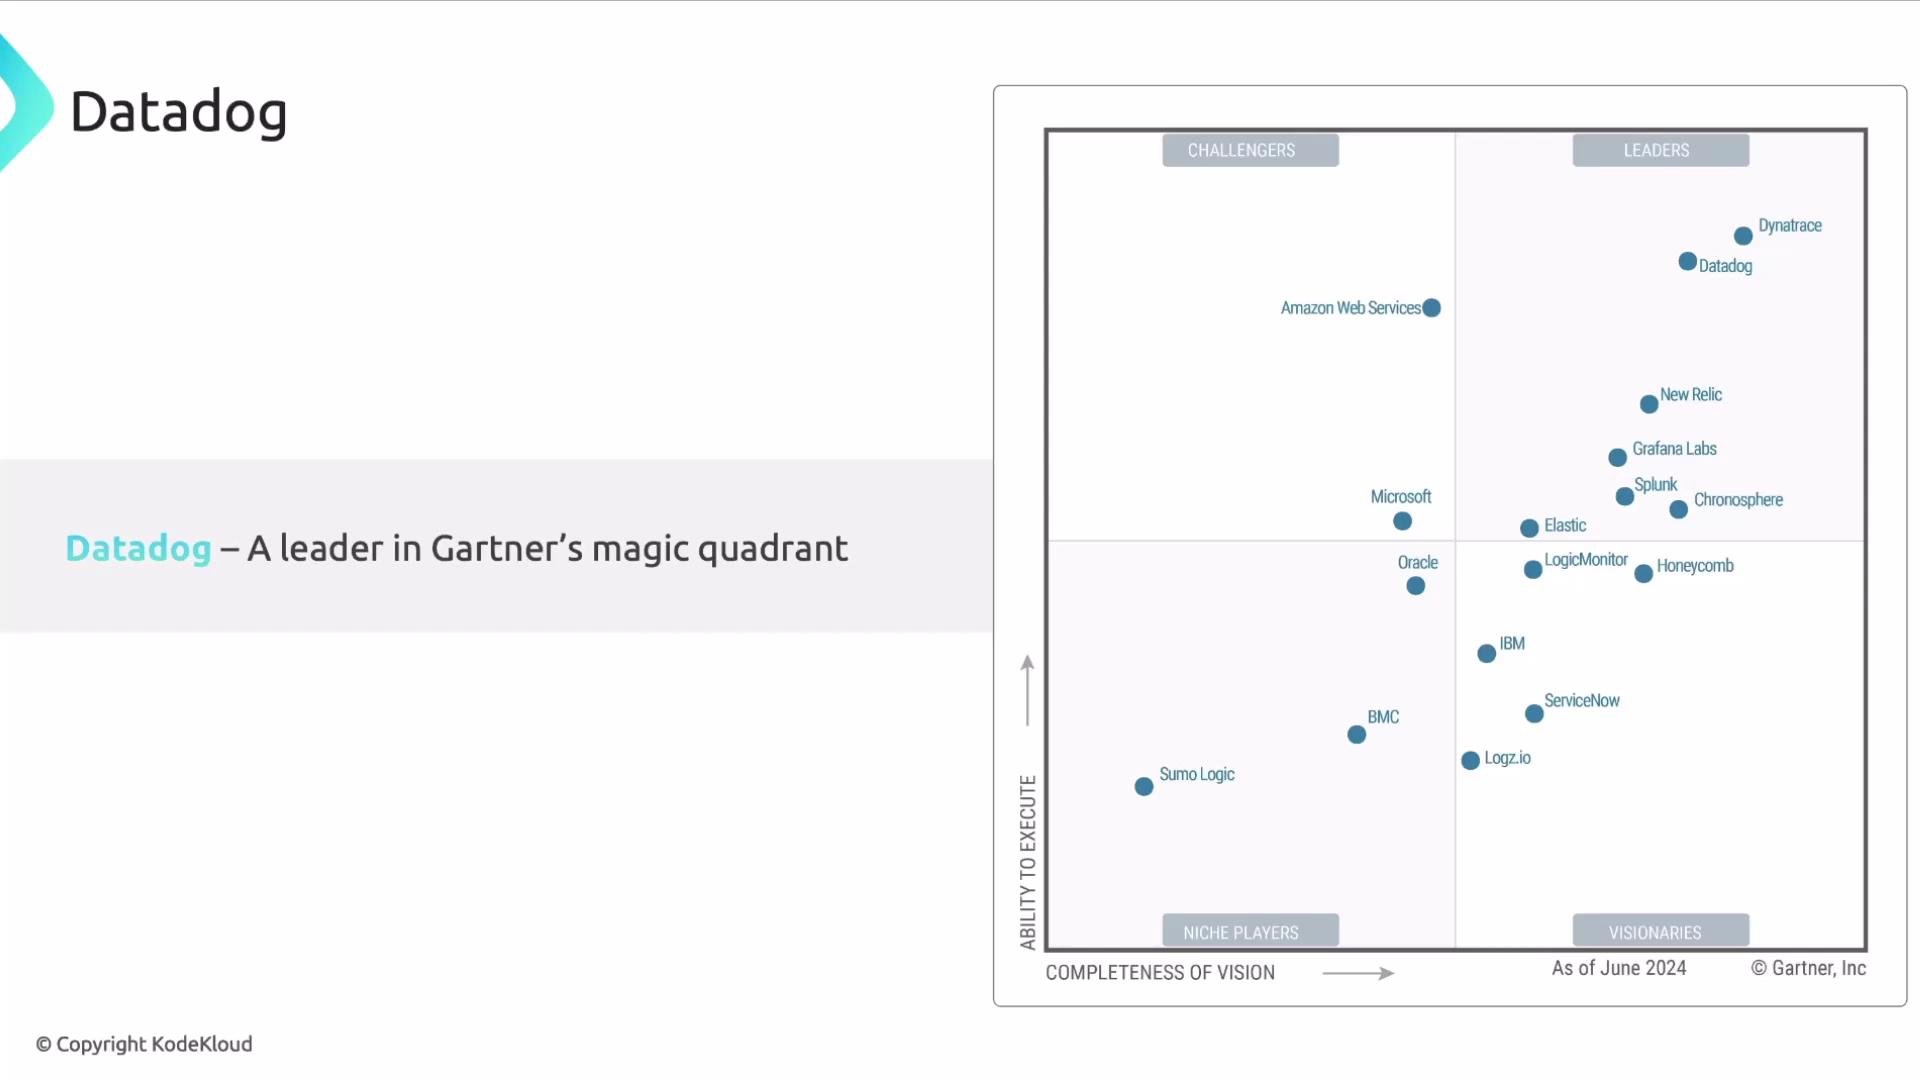
The image shows Datadog highlighted as a leader in Gartner's Magic Quadrant for Application Performance Monitoring, with other companies positioned in different quadrants based on "Ability to Execute" and "Completeness of Vision."
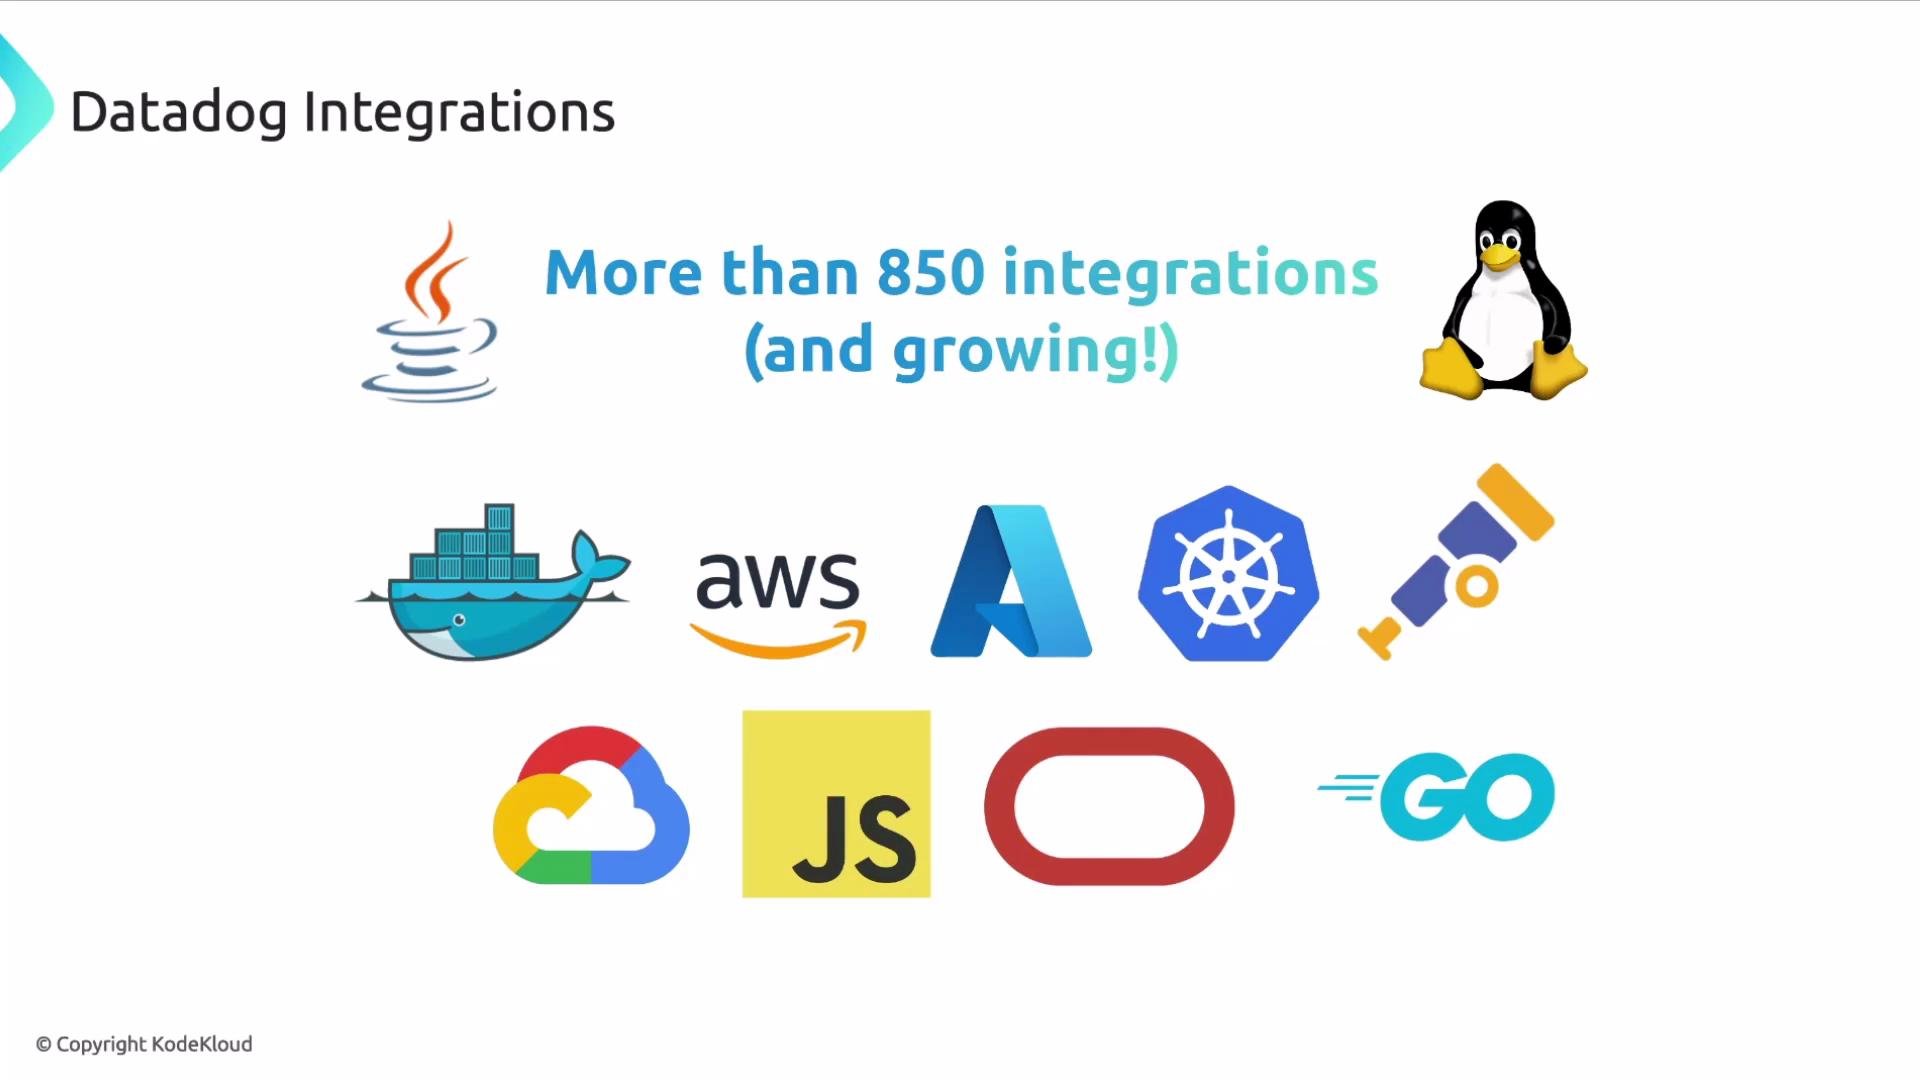
Datadog supports telemetry collection from many operating systems and dozens of programming languages (JavaScript, Java, Go, Python, Ruby, .NET, and more). It maintains hundreds of official integrations and community-supported plugins, enabling monitoring across nearly all common platforms and environments.
The image shows logos of various technology platforms and languages like Java, AWS, Azure, Docker, Kubernetes, Linux, and more, highlighting Datadog's integration capabilities. It mentions that Datadog supports more than 850 integrations.

Core Datadog capabilities

CapabilityWhat it doesExample use case
Metrics, traces, logsCentralize and correlate time-series metrics, distributed traces, and logsLink a slow API trace to increased database latency
APM & RUMMonitor service performance and real user experienceIdentify a frontend regression causing higher error rates
Synthetic monitoringAutomate uptime and API checksSchedule a synthetic test for critical transaction workflows
Infrastructure & network monitoringVisualize host/container metrics and network flowsDetect noisy neighbors on a Kubernetes node
Security monitoringDetect threats and misconfigurations using telemetryAlert on suspicious inbound connections or anomalous process behavior

Getting started (high level)

  • Install the Datadog Agent on hosts, VMs, or as a DaemonSet in Kubernetes to collect metrics, logs, and traces.
  • Enable language-specific APM libraries (Java, Python, Node, etc.) to capture distributed traces.
  • Configure integrations for cloud providers, databases, and third-party services to enrich telemetry.
  • Create dashboards, monitors, and synthetic tests to observe SLAs and SLOs across systems.
Start with the Datadog Agent and one APM integration for a quick win: install the Agent, enable tracing for one service, and create a dashboard that correlates traces with host metrics. See Datadog documentation for step-by-step guides.

Why teams choose Datadog

  • Fast time-to-value with out-of-the-box integrations and dashboards.
  • Unified observability and security to reduce toolchain complexity.
  • Scalable SaaS architecture for monitoring cloud-native and hybrid environments.
  • Strong ecosystem and community support for OpenTelemetry, eBPF, and Kubernetes.
Resources and further reading: That’s it for this lesson. I hope you found the overview useful and that it helps you plan your observability and security strategy with Datadog.

Watch Video