

When planning a dashboard migration, treat dashboards as code: export, version, and validate visualizations before decommissioning legacy views. This reduces risk and ensures parity between old and new dashboards.
Dashboard migration: high-level workflow
Follow a repeatable process to ensure visibility is preserved and stakeholders remain informed.
Below we expand each step and include practical design and performance guidance.
1) Export all dashboard data
Most observability platforms (including Datadog) offer an export mechanism—usually JSON or YAML. Exporting captures panels, queries, template variables, layout, display options, and other metadata. Keep these exports in version control so you can:- Compare before/after states.
- Recreate dashboards programmatically.
- Audit changes during the migration.
- Export each dashboard JSON/YAML.
- Verify template variables and linked queries are present.
- Record dashboard ownership and permissions.
2) Structure and organize panels
Recreate dashboards so they are easy to navigate and maintain.- Group related visualizations into logical sections (e.g., latency, errors, throughput).
- Use collapsible groups inside dashboards to reduce visual noise.
- Standardize naming, descriptions, and template variables to make dashboards discoverable.
- Favor several focused dashboards over one monolithic dashboard that tries to show everything.
- Faster troubleshooting (teams find relevant panels quickly).
- Easier reuse of panels by other teams.
- Better performance and maintainability.
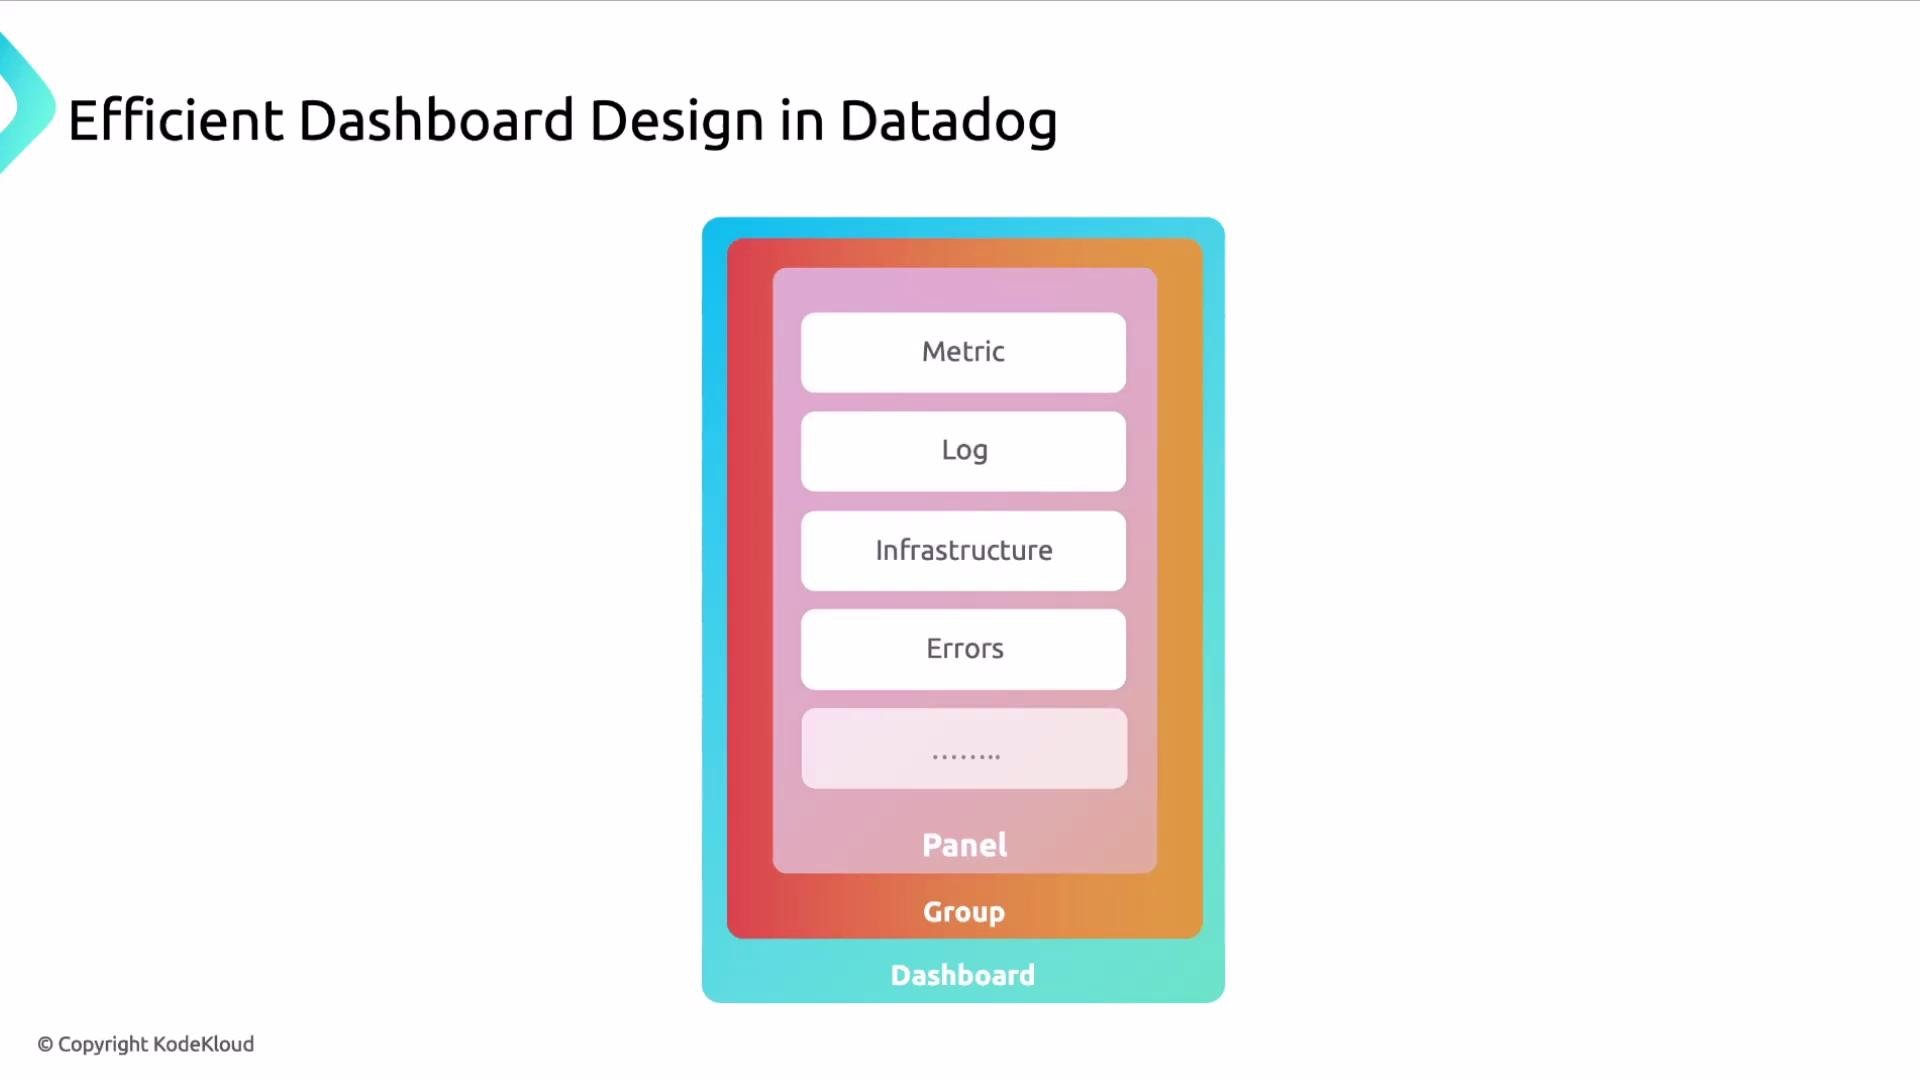
Performance considerations
Dashboard performance directly impacts incident response and user experience. Avoid placing too many heavy queries, high-cardinality or long time-range queries across dozens of visible panels. Use template variables and collapsed groups to limit the number of simultaneous queries. Tips to improve load time:- Limit query time ranges for default views.
- Use aggregations and rollups where possible.
- Collapse rarely used groups or move them to separate dashboards.
- Cache or snapshot expensive queries if platform supports it.
Avoid placing too many high-cardinality or long-time-range queries across dozens of visible panels. Keep dashboards focused and use groups/templates to reduce rendering cost and query load.
Collaboration and discoverability in Datadog
Datadog supports scale-focused features to help teams share and manage dashboards:- Dashboard lists: curate related dashboards for teams or functions.
- Sharing and permissions: grant access so teams can reuse panels and iterate faster.
- Copyable panels and groups: speed up adoption and standardization across teams.
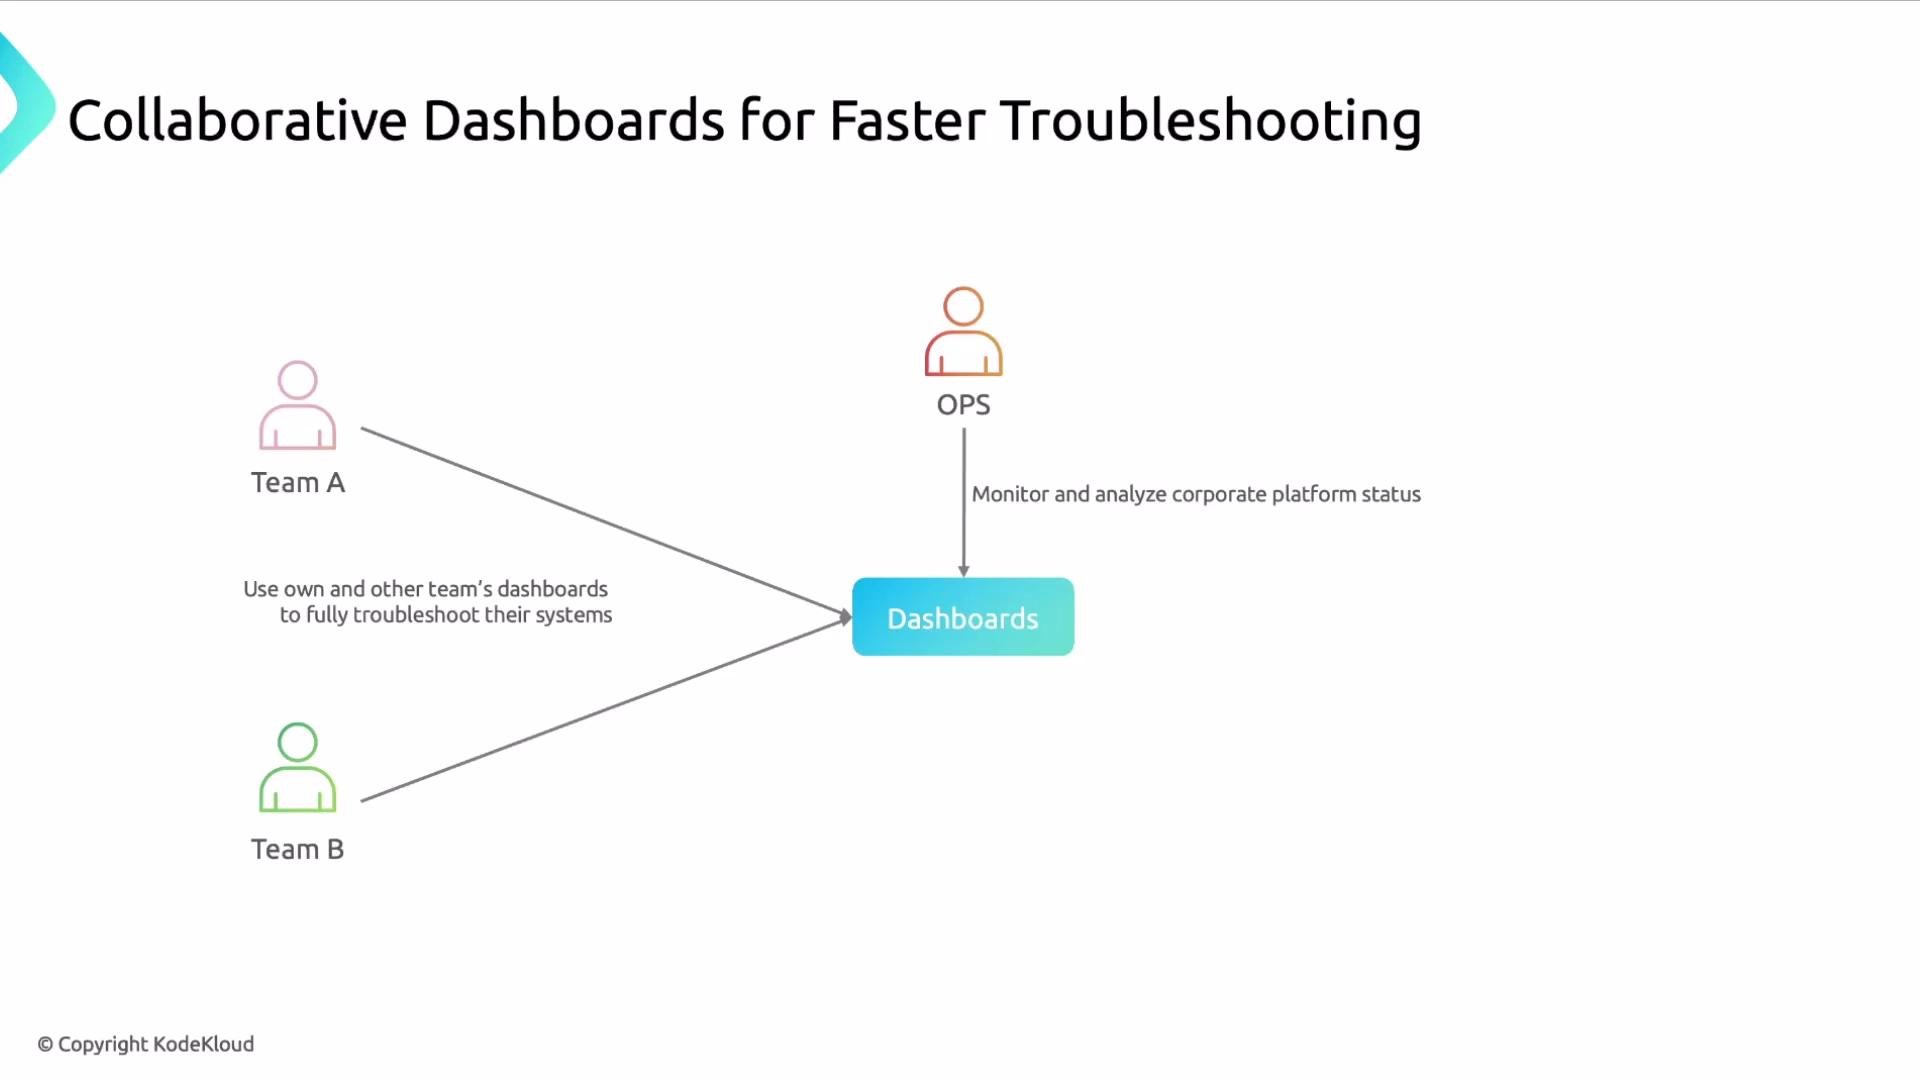
- Engineering teams get faster debugging paths.
- Centralized operations monitor across environments.
- Stakeholders receive consistent, reliable KPIs.
What dashboards enable
By converting telemetry into clear dashboards:- Business teams make better data-driven decisions.
- Managers and executives review KPIs more effectively.
- Operations and SREs detect and act on incidents faster.
Scheduled reports and automated delivery
Include scheduled reports as part of your visibility strategy. Reports automate delivery of key views and summaries—common examples include incident counts, recent production deployments, and cost overviews. Reports can be delivered as emails, images/snapshots, or sent to collaboration tools and distribution lists.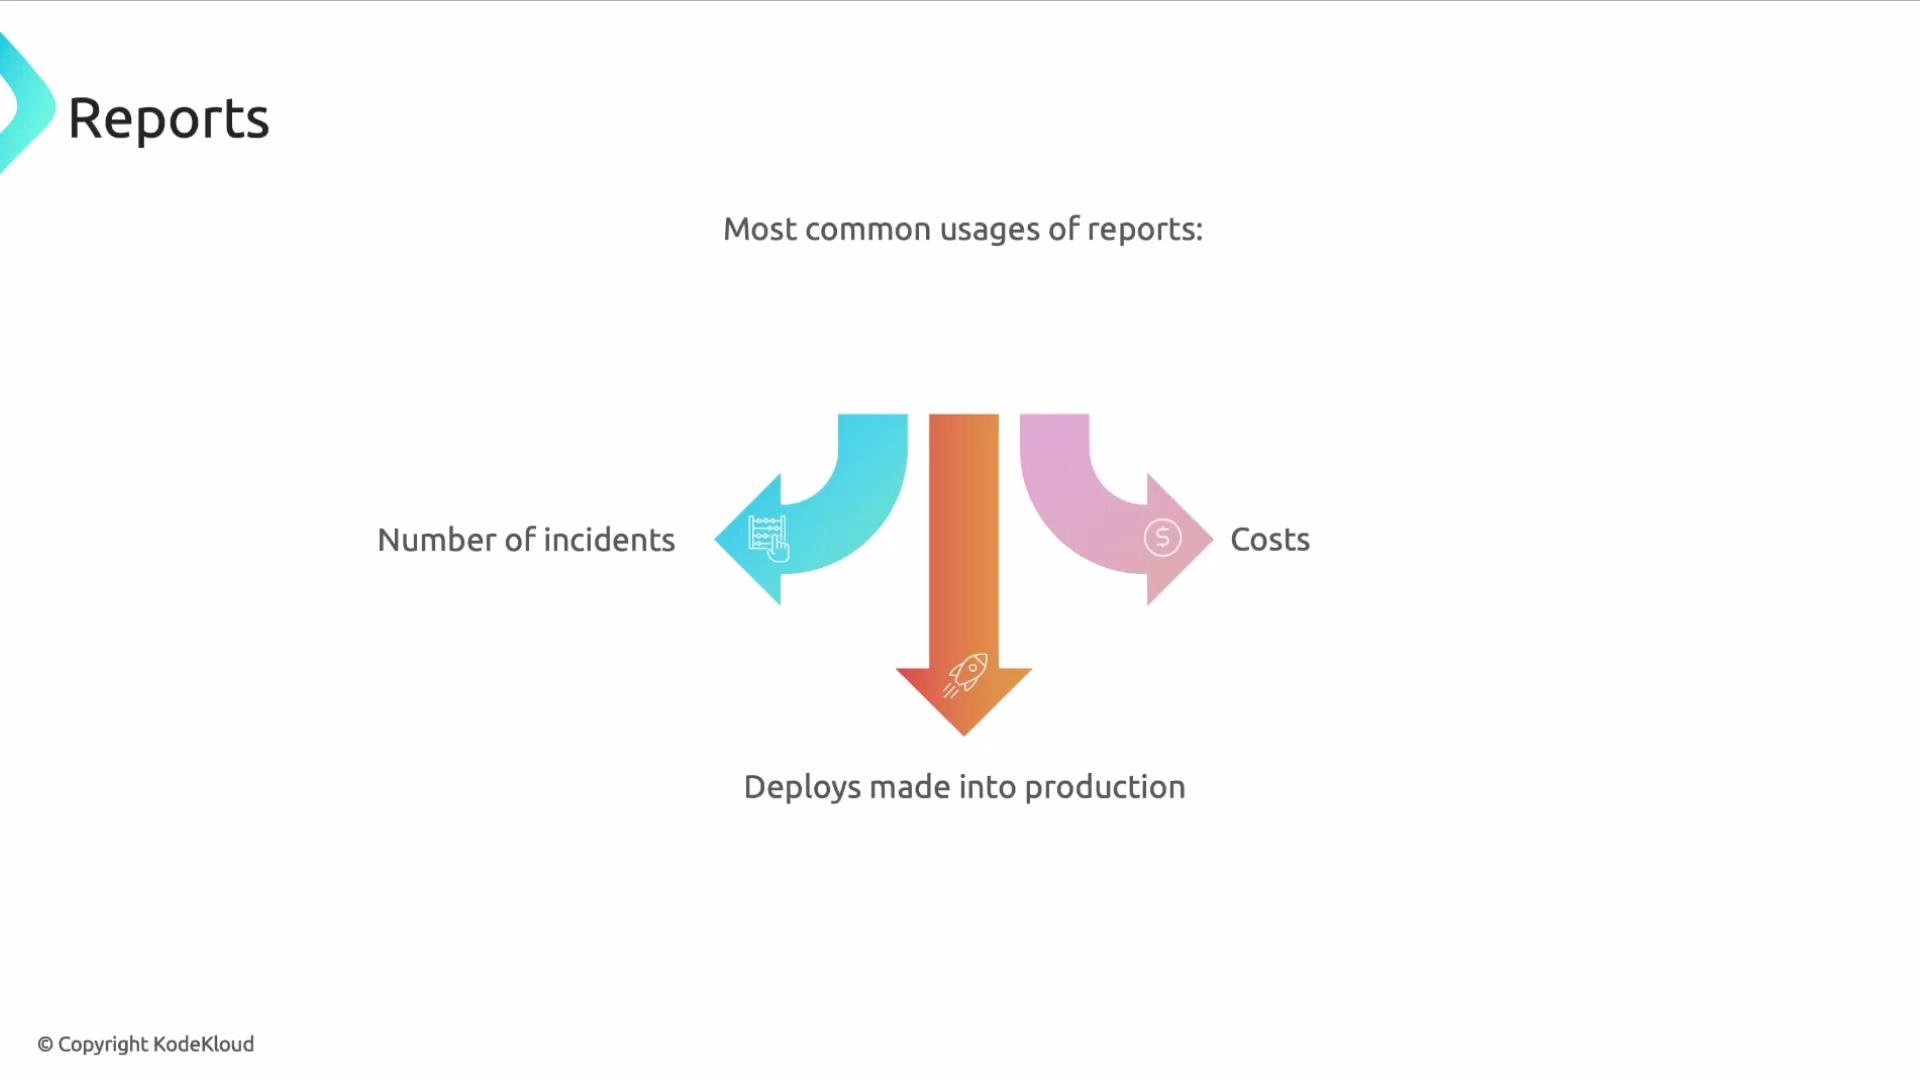
- Query or summarize data (metrics, logs, traces).
- Generate an output (email body, image snapshot, PDF).
- Deliver to stakeholders or target groups determined by the platform.
- Weekly incident summaries for engineering managers.
- Daily cost reports for finance/ops.
- Post-deployment health summaries for product owners.
Best practices checklist
Resources
- Datadog Dashboards: https://docs.datadoghq.com/dashboards/
- Observability best practices: https://www.oreilly.com/library/view/observability-by-example/