This lesson focuses on practical incident response: detecting issues, mobilizing teams, identifying root causes, and preventing recurrence. As a DevOps engineer or Site Reliability Engineer (SRE), you’ll spend as much time responding to incidents and stabilizing systems as you do building new features and tooling. Continuous monitoring and clear alerting let you act quickly when problems emerge.
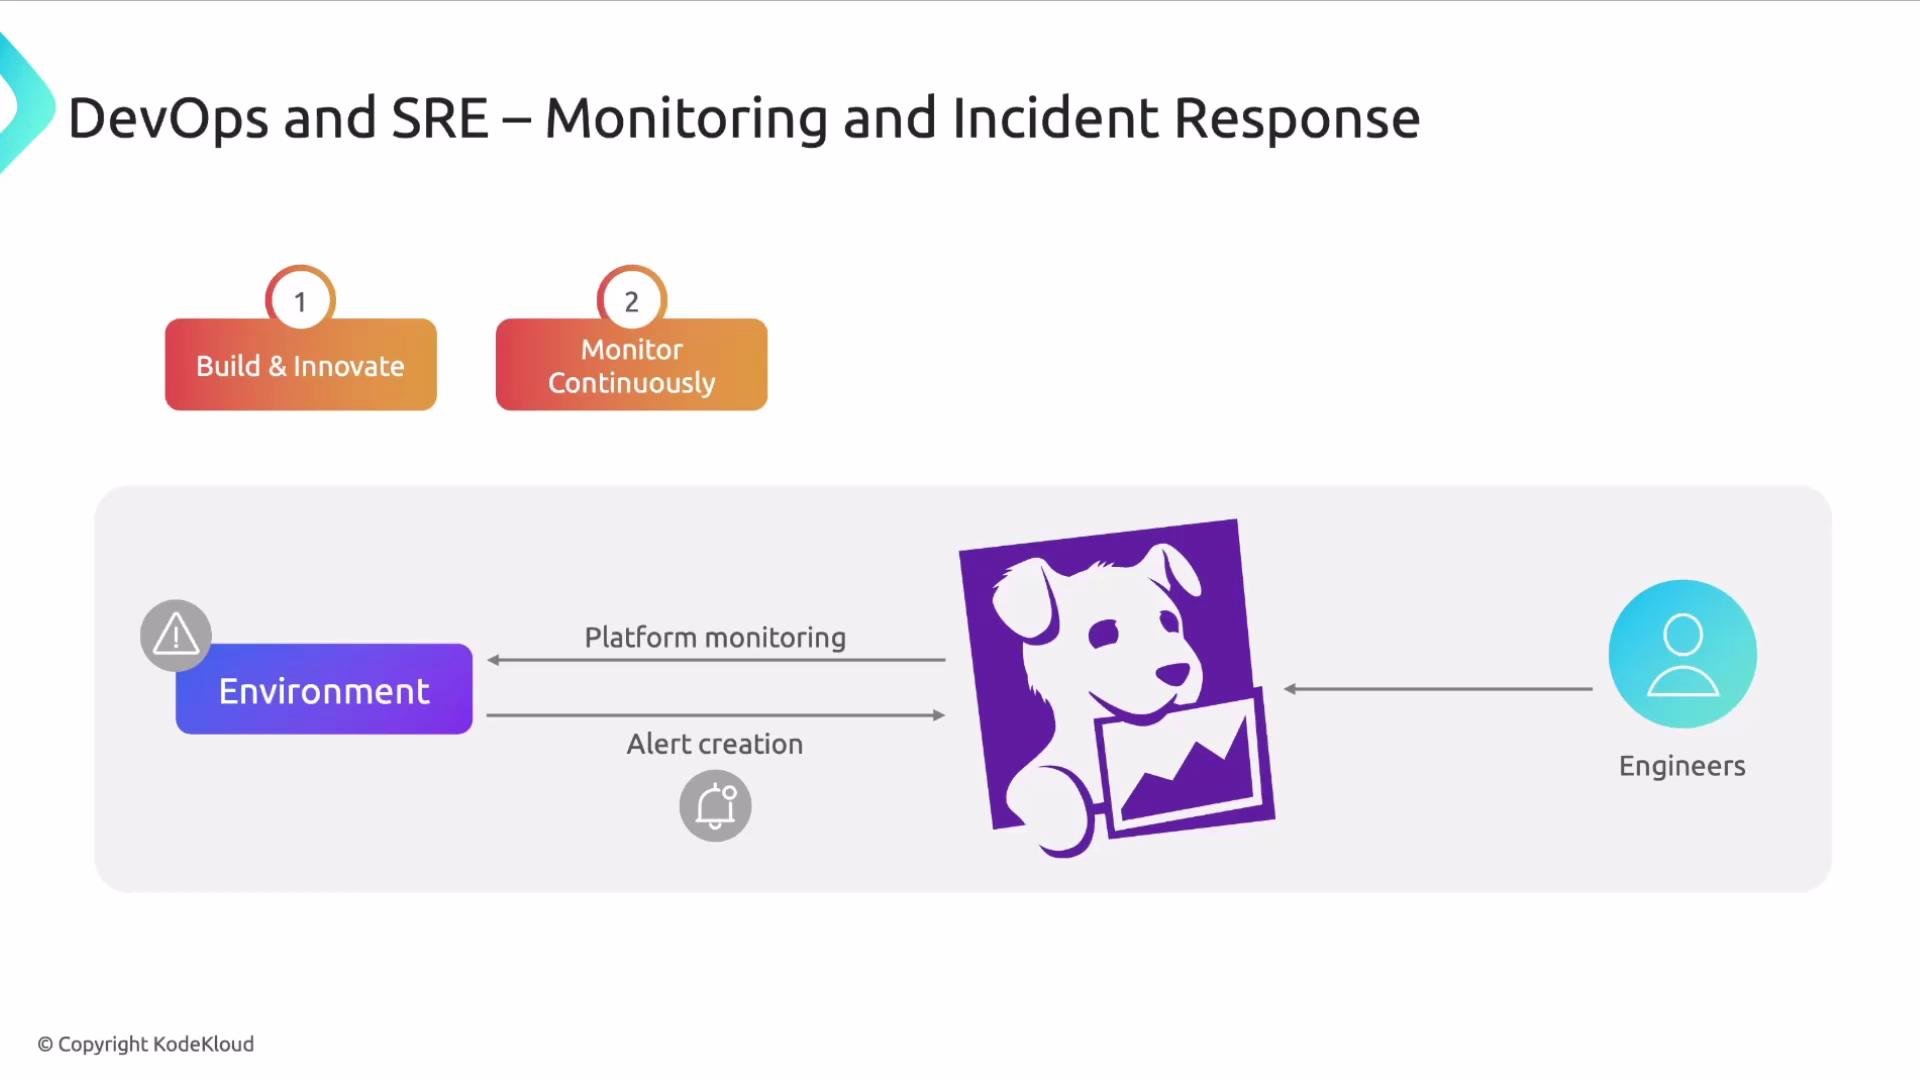
The image illustrates a DevOps and SRE process for monitoring and incident response, highlighting steps like building, innovating, and continuous monitoring, involving platform monitoring and alert creation for engineers.

Why monitoring and alerting matter

We instrument applications and infrastructure to surface signals—metrics, logs, and traces—that indicate system health. With a centralized alerting solution (in this lesson, Datadog monitors), engineers receive notifications when predefined thresholds or anomaly detections trigger. This reduces the need to constantly watch dashboards and enables faster, data-driven responses.

From alert to incident: triage and mobilization

Alerts commonly spawn incidents that bring multiple teams together to investigate. The initial incident triage should answer:
  • What threshold or condition was triggered?
  • When did the incident begin and which hosts or services are affected?
  • What related events (deployments, configuration changes, security/FinOps actions) occurred recently?
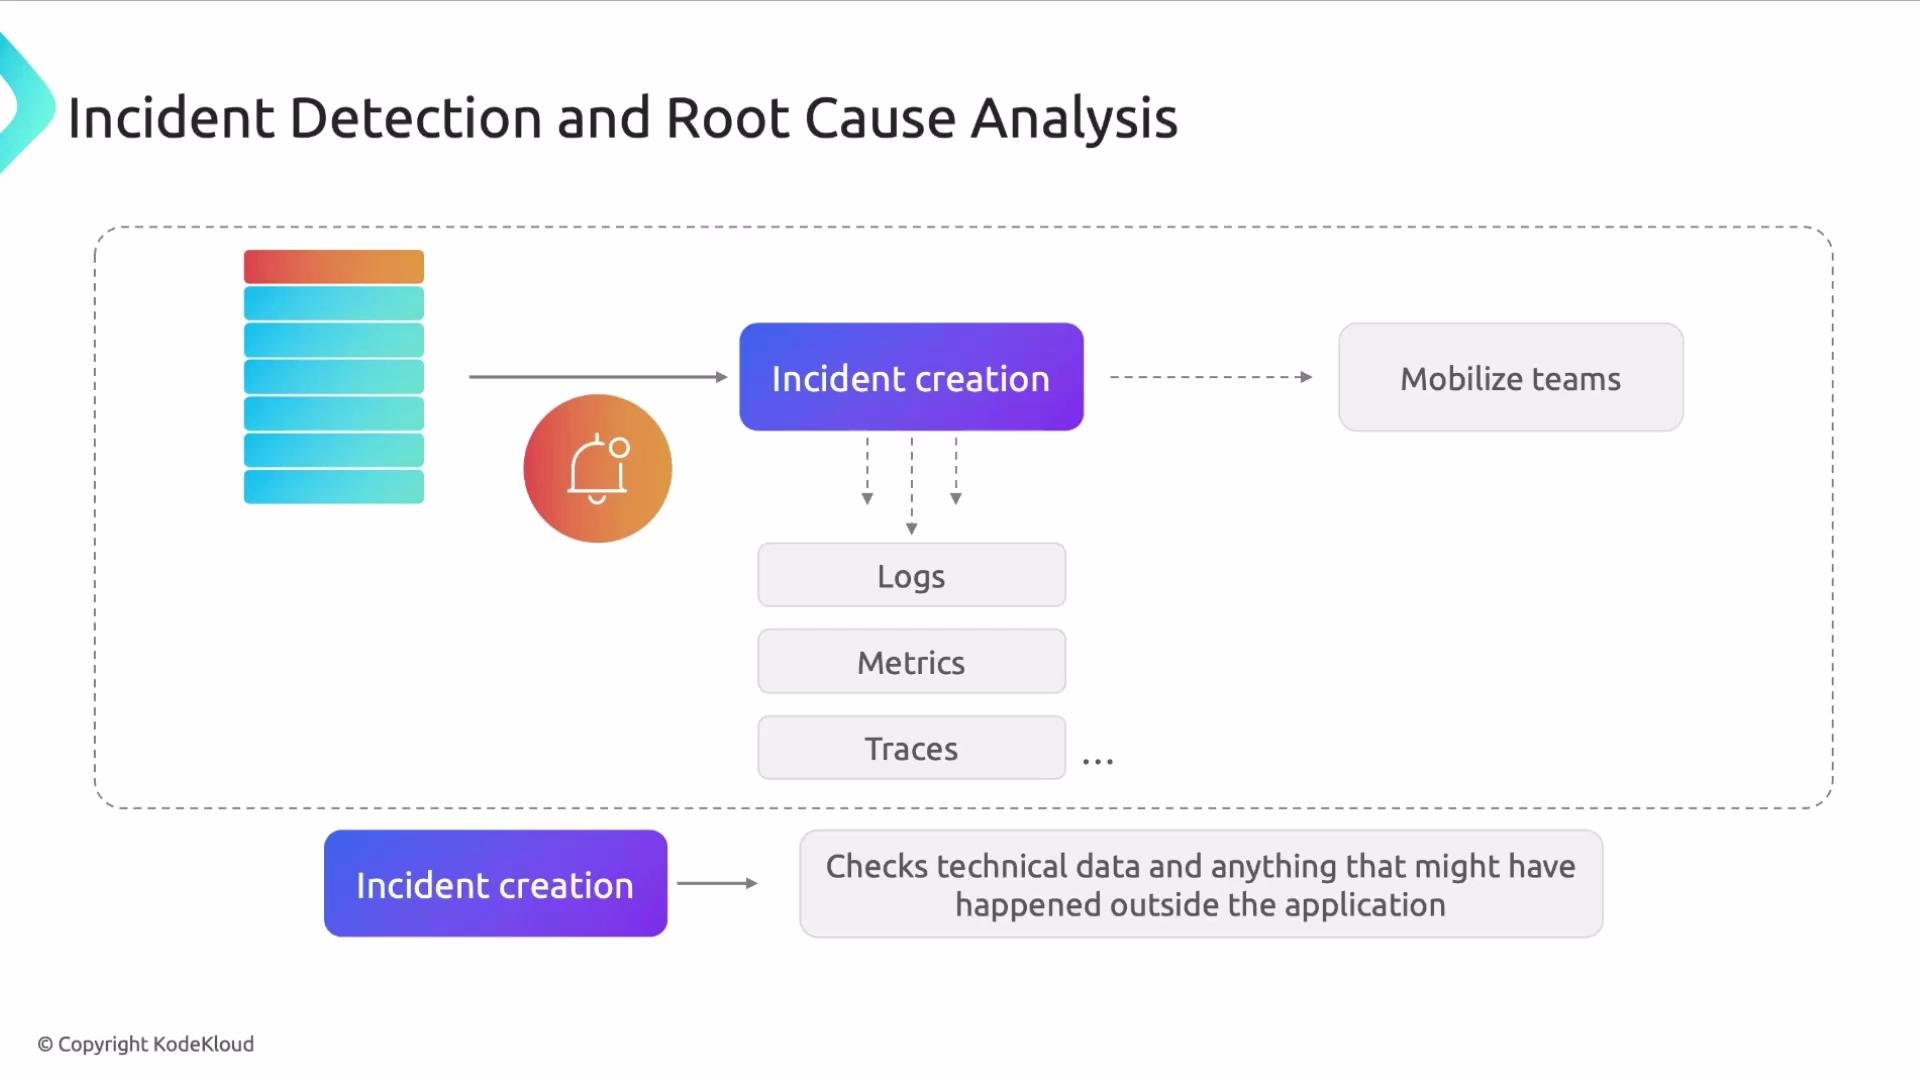
Teams use telemetry (logs, metrics, traces) plus contextual change history to narrow down the root cause.
The image is a diagram illustrating the process of incident detection and root cause analysis, involving steps like incident creation and mobilizing teams, using data from logs, metrics, and traces.

Notifications and collaboration channels

Observability platforms like Datadog can automatically create incidents and post real-time alerts to collaboration tools such as Slack or Microsoft Teams. These notifications should include:
  • Short summary of the issue
  • Links to relevant dashboards, runbooks, and the Log Explorer
  • Suggested next steps or ownership
This context accelerates incident response and reduces time-to-resolution.
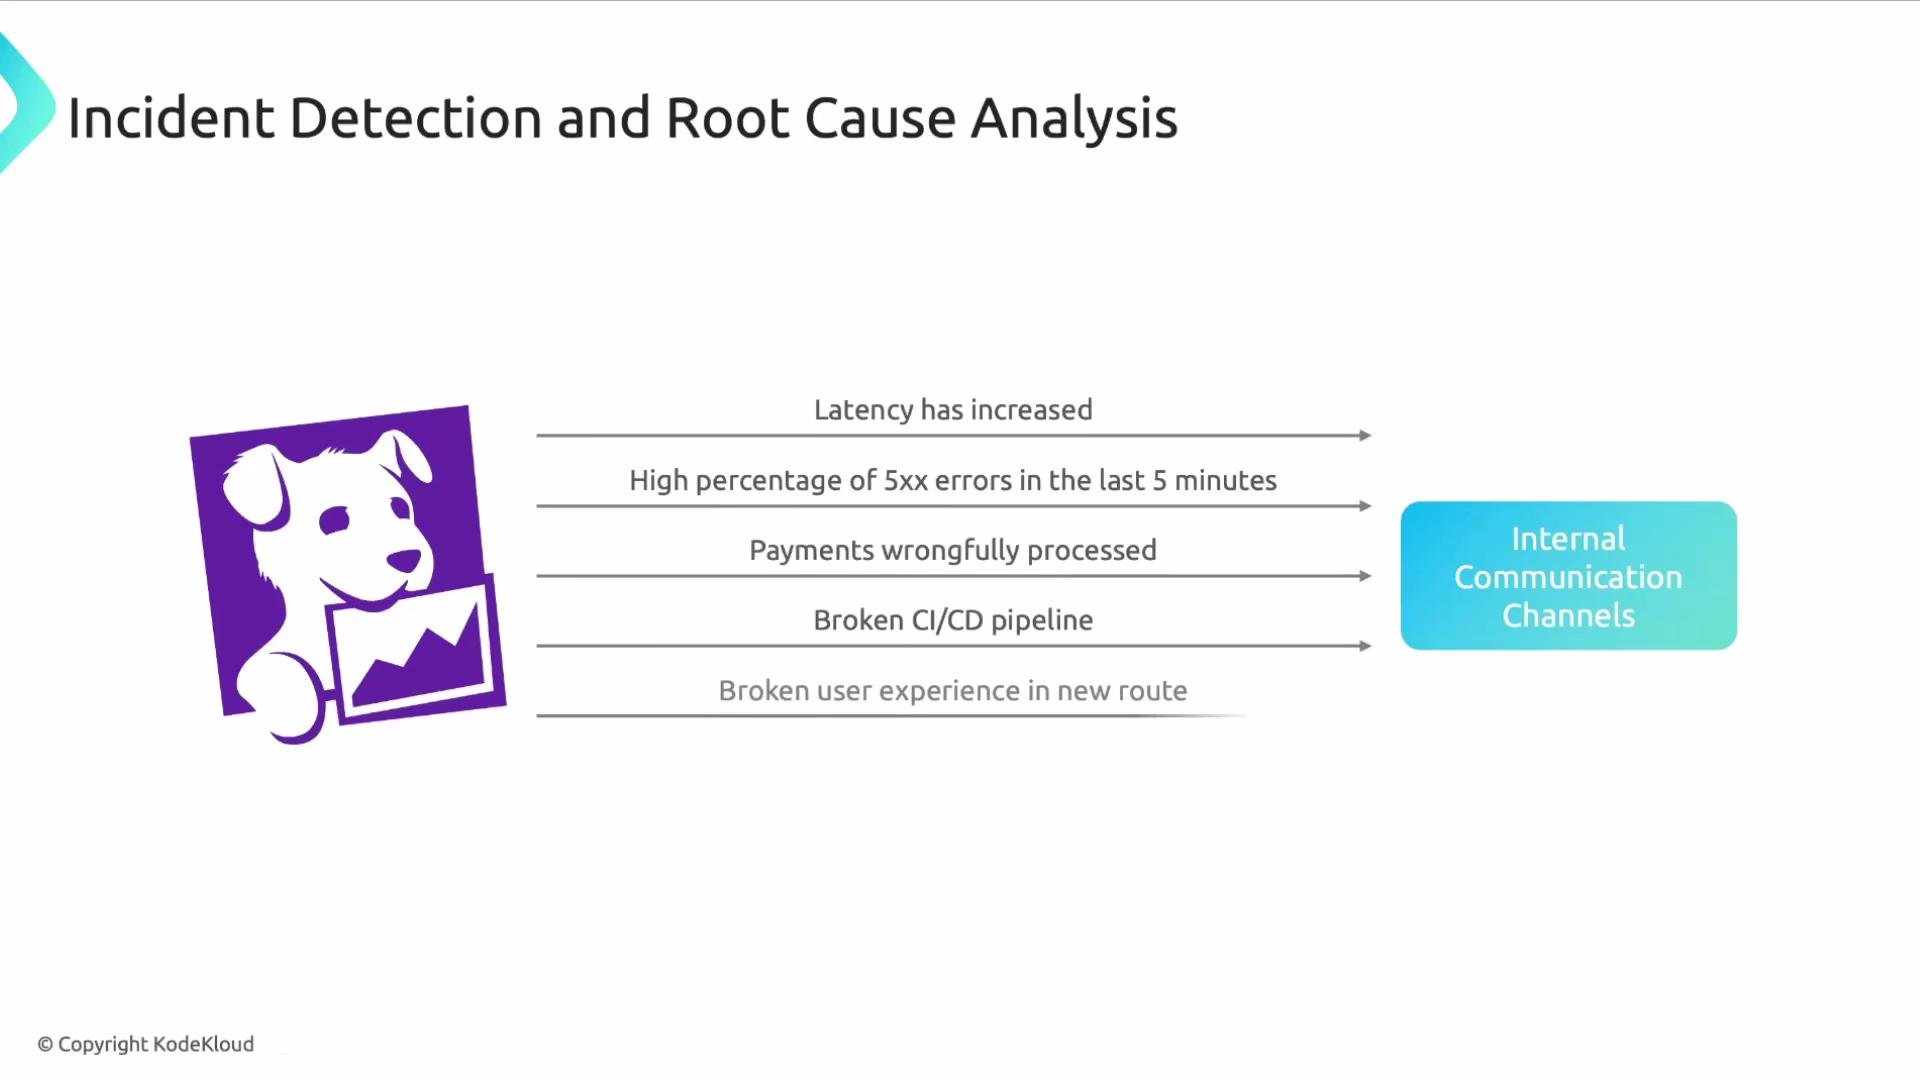
The image is a diagram illustrating "Incident Detection and Root Cause Analysis," highlighting issues like increased latency and errors, with a focus on internal communication channels. It features a purple logo depicting a dog with a graph.

Investigating alerts: logs, metrics, and traces

When an incident alert arrives, follow a structured investigation flow:
  1. Review the alert details: thresholds, time window, affected hosts/services.
  2. Open the Log Explorer to query for error messages, exceptions, or unusual events in the same timeframe.
  3. Check metrics for spikes or drops (latency, error rates, request rates).
  4. Inspect traces to identify slow or failing requests and their upstream/downstream dependencies.
Begin with the most targeted data (e.g., the service or endpoint named in the alert) and expand scope as needed.
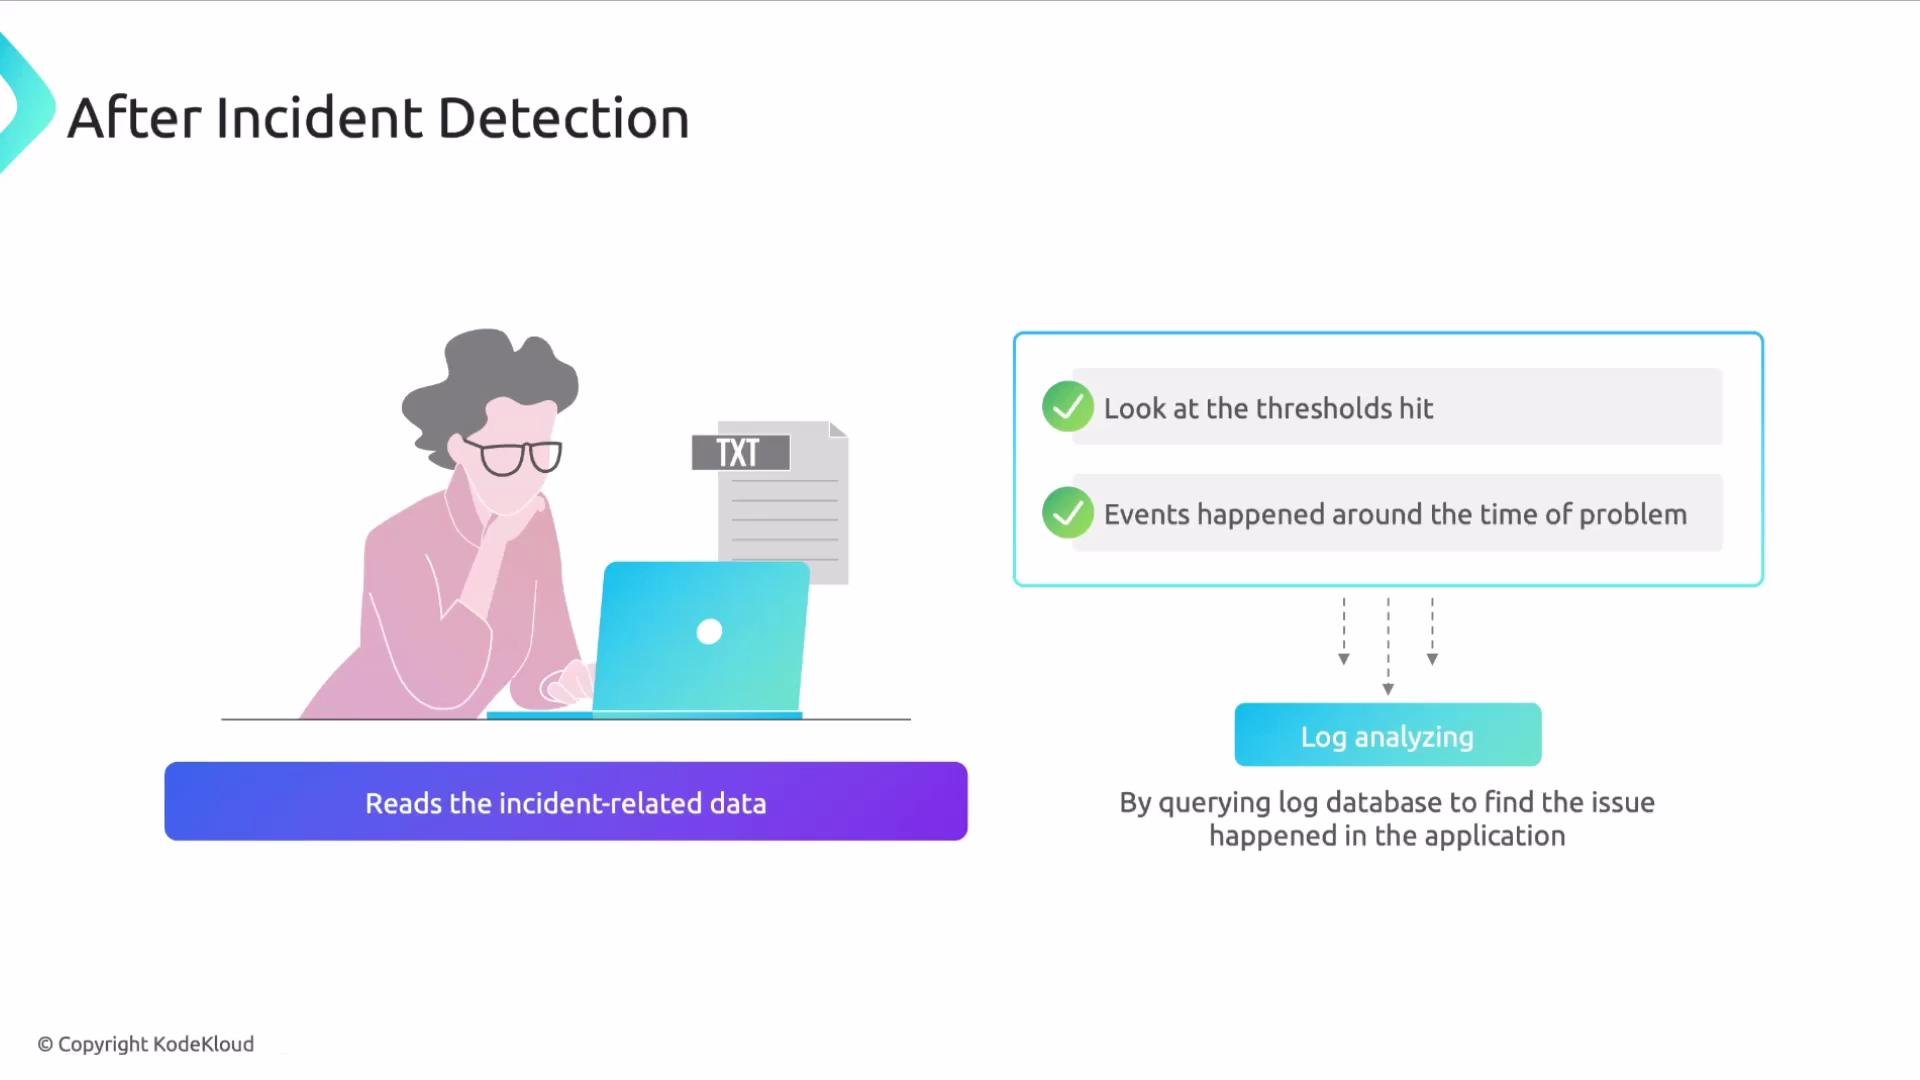
The image illustrates a process for analyzing incidents after they occur, featuring a person examining data on a laptop, checking thresholds, and analyzing logs to understand the problem.

When telemetry isn’t enough: coordinate across teams

If your logs and metrics don’t point to a clear root cause, reach out to other teams and external providers. Common external factors include:
  • Third-party API schema or behavior changes
  • Infrastructure migrations or deprecations
  • Security or FinOps actions that removed resources or altered permissions
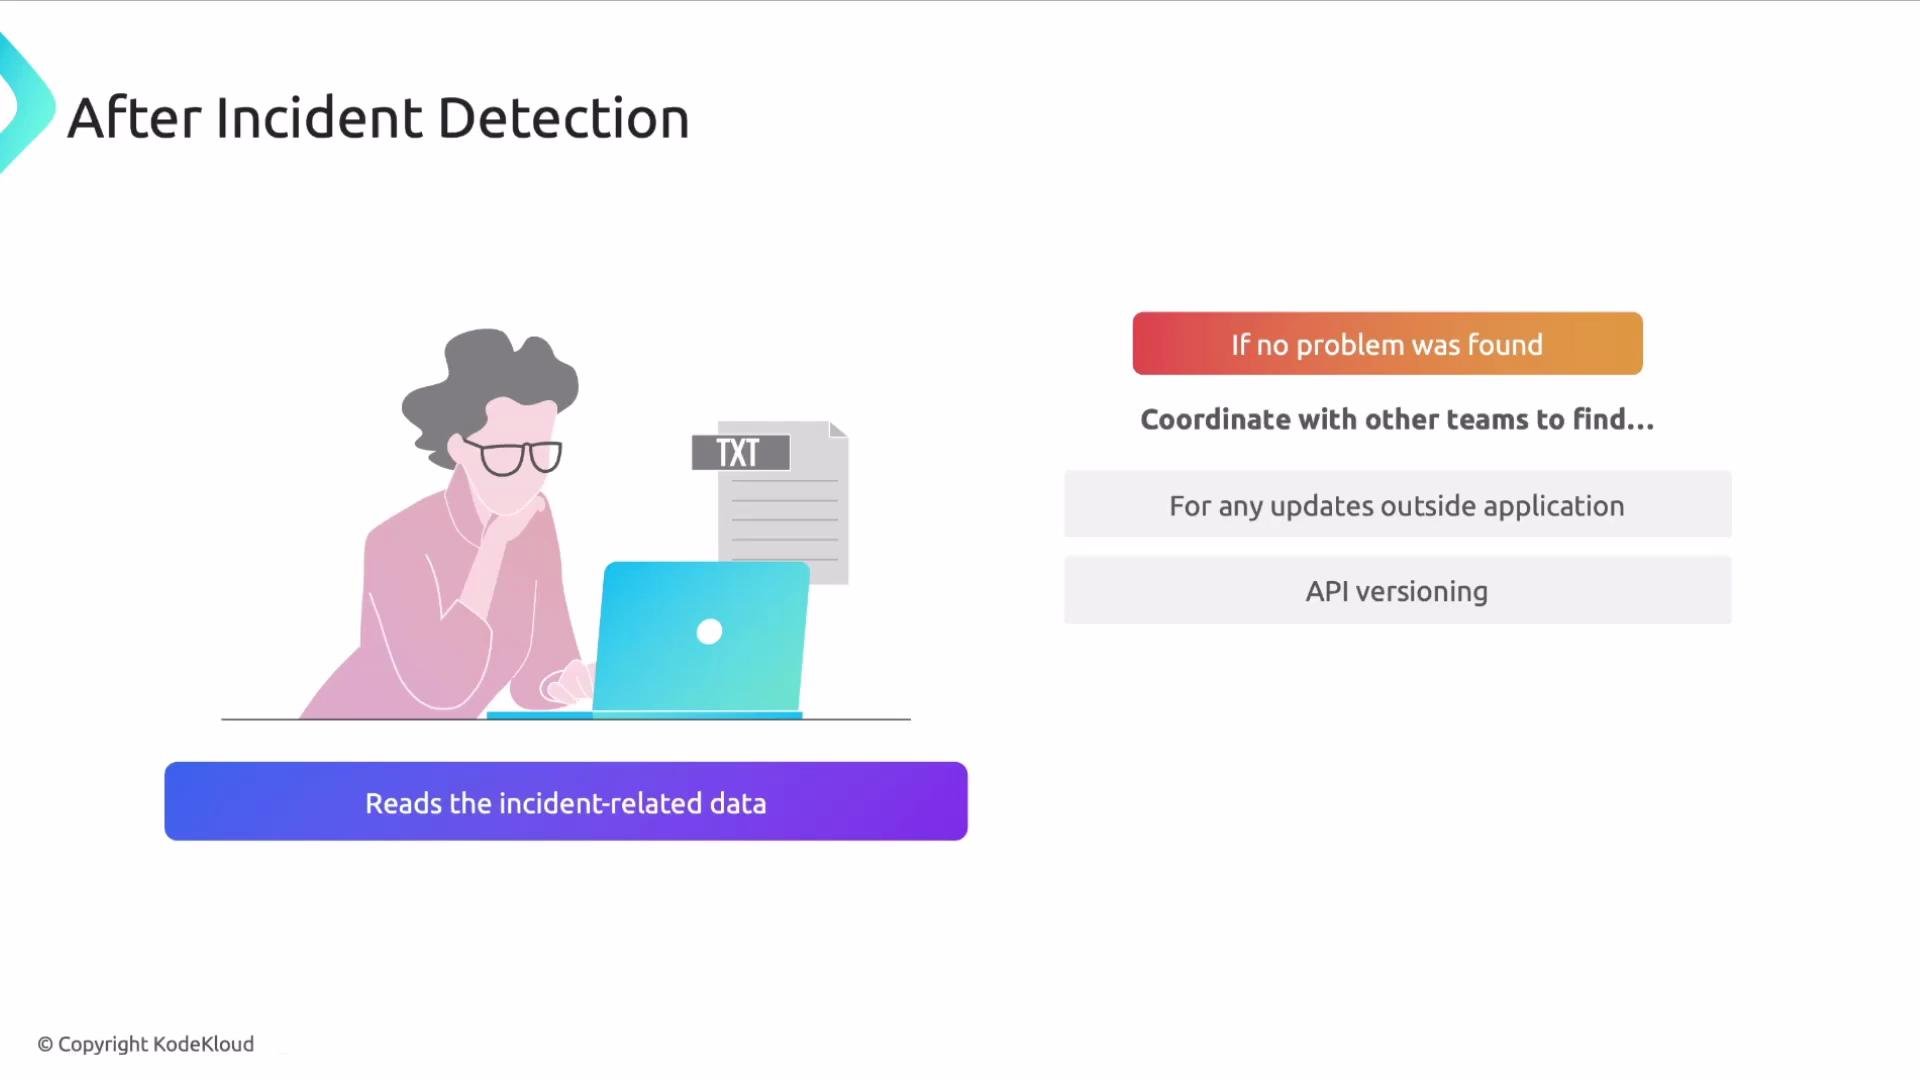
Cross-team communication is essential to surface changes that telemetry might not immediately reveal.
The image illustrates a workflow for incident detection, with a person reviewing data on a laptop, and steps like coordinating with teams and checking for updates.
Document the incident timeline, root cause, and remediation steps. Share post-incident findings and update runbooks so teams can prevent recurrence.

Incident debrief: key practices and checklist

Treat incidents as opportunities to improve systems and processes. Use the following checklist during your debrief and remediation planning:
TopicAction
Incident timelineRecord start, detection, mitigation, and resolution times
Root causeSummarize the technical failure and contributing factors
RemediationList immediate fixes and long-term engineering changes
MonitoringUpdate alerts and dashboards to detect similar issues earlier
CommunicationNotify stakeholders and publish a postmortem or summary
OwnershipAssign follow-up tasks with deadlines and owners
Key takeaways:
  • Prepare for unexpected failures through playbooks and runbooks.
  • Learn from incidents and apply fixes to brittle integrations.
  • Keep engineers aligned and informed during and after an event.
  • Continuously refine monitoring, alerting, and dependency visibility.
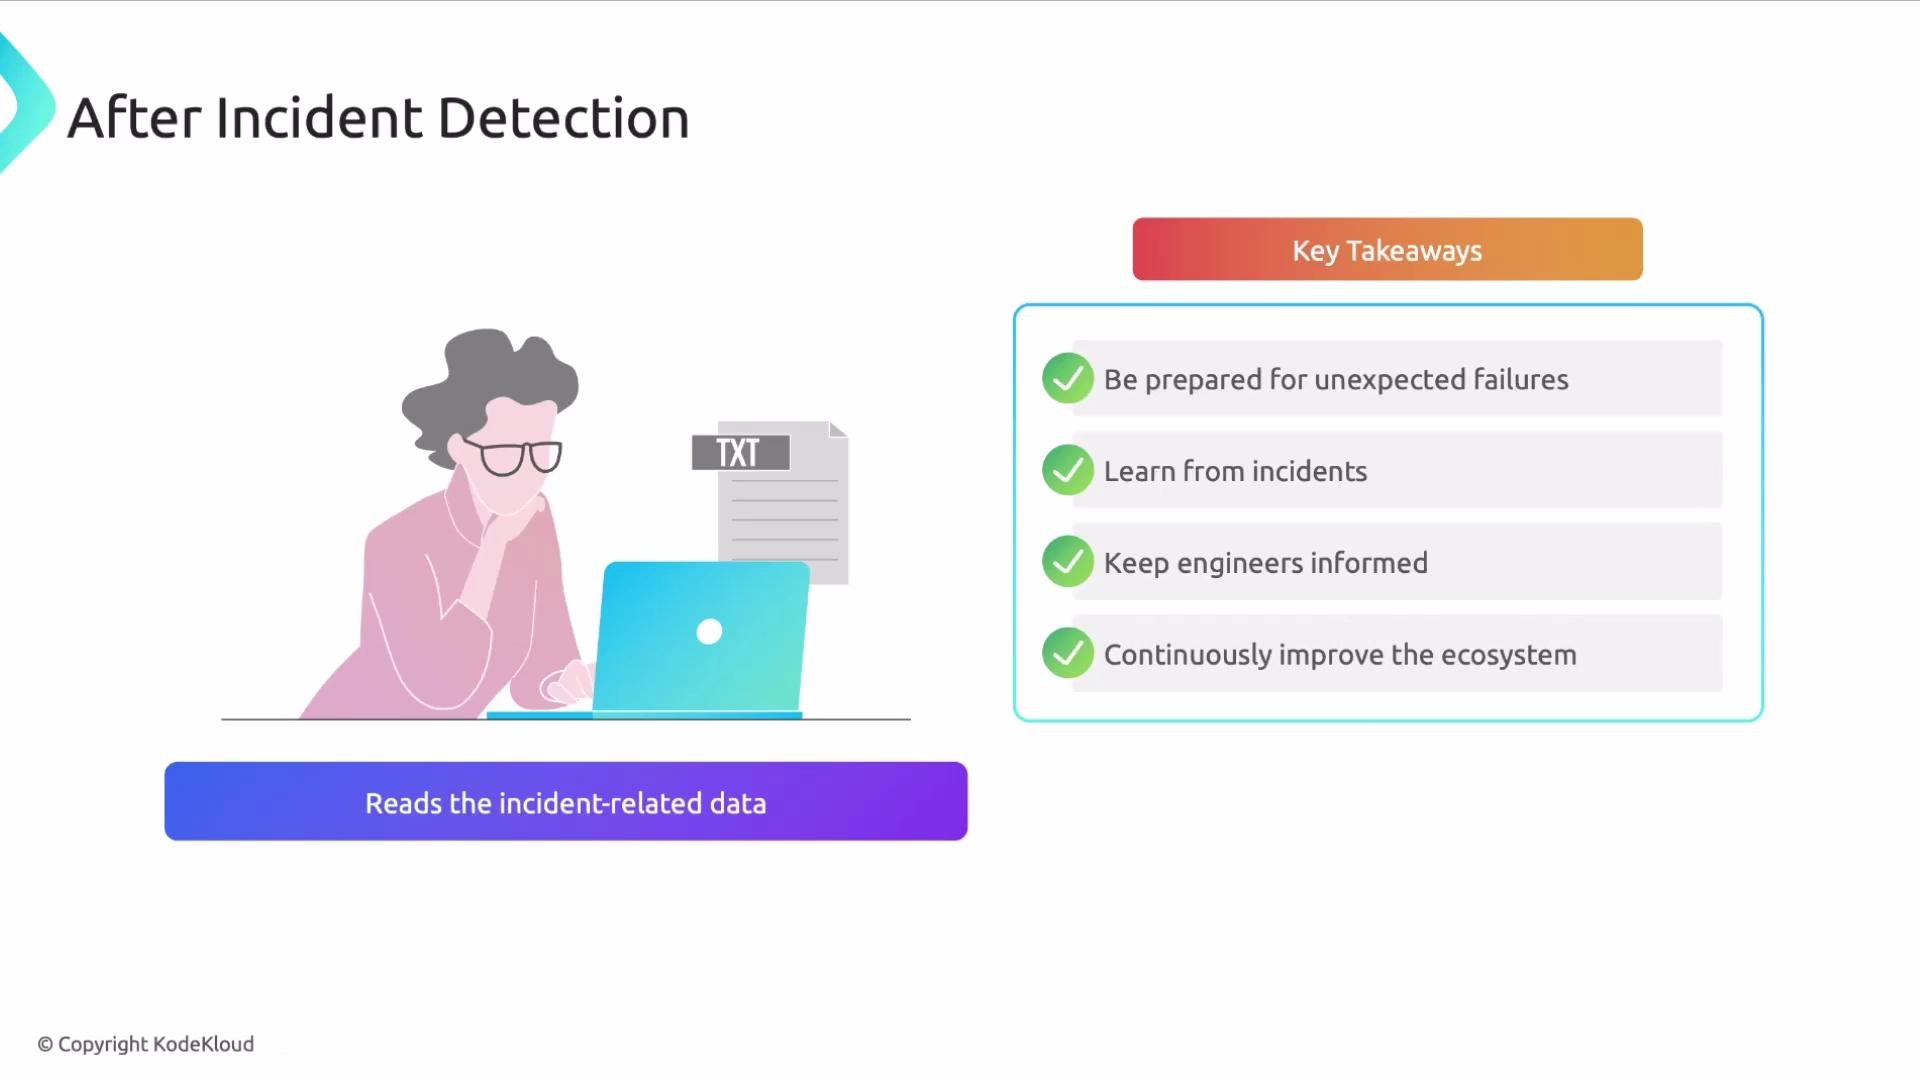
The image illustrates key takeaways for handling incidents, such as being prepared for unexpected failures, learning from incidents, keeping engineers informed, and continuously improving the ecosystem. It shows a person reading incident-related data at a computer.

Iterative analysis and the value of modern observability

Incident analysis is iterative: you’ll often pivot between metrics, logs, and traces to validate hypotheses. A unified observability platform, such as Datadog, makes it easier to correlate telemetry and surface probable root causes across services and infrastructure. This correlation becomes increasingly important as systems scale and teams add new components.
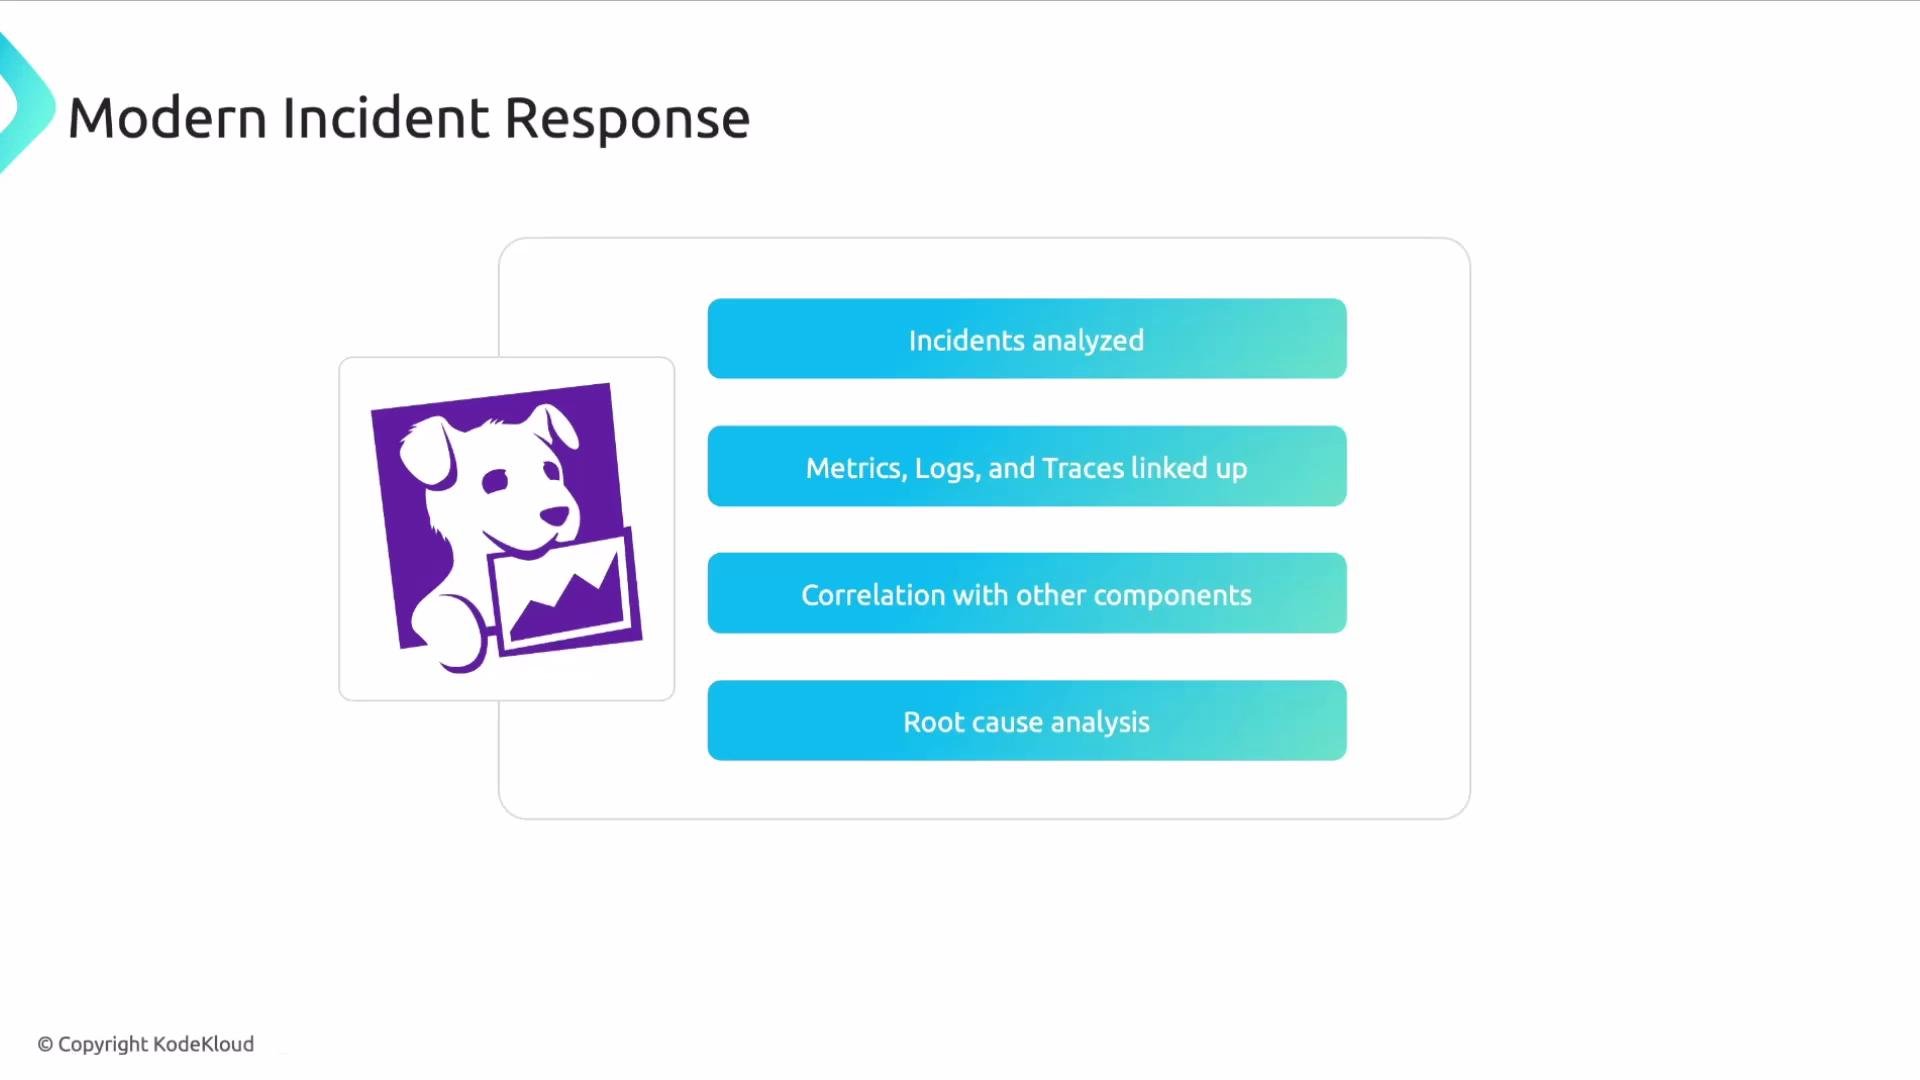
The image outlines key components of modern incident response, including incident analysis, linking metrics/logs/traces, correlating with other components, and root cause analysis. It features a graphic of a purple dog holding a chart.

Conclusion and next steps

Effective incident response depends on good telemetry, clear runbooks, strong communication, and a culture of continuous improvement. Use incidents to harden systems, refine alerting, and ensure teams can act quickly and confidently when problems arise. Further reading and references: That concludes this lesson. I hope you found it useful.

Watch Video