

Audit Prometheus before deactivating it: verify alerts, scrape targets and paths, and any metric filtering to ensure Datadog will provide equivalent coverage.
Key Prometheus items to verify before migrating
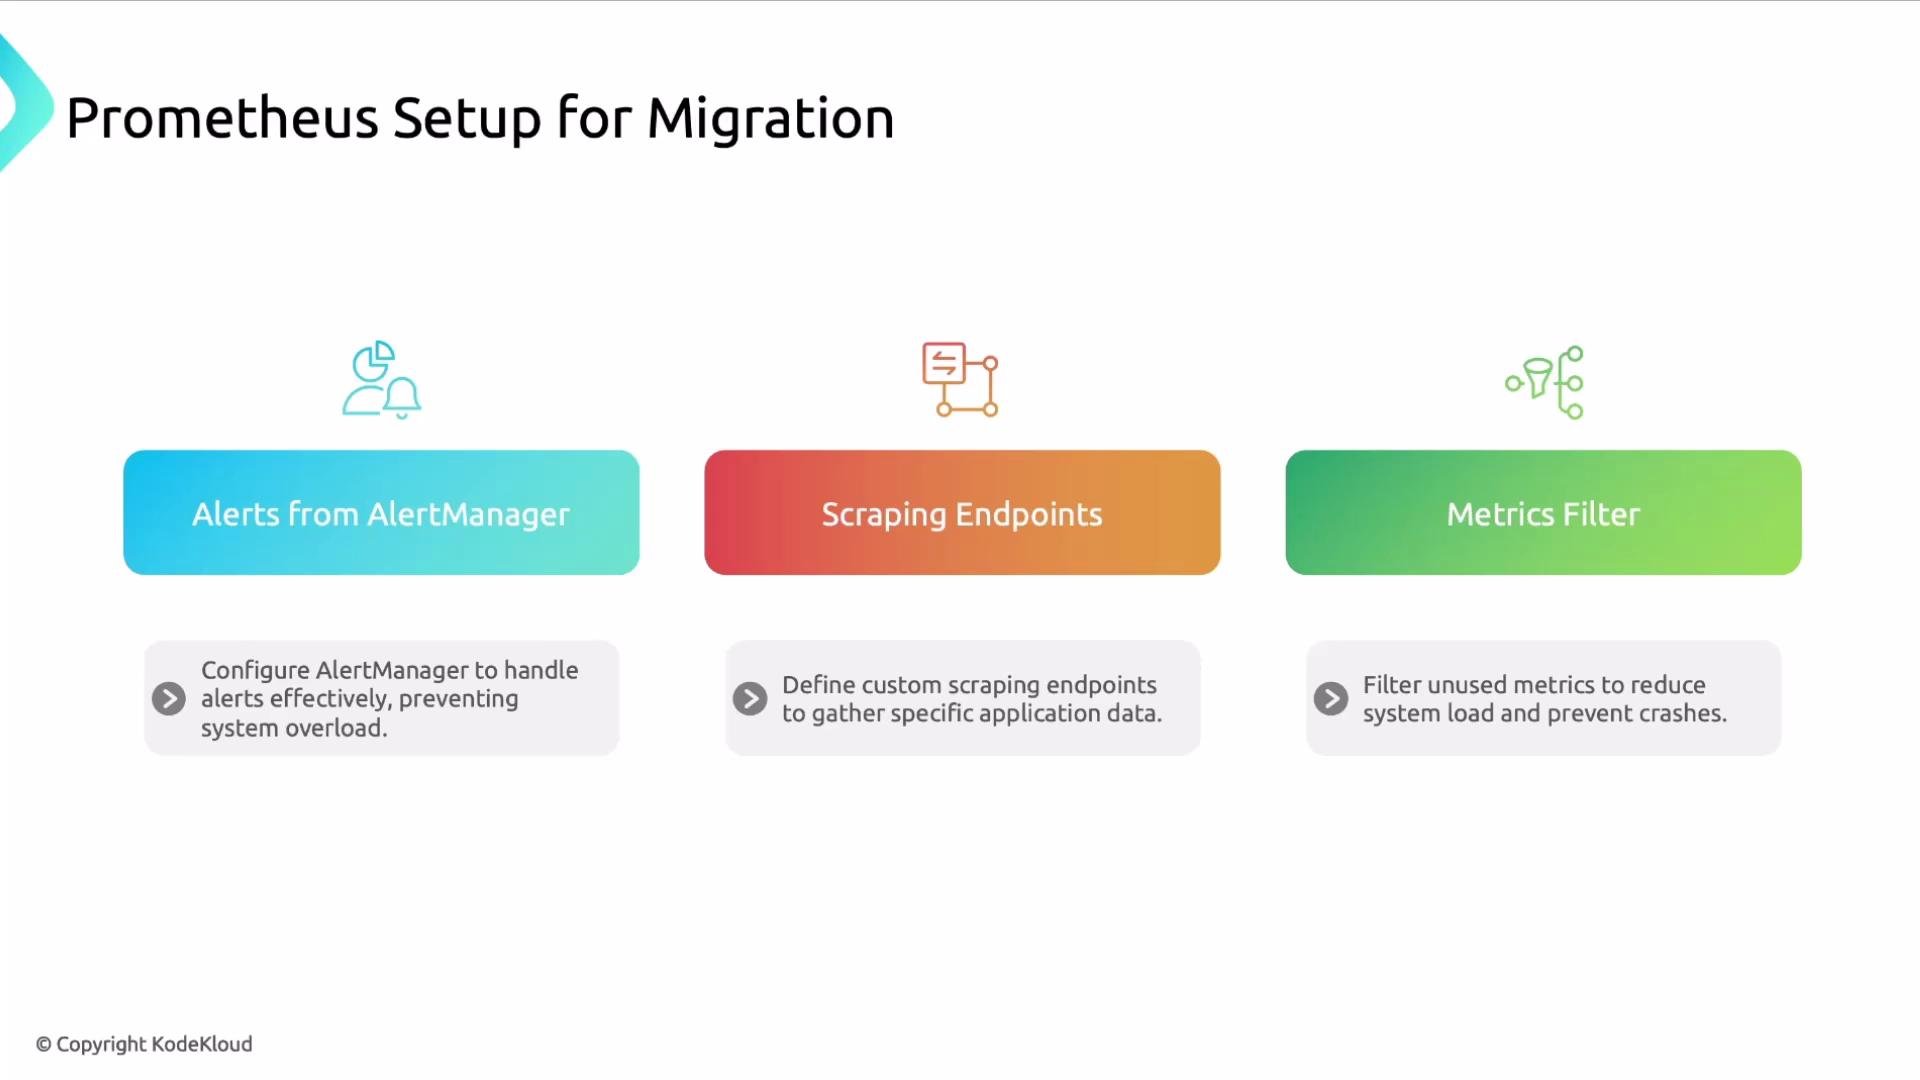
Start with a focused audit of Prometheus to capture everything you’ll need to reproduce monitoring and alerting behavior in Datadog.- Alerts from Alertmanager
- Check alert rule expressions and thresholds. Make sure you understand which alerts are critical and why.
- Inspect Alertmanager configuration (routes, receivers, and silences) so you can replicate notification logic in Datadog.
- Scraping endpoints
- Identify all scrape targets and the
metrics_pathused by each job. Some applications expose metrics on custom endpoints that are not the default/metrics. - Note any service discovery or static configurations used by
scrape_configs.
- Identify all scrape targets and the
- Metrics filter
- See whether Prometheus uses
metric_relabel_configsorrelabel_configsto drop or rename metrics. This prevents ingesting noisy or high-cardinality metrics that are not needed. - Document any metric transformations so you can apply similar filtering in Datadog or during ingestion.
- See whether Prometheus uses
Do not decommission Prometheus until you have validated parity in Datadog: test dashboards, alerting behavior, and run a parallel ingestion period to compare metrics and alerts.
Datadog planning concerns
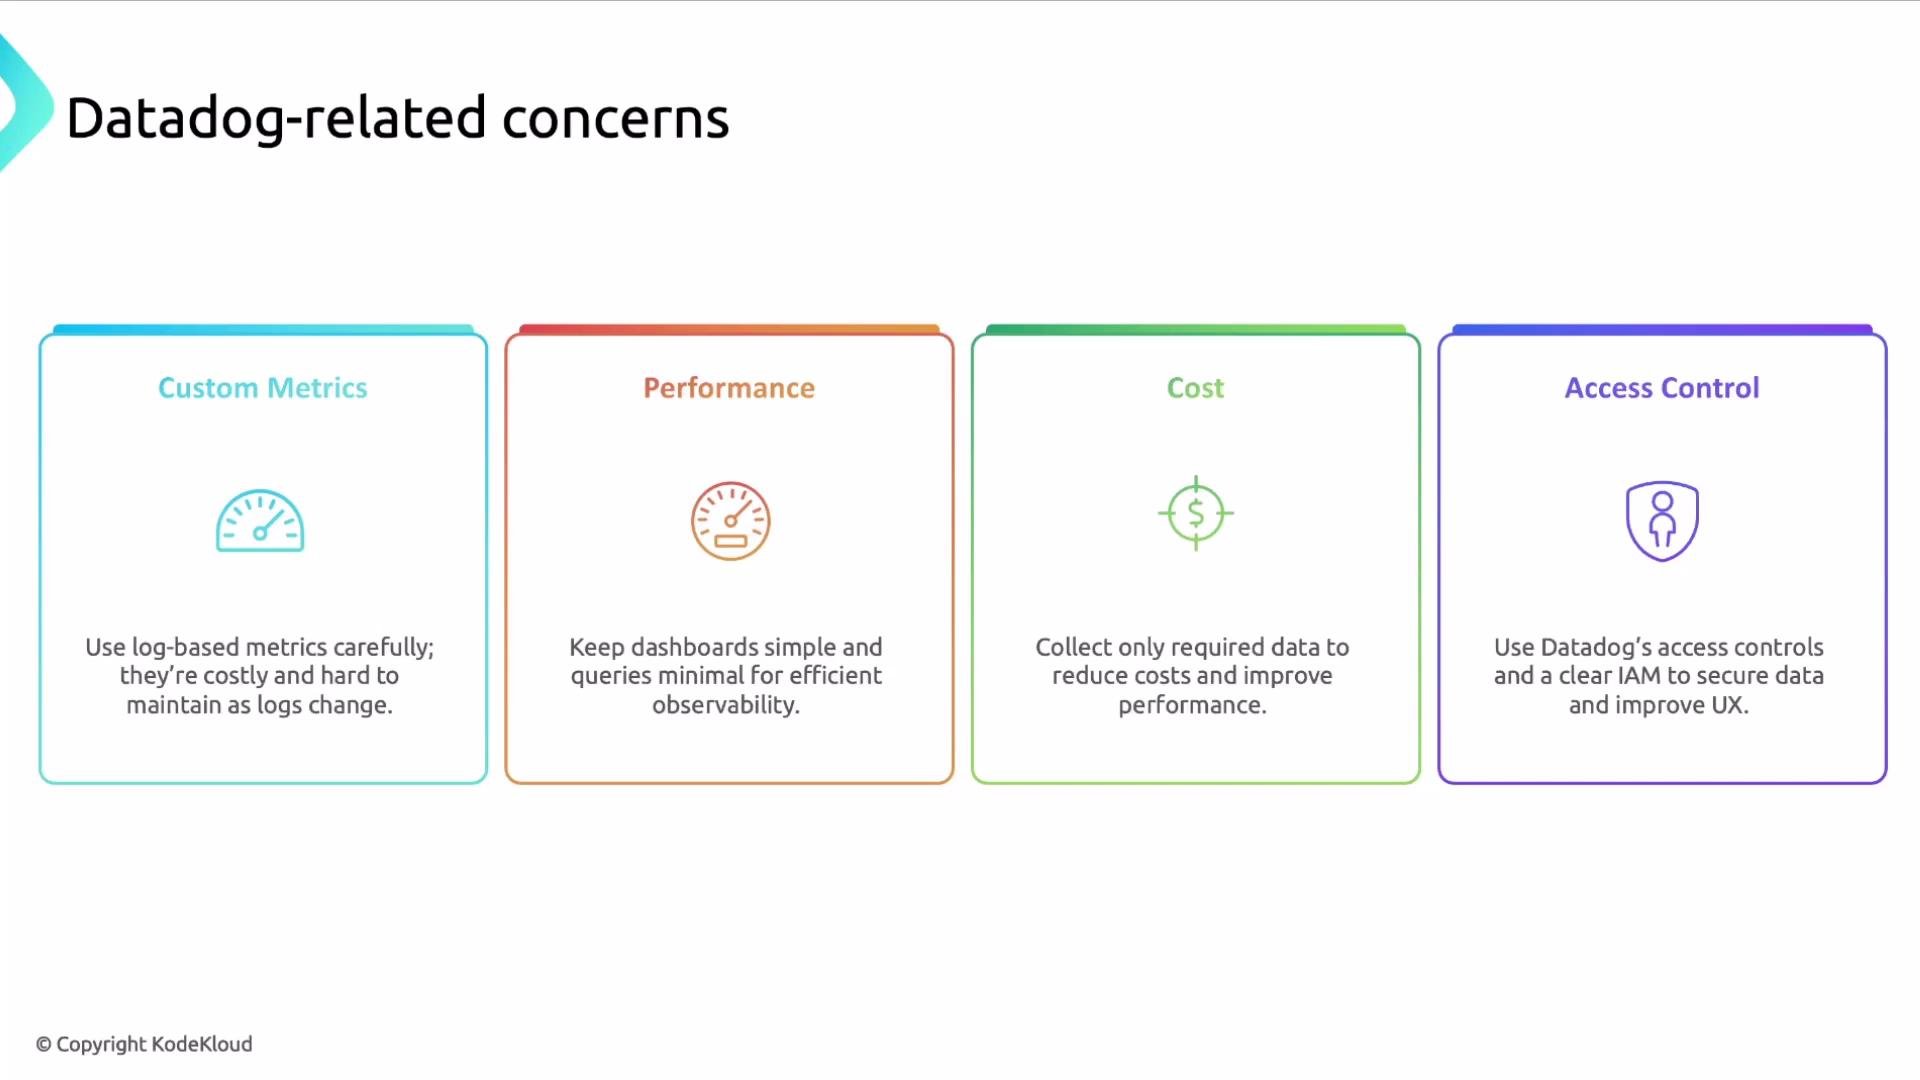
When mapping Prometheus concepts into Datadog, plan for ingestion method, cost, and operational practices. The following table summarizes common Datadog-focused items and practical actions to take.- Custom metrics
- Inventory all custom metrics currently sent to Prometheus. For each metric, capture its name, labels/tags, cardinality, and purpose. This helps decide how to re-ingest them into Datadog (custom metrics,
DogStatsD, or direct SDKs).
- Inventory all custom metrics currently sent to Prometheus. For each metric, capture its name, labels/tags, cardinality, and purpose. This helps decide how to re-ingest them into Datadog (custom metrics,
- Log-based metrics
- Use log-based metrics sparingly. They are convenient but can be expensive and fragile because log formats and fields change frequently. See Datadog’s log-based metrics documentation for details.
- Dashboards and queries
- Keep dashboards simple and queries efficient. Translate Prometheus queries into Datadog equivalents and avoid overly complex, high-cardinality queries that increase cost and reduce performance.
- Cost control
- Limit collection to required data only. Reduce metric cardinality, tune retention, and avoid unnecessary high-volume ingest to control costs.
- Access control
- Implement Role-Based Access Control (RBAC). Use Datadog API keys and application keys appropriately, and structure IAM so users have the access they need without excessive privileges. Refer to Datadog’s API and application keys docs for best practices:
https://docs.datadoghq.com/account_management/api-app-keys/
- Implement Role-Based Access Control (RBAC). Use Datadog API keys and application keys appropriately, and structure IAM so users have the access they need without excessive privileges. Refer to Datadog’s API and application keys docs for best practices:
Recommended migration workflow (high level)
- Audit Prometheus (alerts, scrape targets, relabeling, custom metrics).
- Map metrics and alerts to Datadog equivalents; document transformations and tag mappings.
- Set up Datadog ingestion and replicate a subset of alerts and dashboards.
- Run both systems in parallel and compare results for a validation period.
- Adjust metric filters, dashboards, and alert thresholds in Datadog as needed.
- Decommission Prometheus only after validation and stakeholder sign-off.
Links and references
- Prometheus: https://prometheus.io/
- Alertmanager: https://prometheus.io/docs/alerting/latest/alertmanager/
- Spring Boot Actuator: https://docs.spring.io/spring-boot/docs/current/reference/html/actuator.html
- Datadog docs: https://docs.datadoghq.com/
- Datadog DogStatsD: https://docs.datadoghq.com/developers/dogstatsd/
- Datadog API & application keys: https://docs.datadoghq.com/account_management/api-app-keys/