

Delivery models: SaaS vs Self-hosted
When evaluating observability platforms you’ll encounter two common delivery models:
Choose based on technical, compliance, and operational requirements: latency, data residency, control of infrastructure, and security posture are common decision drivers.
Core components and responsibilities
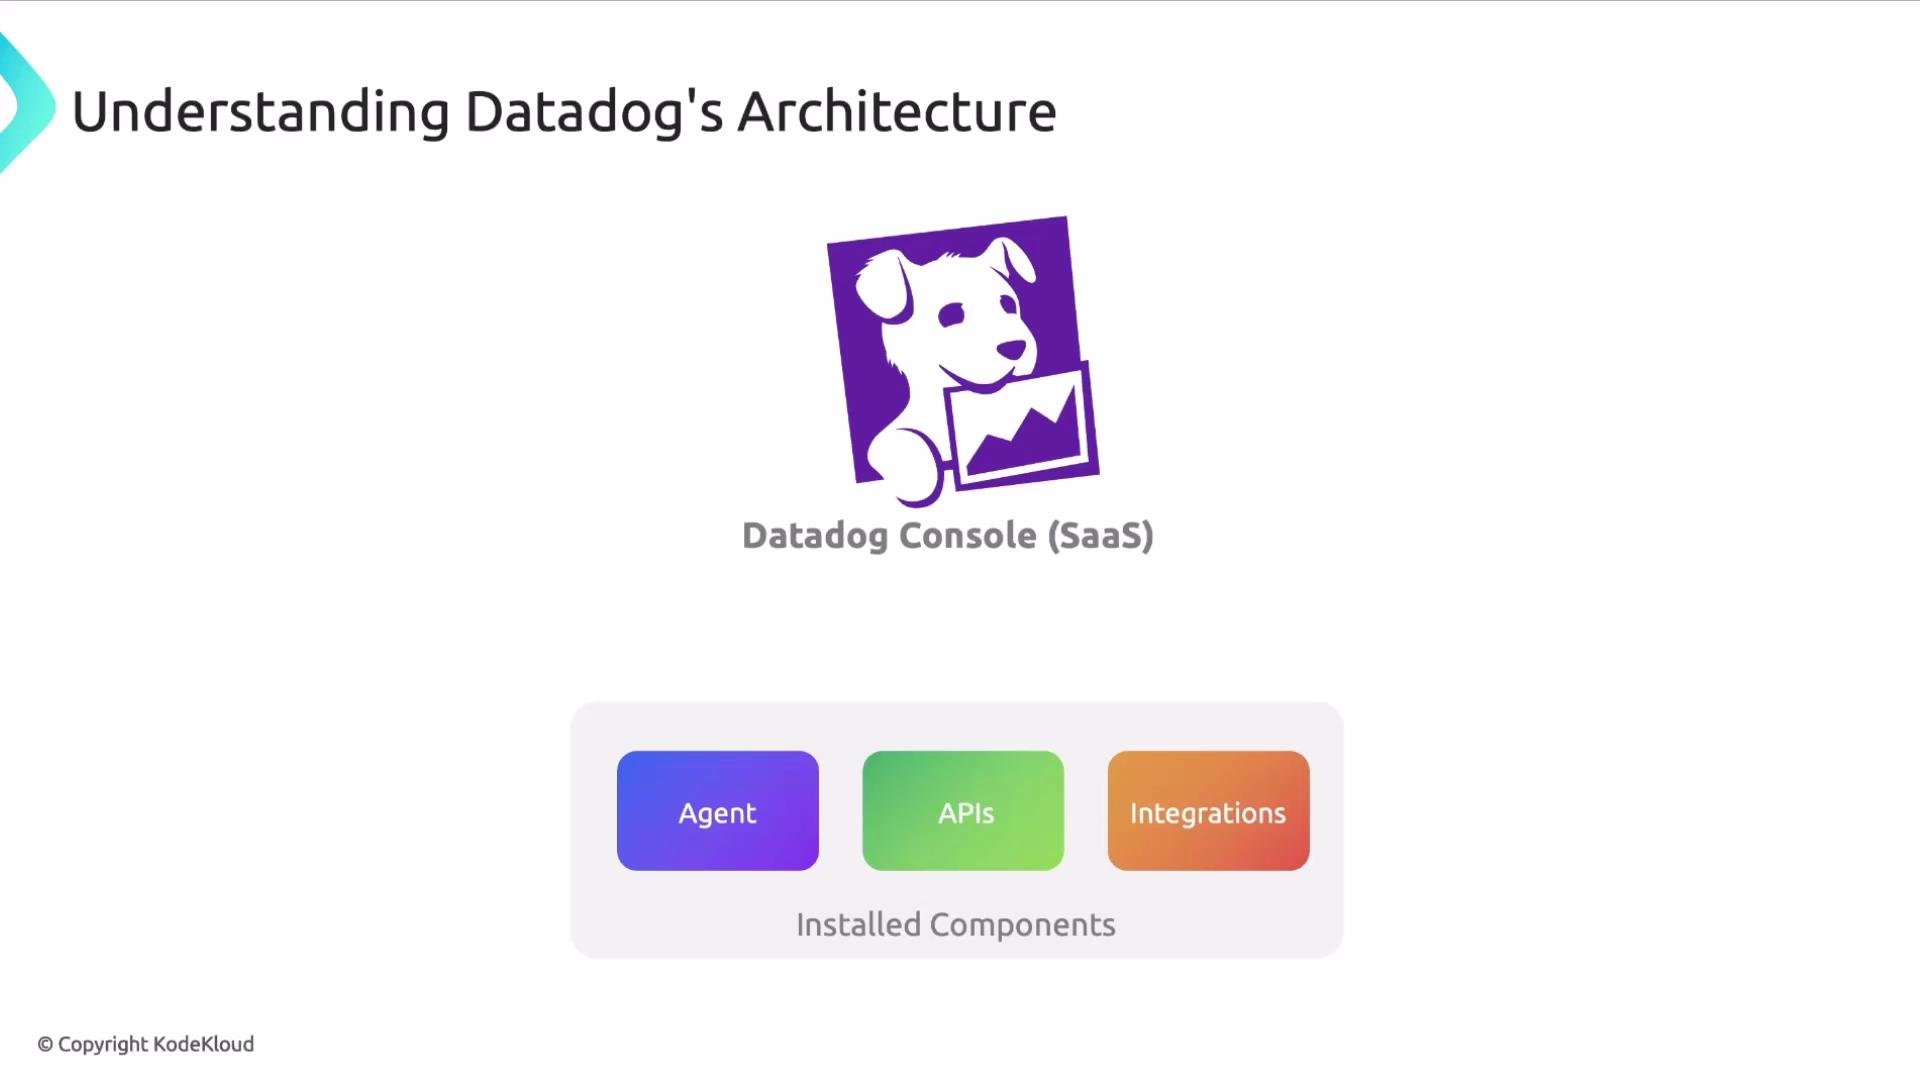
- Datadog Console (SaaS): Central UI, dashboards, alerting, and control plane.
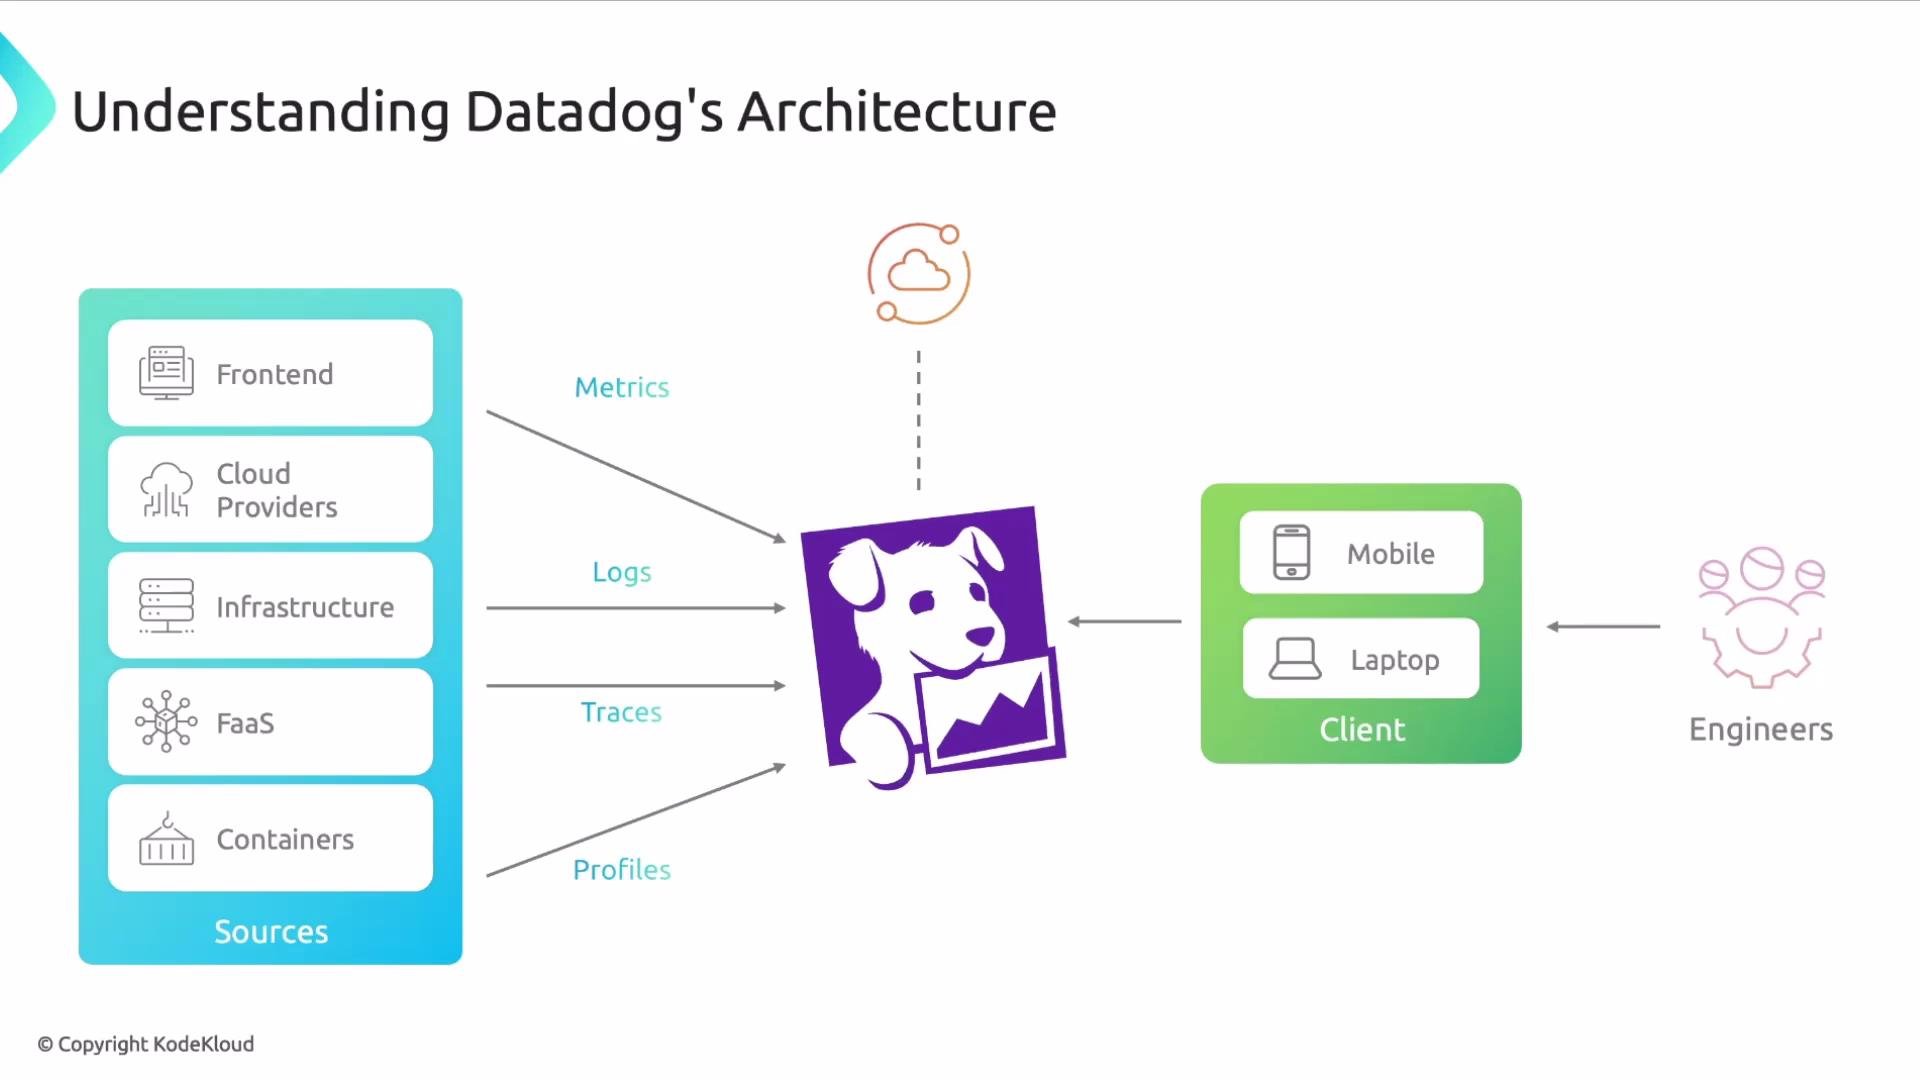
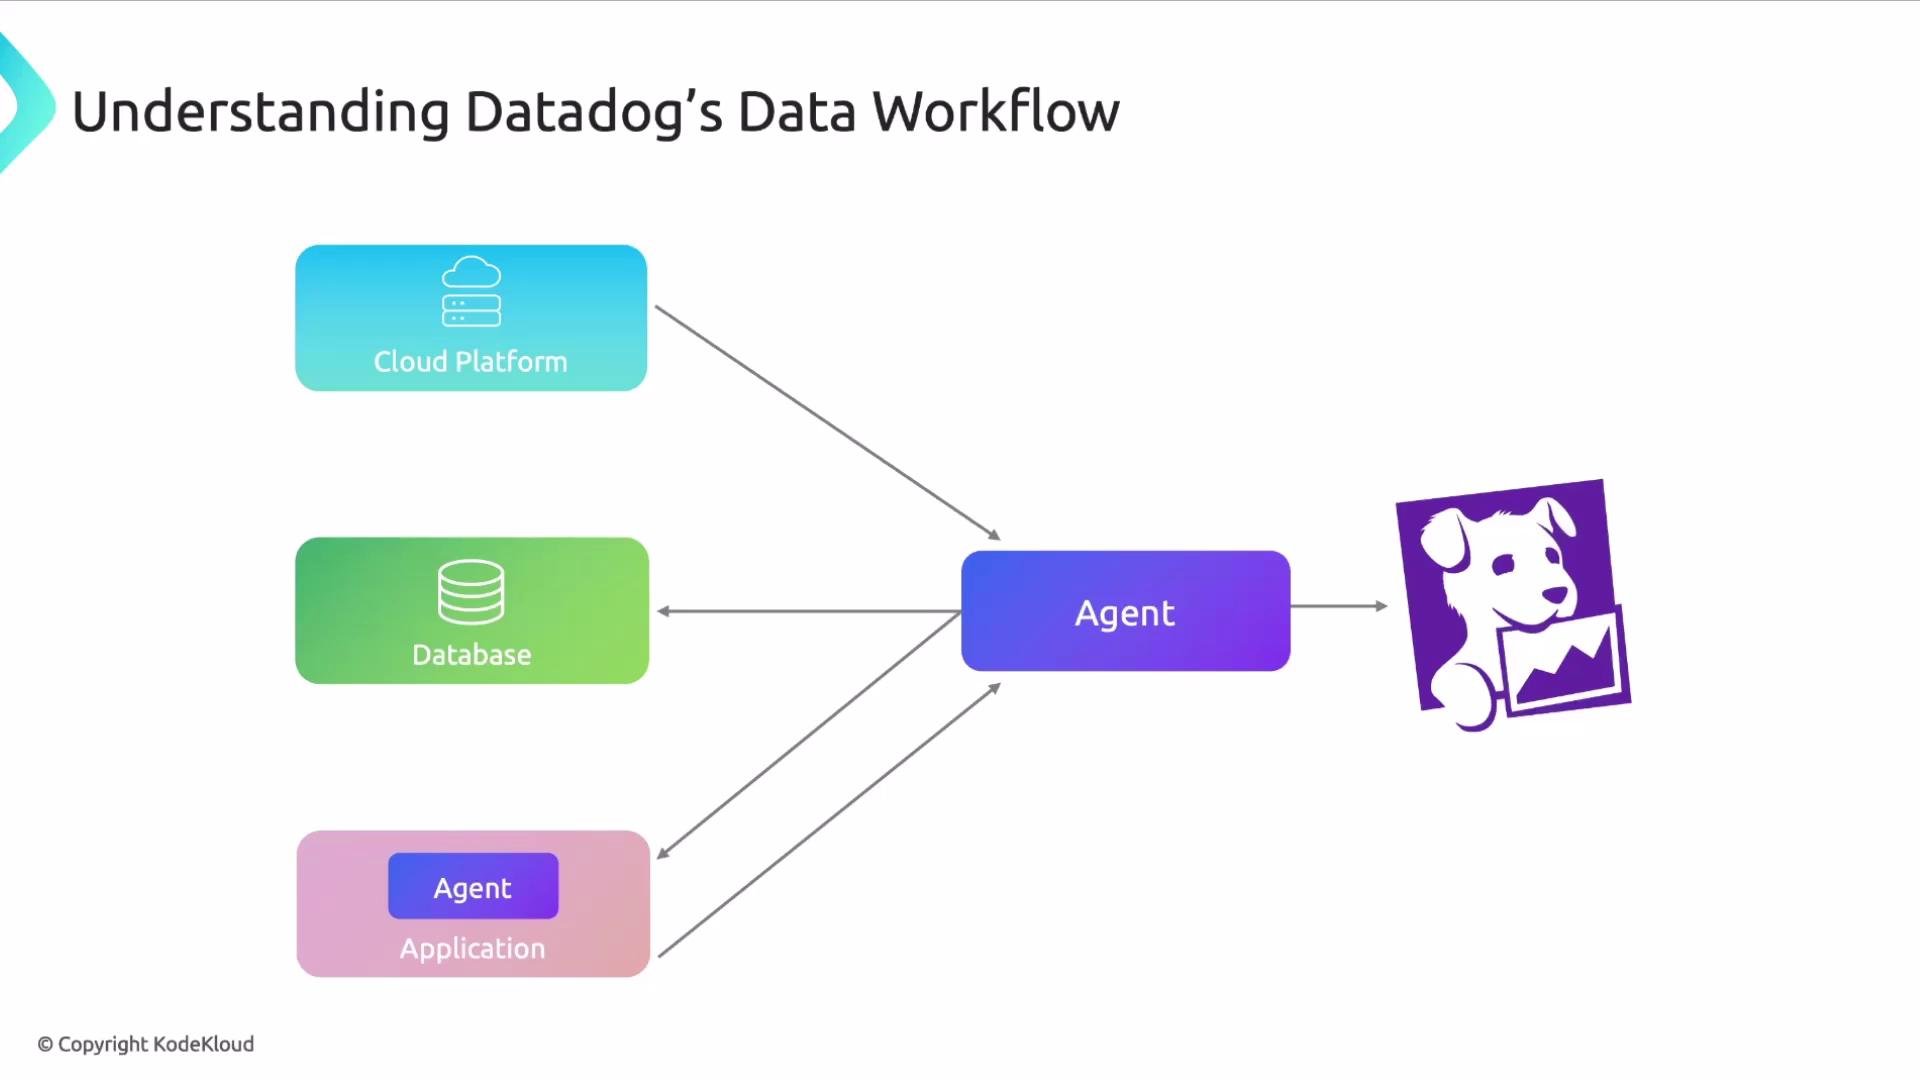
- Agents: Lightweight collectors that gather metrics, logs, traces, and continuous profiles from hosts, containers, and serverless runtimes.
- Integrations & APIs: Cloud, database, and third-party system connectors; public APIs for custom ingestion, checks, and automation.
- Clients: Engineers and responders use browsers and mobile apps to view dashboards, receive alerts, and manage incidents.
Datadog supports telemetry from containerized applications, serverless functions (AWS Lambda, Azure Functions), cloud platforms, on‑prem infrastructure, and frontend applications. Each source typically has a tailored collection method or a dedicated integration.
Platform capabilities and observability features
Datadog ingests and correlates multiple telemetry types to provide holistic observability:- Metrics, logs, traces, and continuous profiling (correlated across dimensions).
- UX monitoring: Real User Monitoring (RUM) for frontend performance and behavior.
- CI/CD monitoring: pipeline and workflow observability.
- LLM observability: monitoring of large language model usage and behavior.
- Security tooling: SIEM, SOAR, code analysis, runtime security.
- Cost monitoring: cloud cost insights and allocation.
- Dashboards, alerting, incidents, metrics analytics, and notebooks.
How data reaches Datadog
Data collection typically begins with Agents and platform integrations:- Agents: Installed where telemetry originates (hosts, containers, or as binaries). For Kubernetes, deploy an Agent inside the cluster to collect node, pod, and service telemetry.
- Serverless and cloud-native integrations: Some integrations collect telemetry without a persistent agent by using platform APIs or function-level instrumentation (e.g., Datadog’s Lambda Forwarder for AWS Lambda logs).
- Ingestion pipelines: Datadog supports pre-ingestion processing, enrichment, and parsing rules so telemetry is normalized before storage and analysis.
Enterprise network considerations
Access and authentication:- Datadog is accessed over the public internet with standard browsers and the mobile app.
- Integrate with your Identity Provider (IdP) for SSO and centralized access control to enforce corporate policies.
- Many organizations require outbound traffic to be routed through proxies or firewalls. Configure Datadog Agents and integrations to work through your proxy.
- Verify required allowlists (hostnames, IPs) and TLS interception rules so agents can reach Datadog endpoints.
Sites, regions, and data residency
Datadog operates multiple sites/regions. Your site selection affects latency and compliance (data residency). Important points:- Site selection is persistent for an organization; data cannot be moved later.
- Evaluate regulatory and business requirements (e.g., GDPR, data residency) before choosing a site.
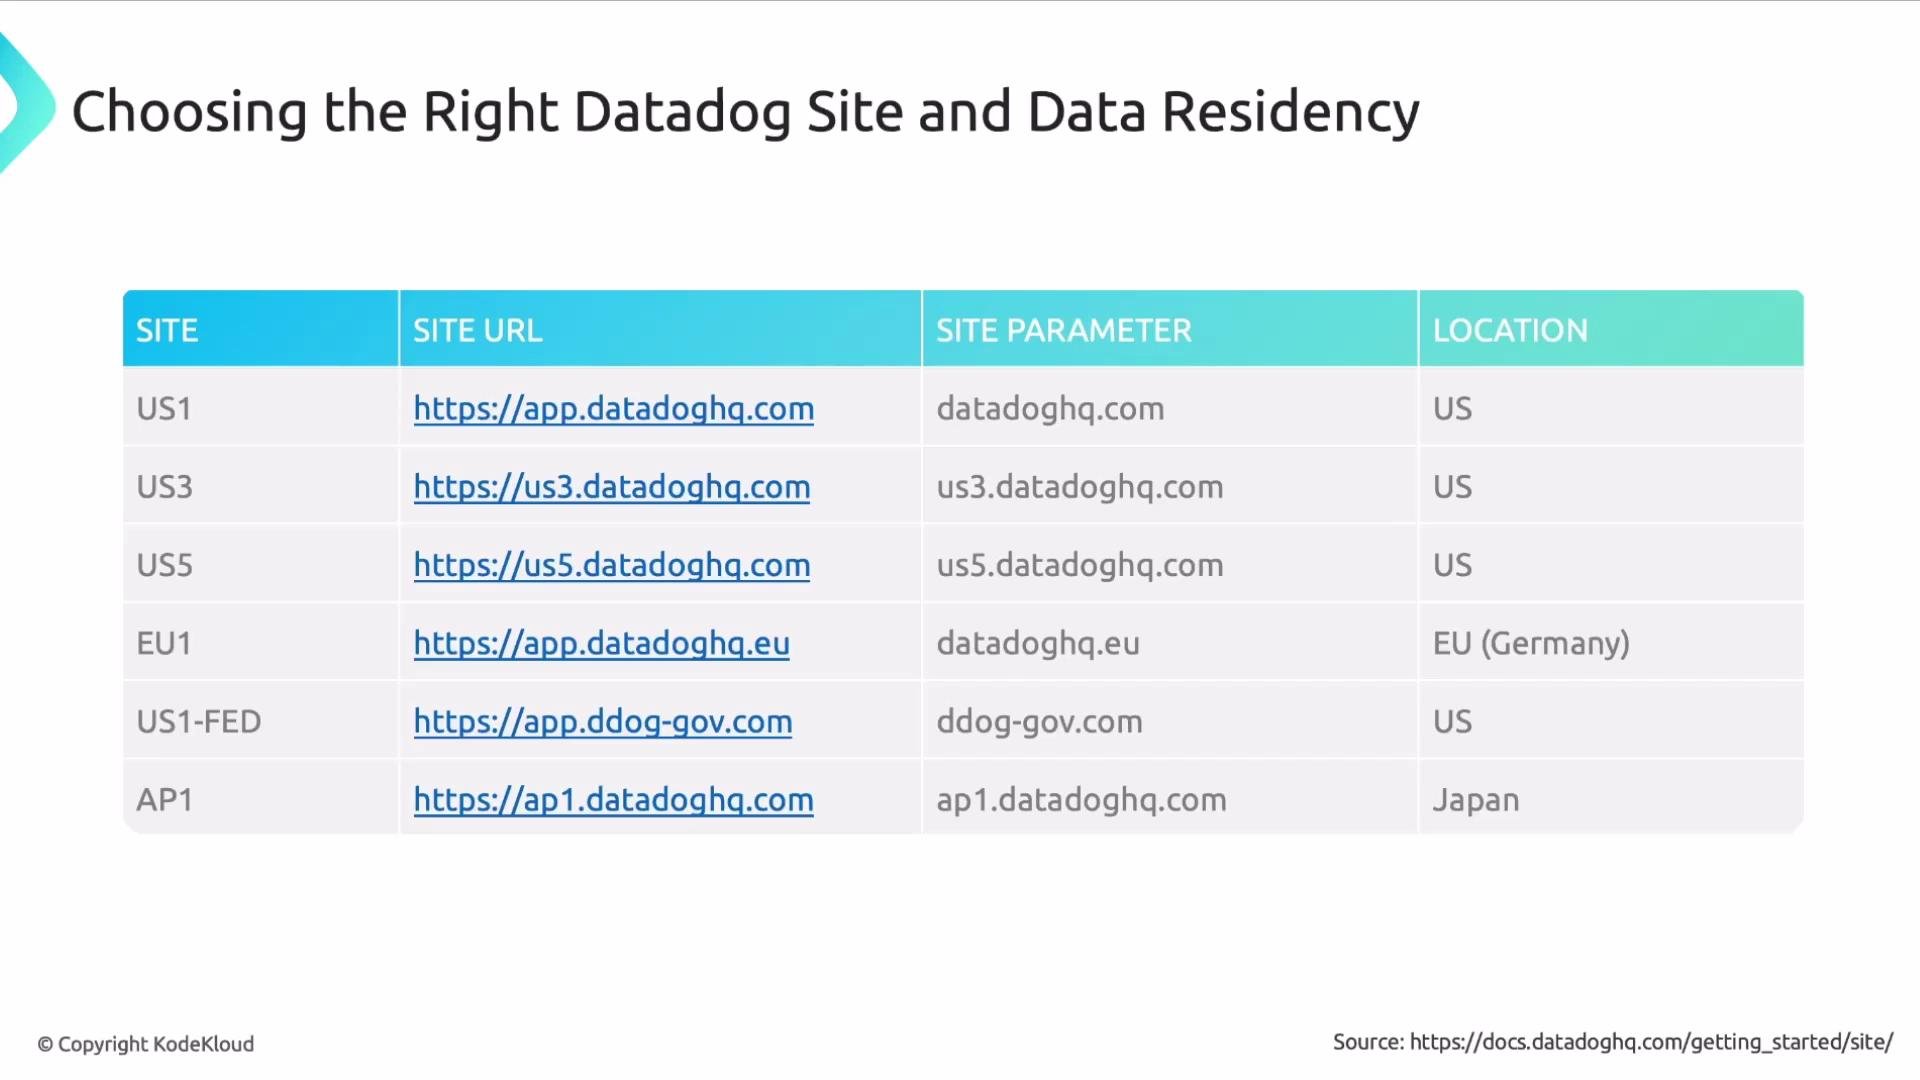
Carefully evaluate data residency and compliance requirements before choosing your Datadog site. The selection is persistent for your organization and cannot be changed later.
Summary
Datadog is a SaaS console backed by a distributed collection layer (Agents and Integrations) and public APIs. Understanding where and how telemetry is collected, the difference between agent-based and platform-native integrations, and the implications of networking and site selection will help you design an observability deployment that meets performance, security, and compliance goals. Further reading and references:- Datadog documentation: https://docs.datadoghq.com/
- Kubernetes Basics: https://kubernetes.io/docs/concepts/overview/what-is-kubernetes/
- Datadog AWS Lambda integration: https://docs.datadoghq.com/integrations/amazon_lambda/