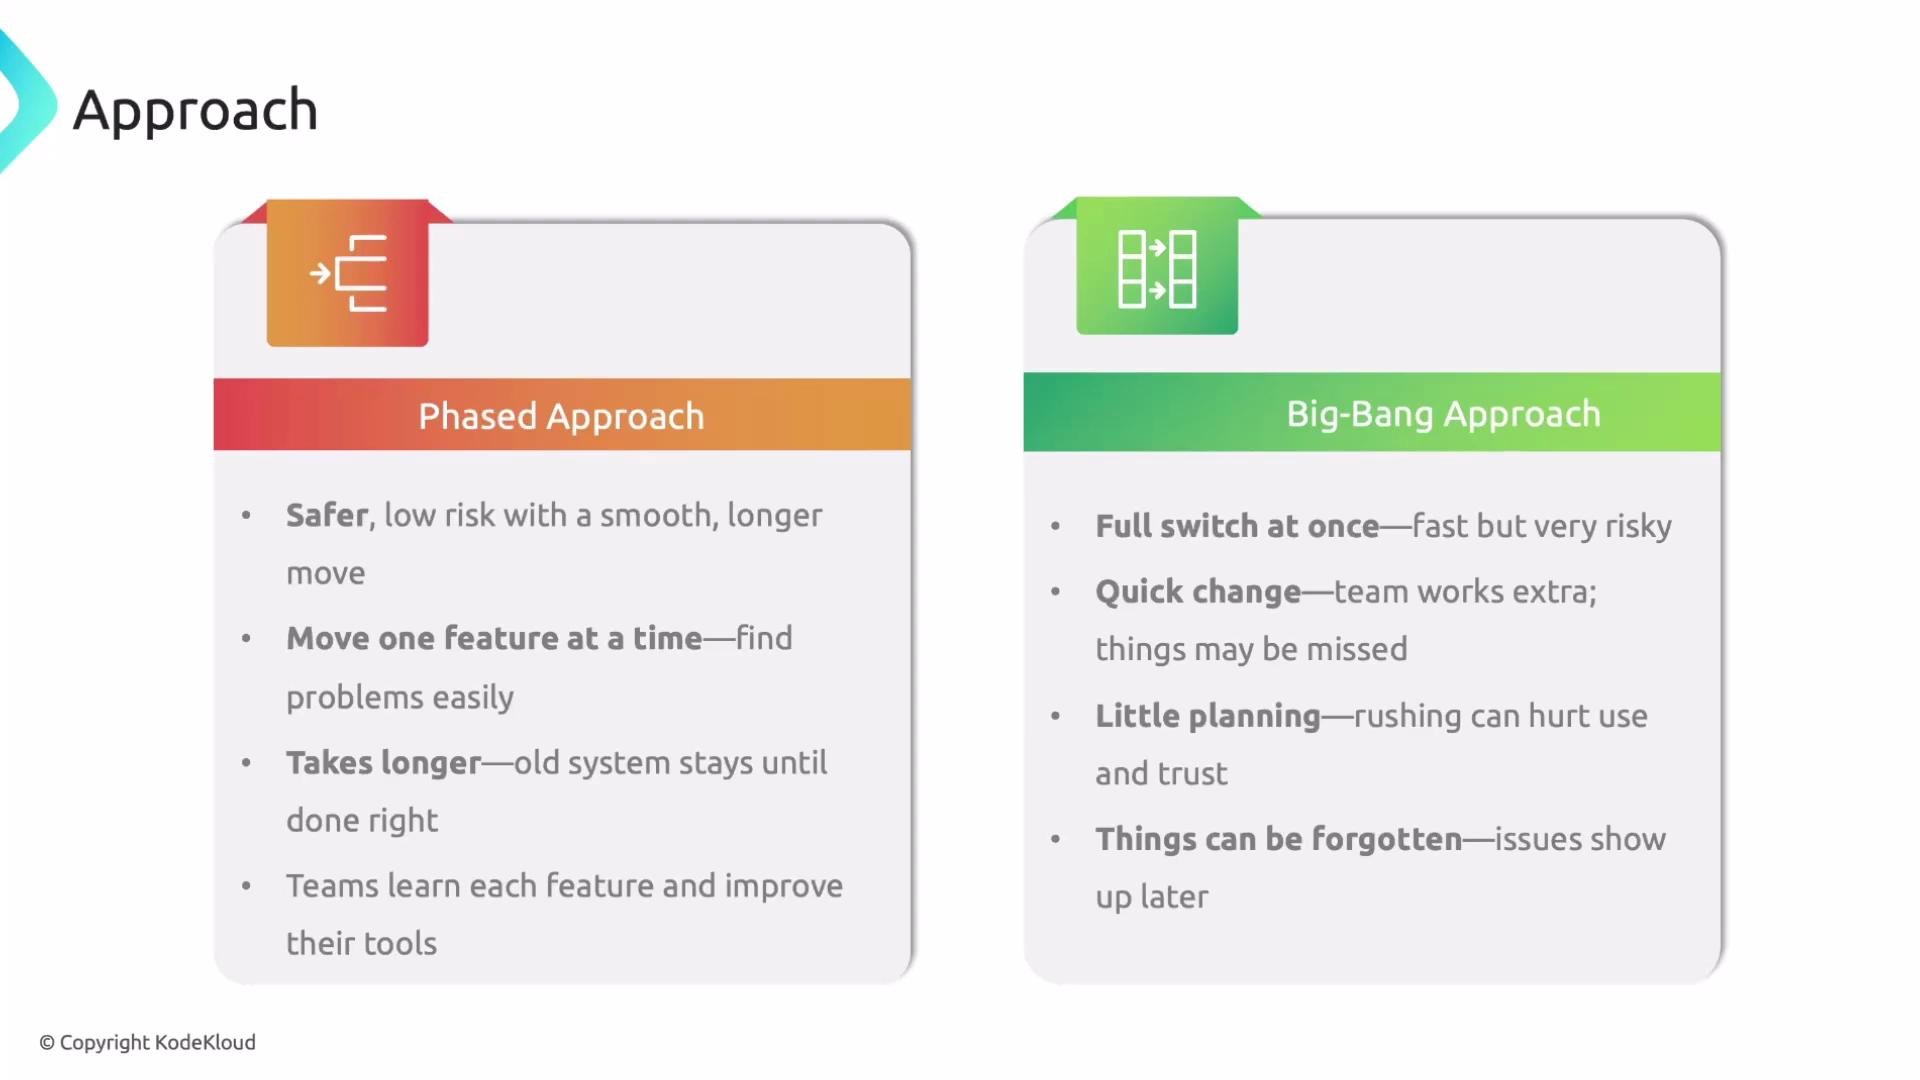
For most organizations, a phased migration is the recommended pattern. It enables feedback-driven improvements, reduces risk, and produces repeatable artifacts (charts, config, documentation) that accelerate subsequent teams.
Initial access and prerequisites
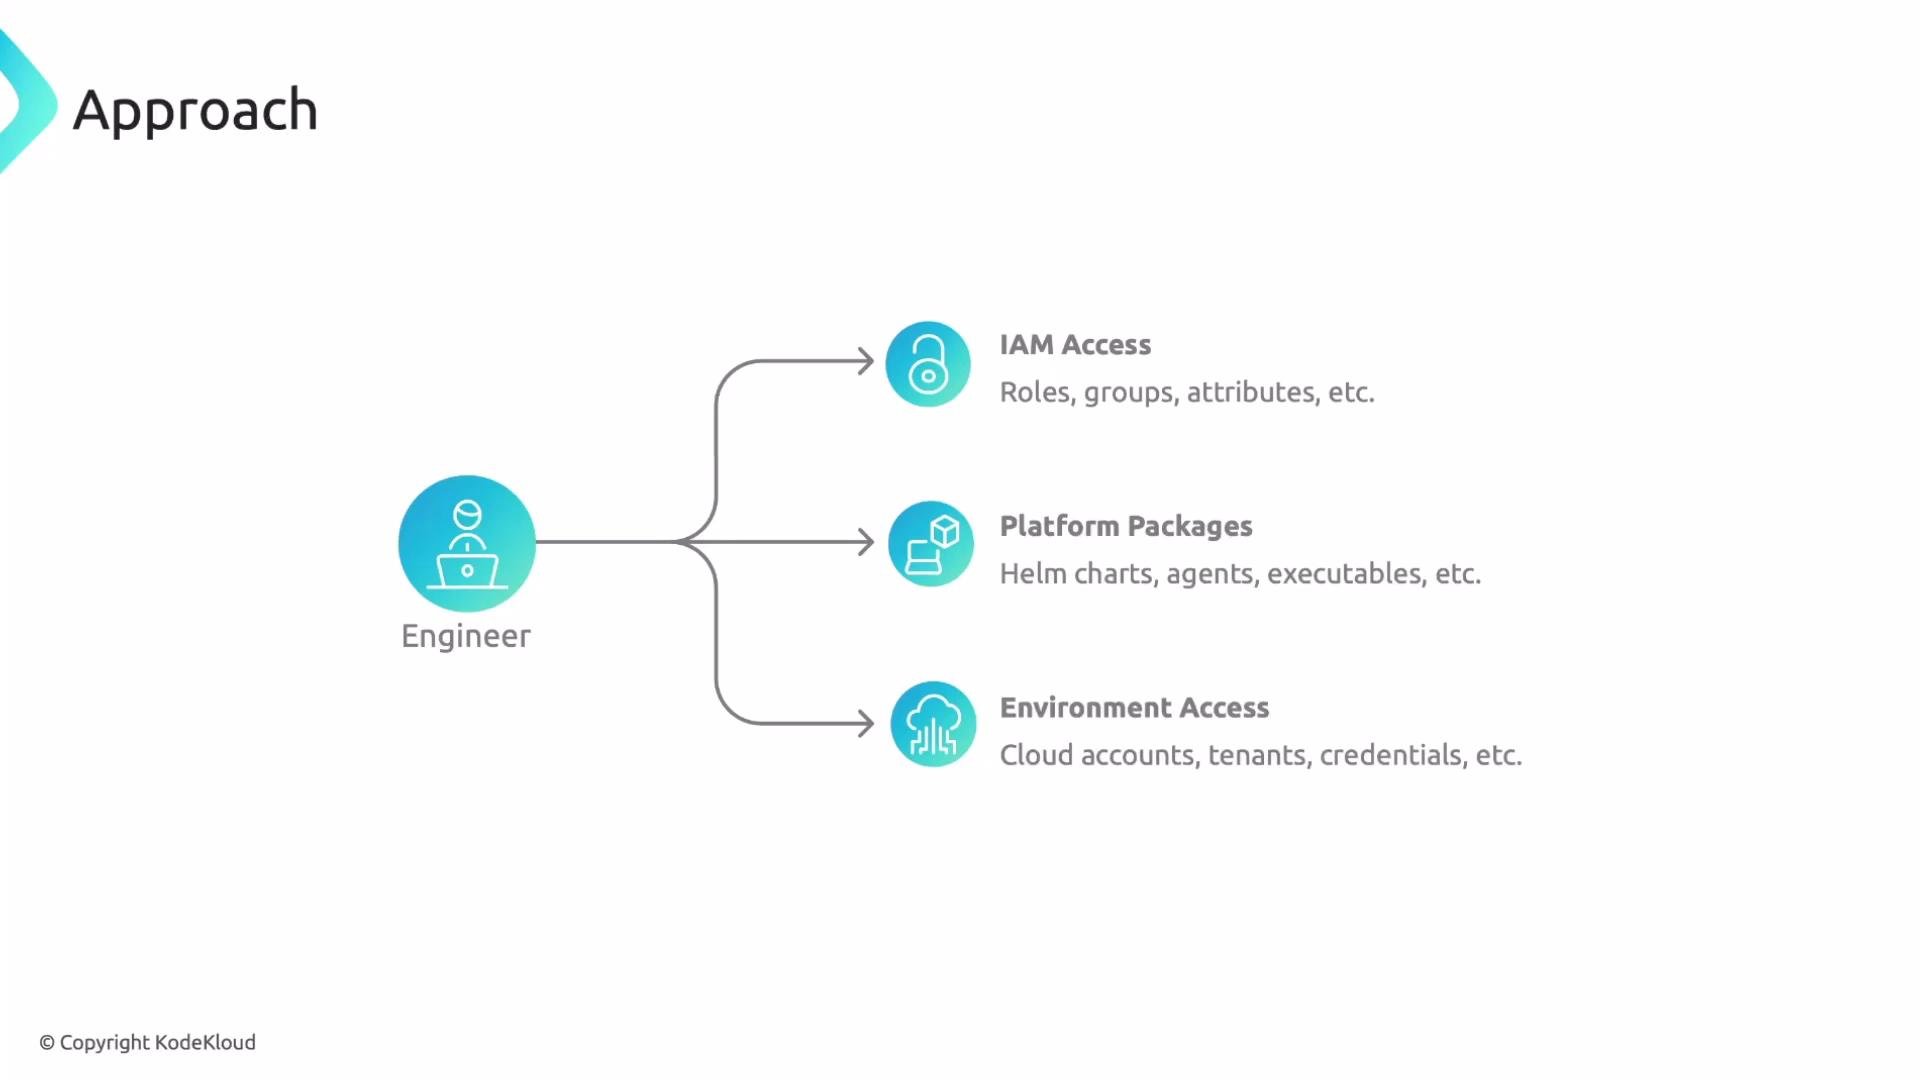
Before installing agents or flipping integrations, gather access and artifacts so engineering teams aren’t blocked.- Obtain platform and identity access
- Identity and access management (IAM) and identity governance systems (for example, Microsoft Entra ID (Azure AD) or AWS IAM). IGA vendors may include tools such as SailPoint.
- Create or request service accounts, roles, and permissions required to install agents and configure platform integrations.
- Collect installer artifacts and libraries
- Helm charts or Kubernetes manifests for cluster deployments.
- Agent packages for VMs, containers, or serverless runtimes.
- Language-specific instrumentation libraries and SDKs for application code.
- Prepare environment-specific credentials
- Cloud account access, API keys, and any secrets needed to onboard telemetry (metrics, traces, logs, and profiling).
Request IAM roles and service account permissions early. Missing privileges are a common cause of migration delays—apply least privilege principles and document required scopes for onboarding.
Setting up the environment
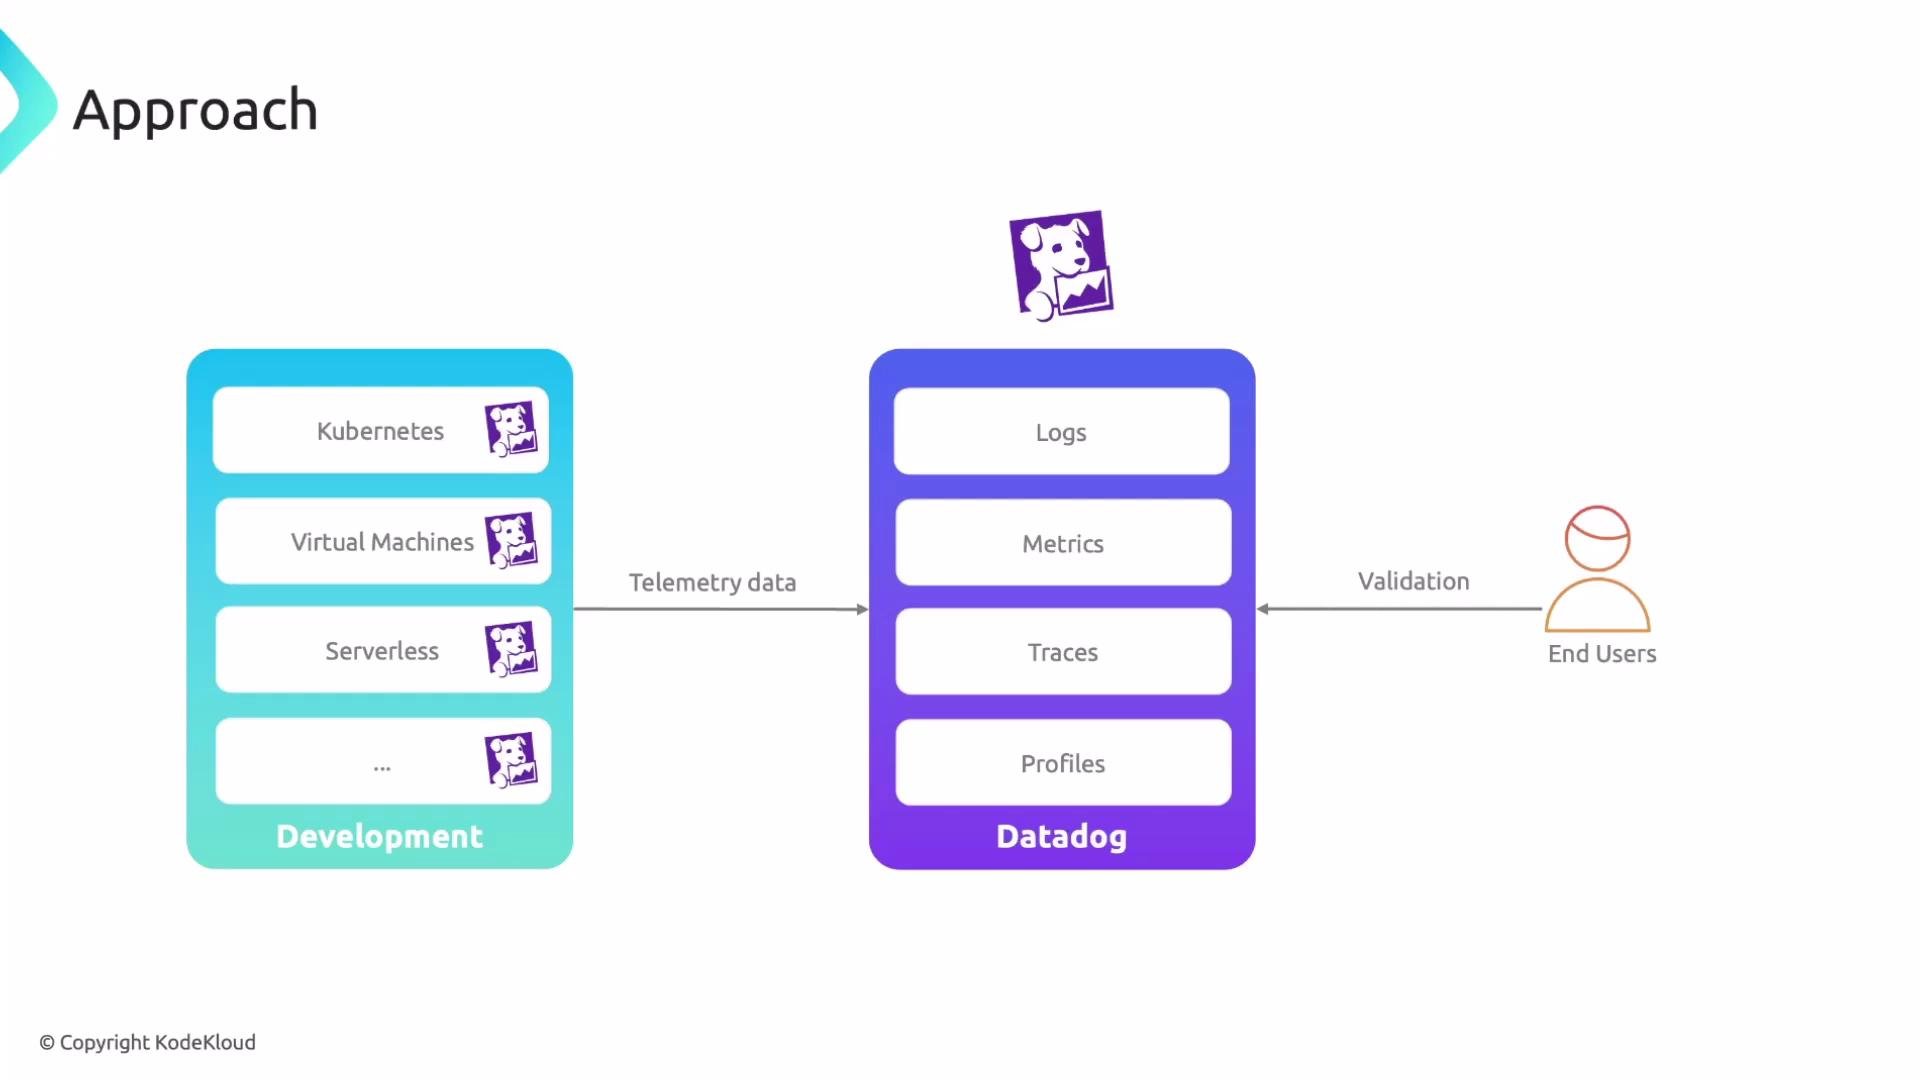
Start in a development environment and iterate until telemetry is correct. For Datadog, typical tasks include:- Deploy the Datadog Agent:
- Kubernetes: install via Helm chart or DaemonSet.
- Containers: run the agent as a sidecar or daemon container.
- VMs: install with package installers (apt, yum) or agent images.
- Enable and configure integrations:
- Metrics, logs, traces/APM, and continuous profiling.
- Configure Prometheus-style scrapes for services exposing
/metrics.
- Tune collection concerns:
- Log filters and processors to reduce noise and cost.
- Metric collection intervals and custom tags for better grouping.
- Trace sampling rules to control ingestion volume.
Validation and feedback loop
A structured validation loop ensures issues are caught early and fixes are distributed as shared artifacts:- Allow time for telemetry to arrive and stabilize in the platform (metrics graphs, log indices, traces).
- Run user acceptance tests and have engineers validate dashboards, alerts, and traces.
- Capture and prioritize feedback (missing spans, unexpected metrics, noisy logs).
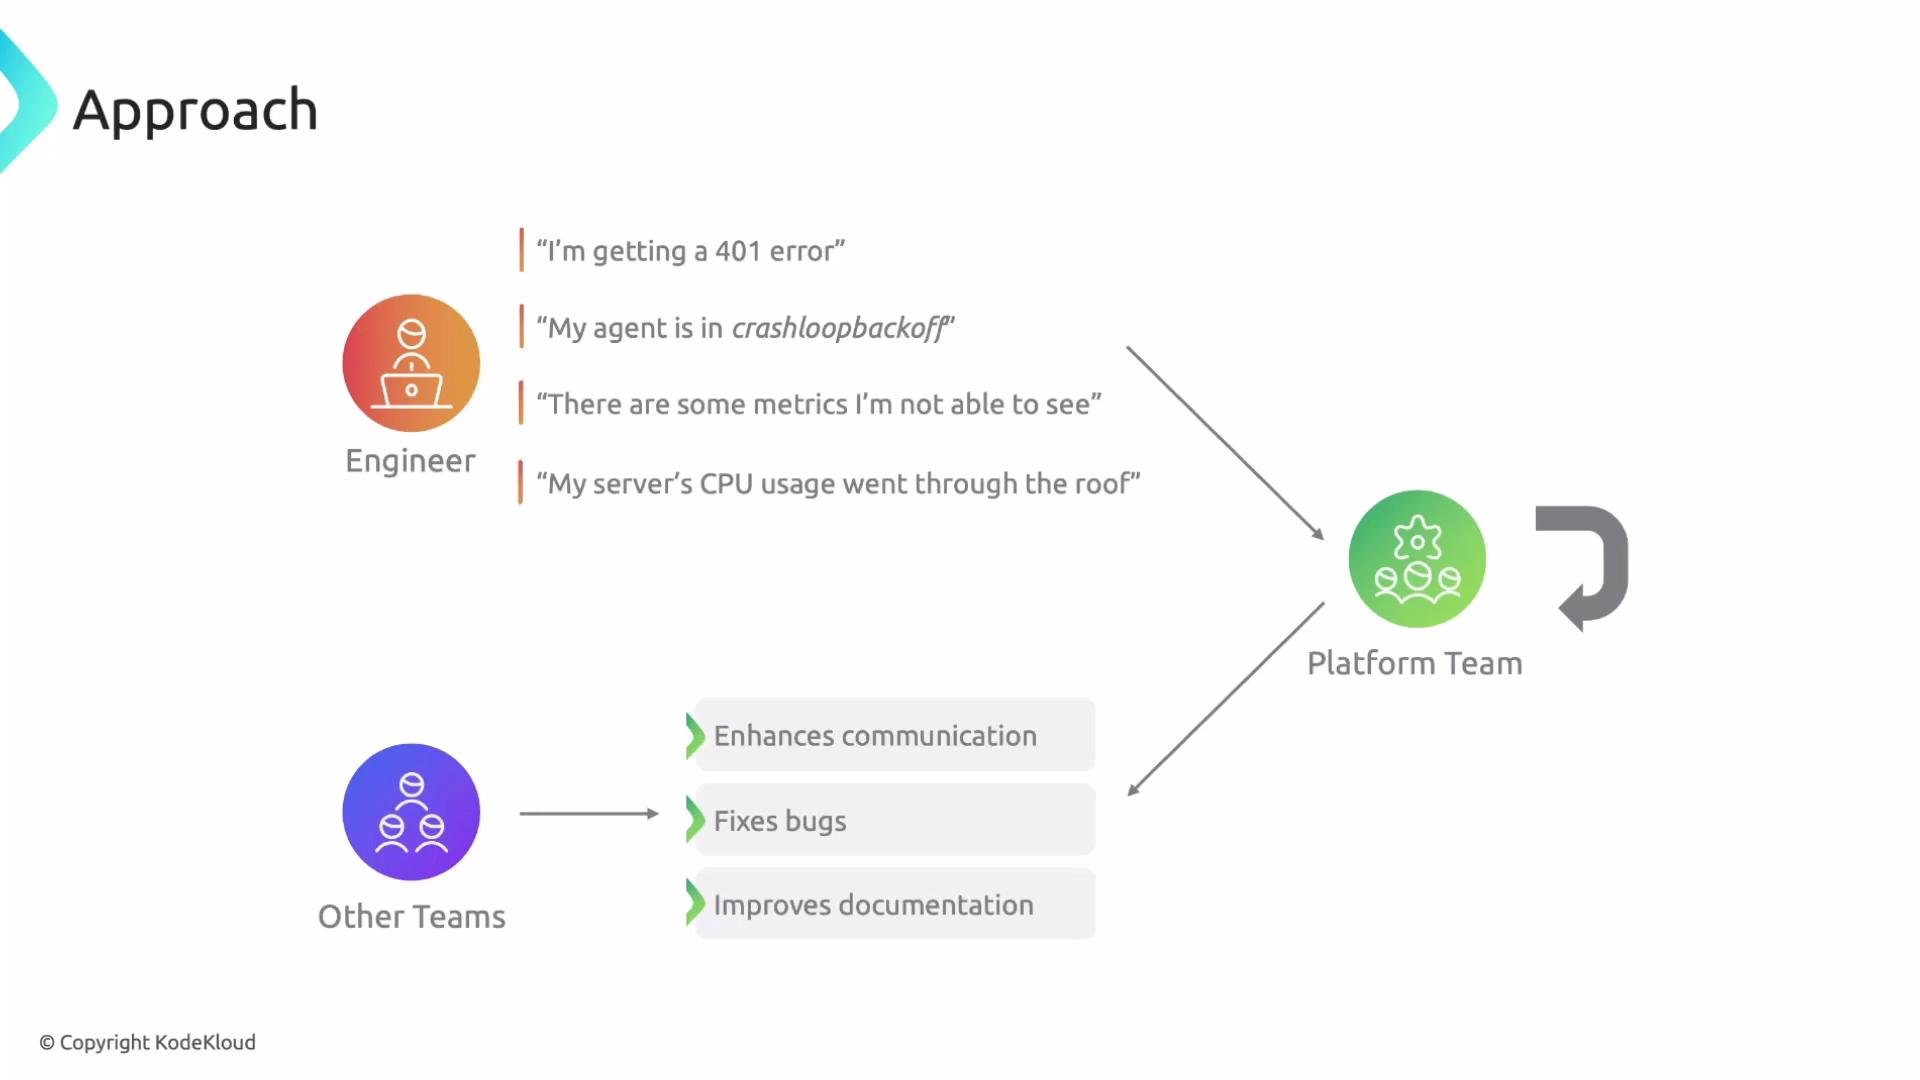
- Engineers report issues (e.g., missing spans, incorrect metrics, noisy logs).
- Platform team investigates, implements configuration fixes, adds filters, and updates documentation.
- Platform team publishes the fixes and reusable templates (Helm values, config snippets, alert rules) for downstream teams.