Effective monitoring and troubleshooting of your Nginx server ensures high availability, performance, and quick resolution of issues. In this guide, we’ll cover:
Collecting and interpreting access and error logs
Exposing and querying basic metrics with the stub_status module
Integrating with external monitoring platforms
Safely testing and reloading configurations
Checking service health and firewall settings
HTTP Access Logs Nginx’s HTTP access logs record every client request. By default, logs are written in the combined format, but you can define a custom pattern in the http block.
http { log_format custom '$ remote_addr - $ remote_user [$ time_local ] "$ request " ' '$ status $ body_bytes_sent "$ http_referer " ' '"$ http_user_agent " "$ http_x_forwarded_for "' ; }
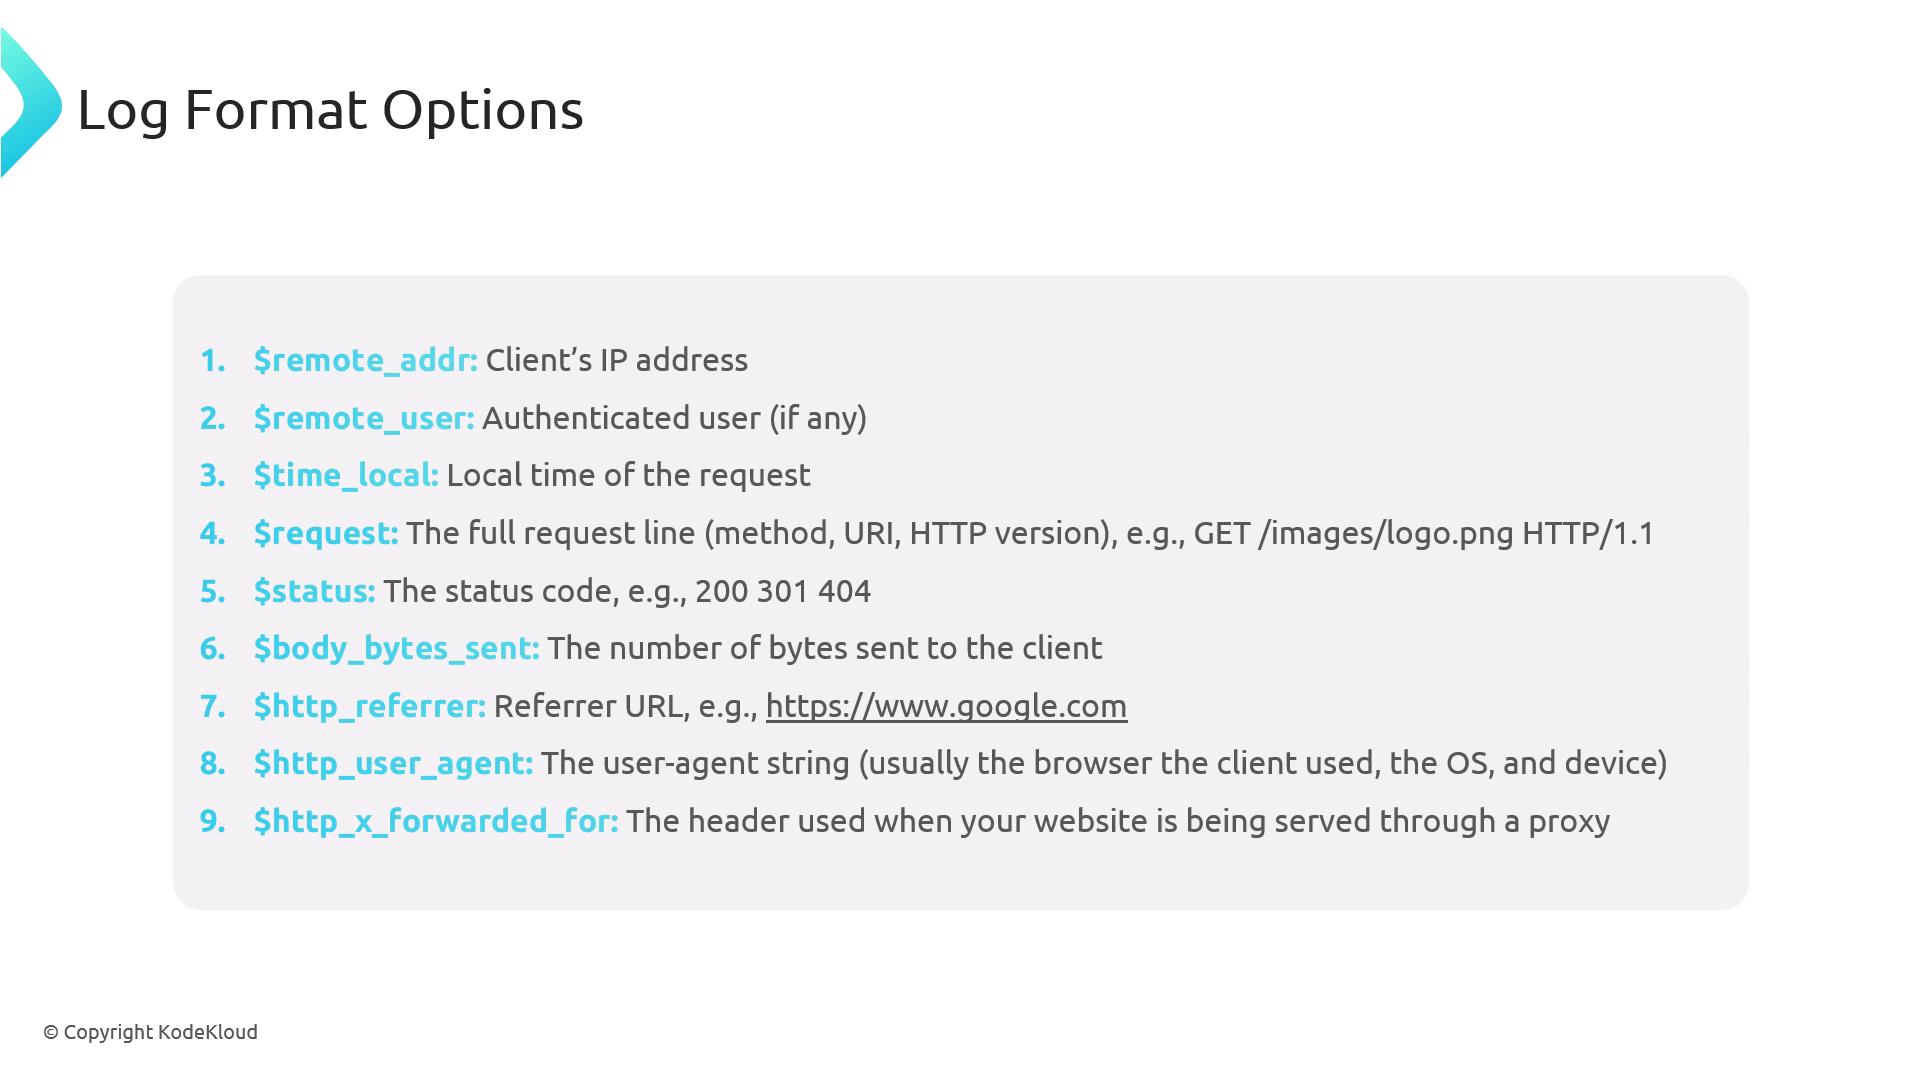
Defining a custom log format lets you include only the fields you need, simplifying downstream parsing and analytics.
Common Log Variables Variable Description $remote_addrClient IP address $remote_userAuthenticated username (or - if none) $time_localLocal timestamp $requestRequest line (METHOD URI HTTP/VERSION) $statusResponse status code (e.g., 200, 404) $body_bytes_sentBytes sent to the client $http_refererReferring URL $http_user_agentClient browser user agent $http_x_forwarded_forOriginal client IP when behind proxies
Enabling and Viewing Access Logs
Enable in your server block:
server { listen 80 ; server_name example.com www.example.com; root /var/www/example.com/html; index index.html; access_log /var/log/nginx/access.log custom; error_log /var/log/nginx/error.log; location / { try_files $ uri $ uri / =404 ; } }
Tail the log to observe incoming requests:
cd /var/log/nginx/
tail -F access.log
Example entry (using the custom format):
192.168.1.1 - - [26/Jan/2025:14:23:35 +0000] "GET /images/logo.png HTTP/1.1" 200 512 "-" "Mozilla/5.0…Chrome/91.0…Safari/537.36"
Mapping fields:
192.168.1.1 → $remote_addr- → $remote_user[26/Jan/2025:14:23:35 +0000] → $time_local“GET /images/logo.png HTTP/1.1” → $request200 → $status512 → $body_bytes_sent”-” → $http_referer“Mozilla/5.0…Safari/537.36” → $http_user_agent
Error Logs Error logs capture configuration syntax errors, runtime exceptions, and worker process messages. Enable them alongside access logs:
server { listen 80 ; server_name example.com www.example.com; root /var/www/example.com/html; index index.html; access_log /var/log/nginx/access.log custom; error_log /var/log/nginx/error.log warn ; location / { try_files $ uri $ uri / =404 ; } }
Monitor errors in real time:
cd /var/log/nginx/
tail -F error.log
Example log entries:
2025/01/29 23:44:57 [emerg] 71265#71265: invalid number of arguments in "root" directive in /etc/nginx/sites-enabled/default:24
2025/01/29 23:46:03 [emerg] 71439#71439: "server" directive is not allowed here in /etc/nginx/sites-enabled/default:39
Frequent [emerg] or [crit] entries usually point to misconfigurations that need immediate attention.
HTTP Stub Status Metrics The stub_status module provides a lightweight metrics endpoint for basic Nginx statistics.
server { listen 81 ; server_name localhost; location /nginx_status { stub_status ; access_log off ; allow 127.0.0.1 ; deny all ; } }
Port 81 isolates the status endpointaccess_log off reduces noiseallow/deny restricts access to localhost
Fetch metrics:
curl http://127.0.0.1:81/nginx_status
Sample output:
Active connections: 309
server accepts handled requests
16630948 16630948 31070465
Reading: 11 Writing: 218 Waiting: 38
Metric Meaning Active connections Currently open client connections accepts Total accepted connections handled Connections handled (usually = accepts) requests Total processed requests Reading Connections reading client requests Writing Connections writing responses Waiting Idle keep-alive connections
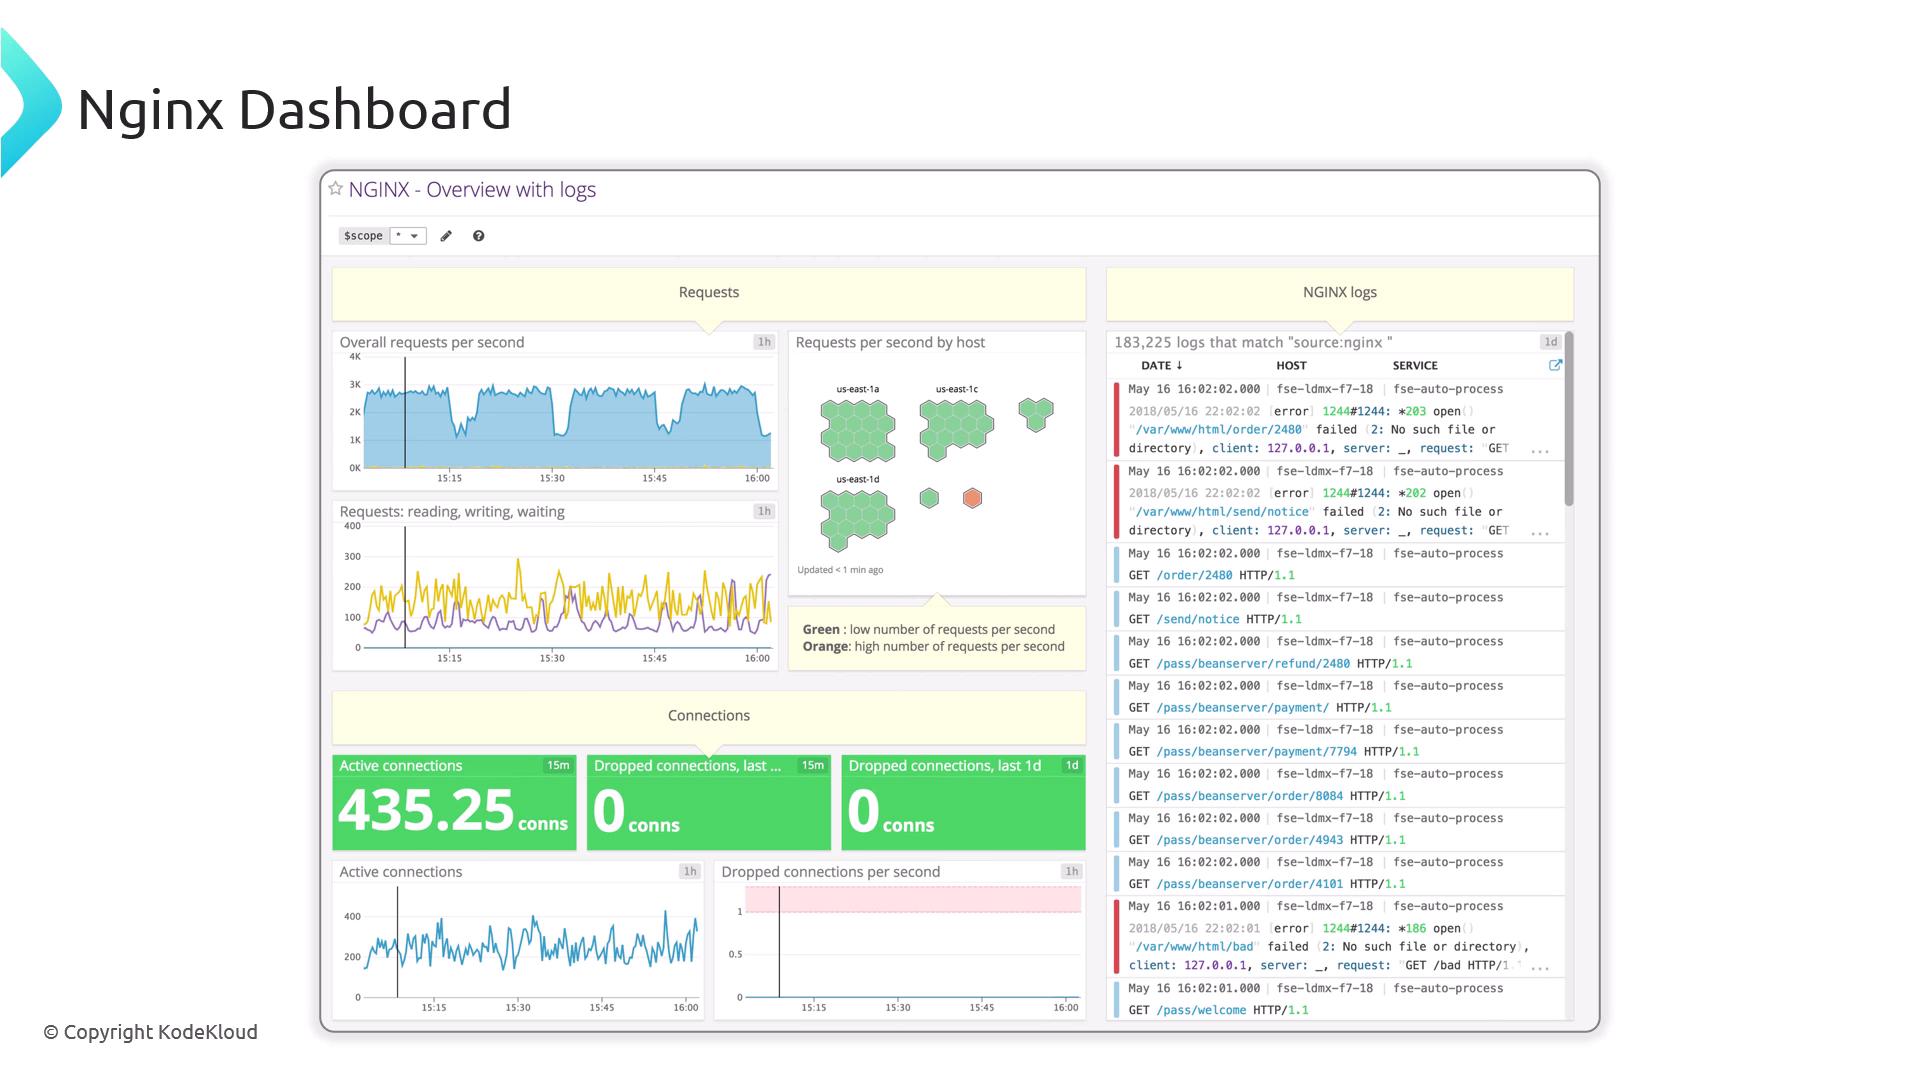
External Monitoring Agents For advanced dashboards, alerts, and long-term retention, integrate Nginx with external platforms.
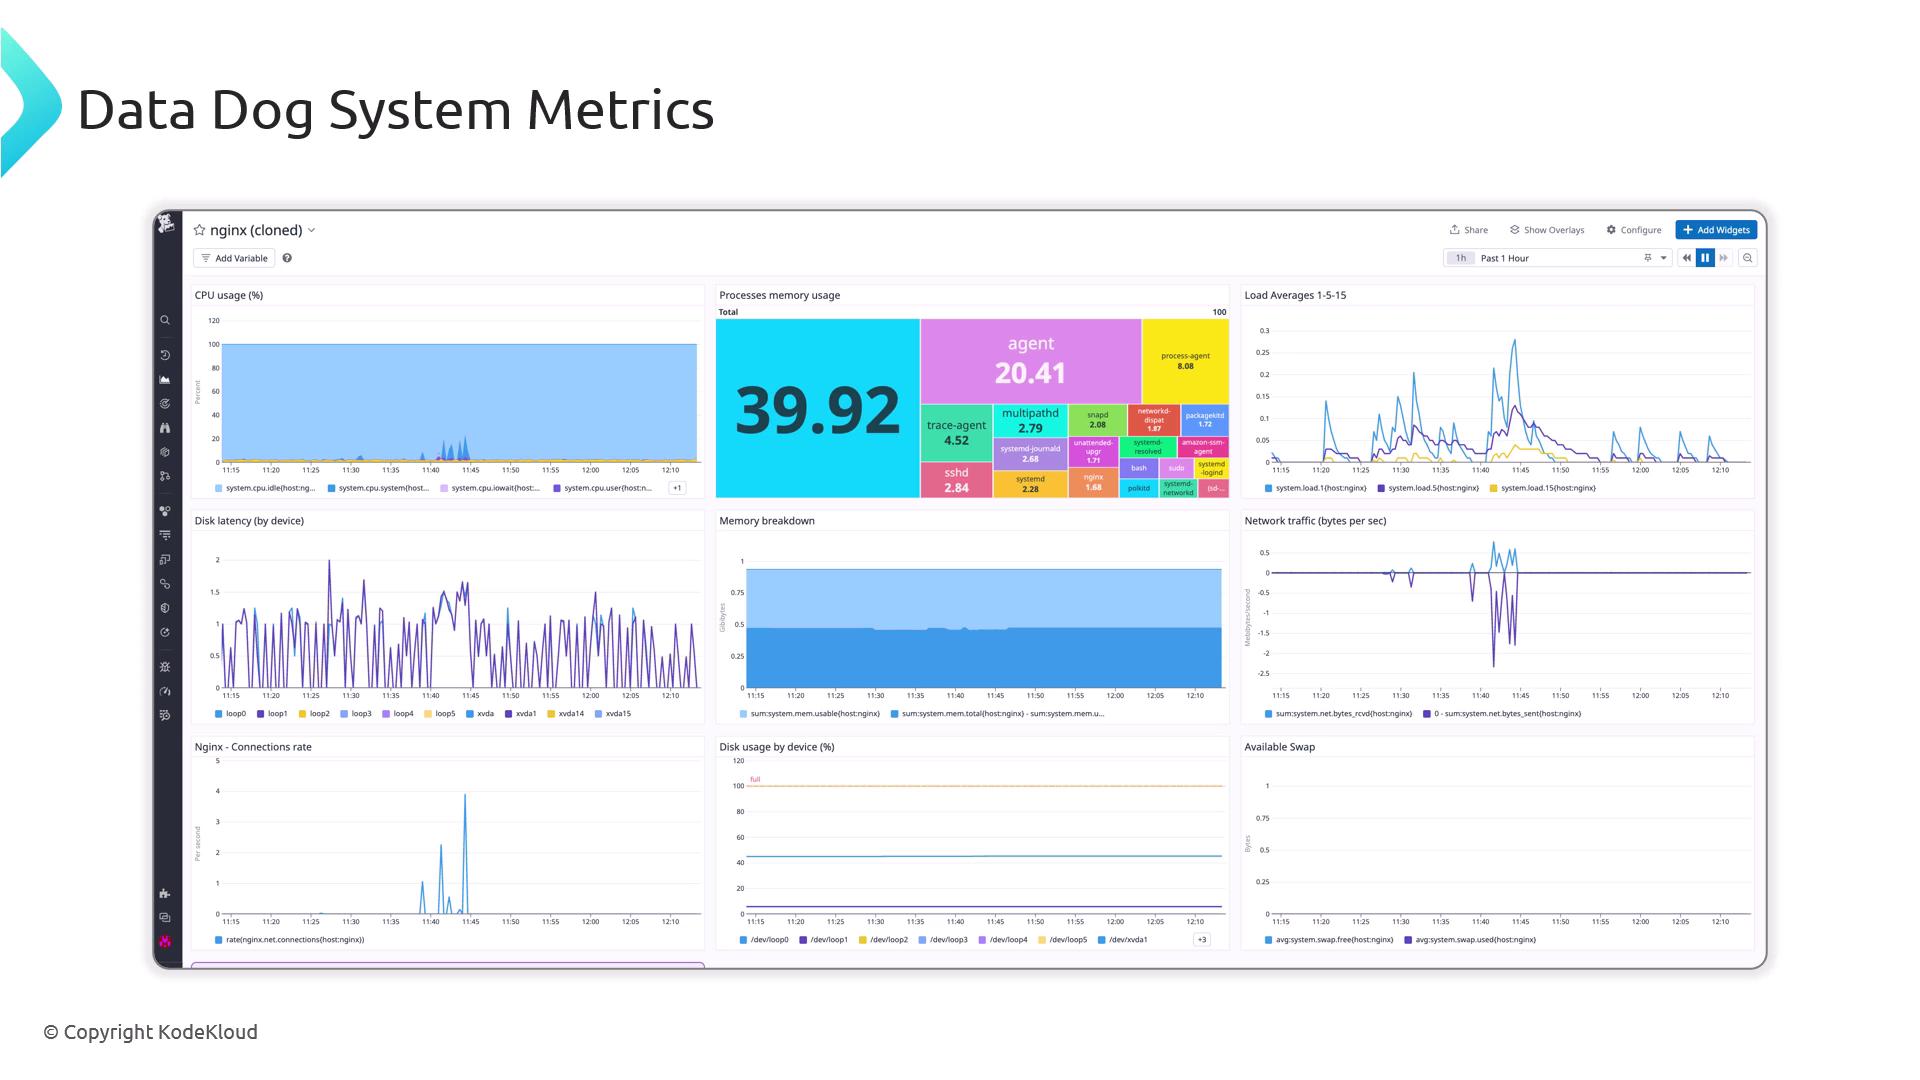
Tool Use Case Link Prometheus & Grafana Pulls stub_status metrics, rich graphs Prometheus / Grafana Datadog SaaS monitoring with Nginx integration Datadog Dynatrace Full-stack application monitoring Dynatrace New Relic APM with Nginx plugin New Relic
After installing the Datadog agent, you’ll receive out-of-the-box metrics for CPU, memory, disk I/O, network, requests, connections, and status codes.
Configuration Testing and Reloading Validate every change before reloading Nginx:
Success:
nginx: the configuration file /etc/nginx/nginx.conf syntax is ok
nginx: configuration file /etc/nginx/nginx.conf test is successful
Failure:
nginx: [emerg] unknown directive "worker_connection" in /etc/nginx/nginx.conf:7
nginx: configuration file /etc/nginx/nginx.conf test failed
Always run nginx -t prior to nginx -s reload to prevent downtime due to syntax errors.
Reload without dropping connections:
Service Status and Basic Connectivity Check Nginx’s systemd status:
If it’s inactive:
Ensure no port conflicts on 80 or 443 :
Test HTTP locally:
A 200 OK confirms that Nginx is serving content correctly.
Firewall Configuration Open ports 80 and 443 on both OS and cloud firewalls.
Ubuntu (ufw):
sudo ufw allow 80/tcp
sudo ufw allow 443/tcp
sudo ufw reload
RHEL/CentOS (firewalld):
sudo firewall-cmd --permanent --add-port=80/tcp
sudo firewall-cmd --permanent --add-port=443/tcp
sudo firewall-cmd --reload
Blocked ports will prevent any external traffic from reaching your server.
Conclusion You’ve learned how to:
Define and interpret access and error logs
Expose basic metrics with stub_status
Integrate with external monitoring tools (e.g., Datadog, Prometheus)
Validate and reload configurations safely
Verify service status , connectivity, and firewall settings
With these practices in place, your Nginx server will be easier to monitor, troubleshoot, and maintain.