

- Use Elastic Cloud Observability onboarding to get the Elastic Agent installation command and API key.
- Install the Elastic Agent on the Jenkins controller.
- Update the Elastic Agent configuration at
/opt/Elastic/Agent/elastic-agent.ymlto stream the Audit Trail files. - Verify logs in Kibana / Elastic Cloud Observability.
1. Create an Elastic Cloud trial and get onboarding details
In Elastic Cloud, open the Observability tab → Collect and analyze logs → choose the resource type to monitor (for a Jenkins controller, choose host system logs or stream log files). Elastic Cloud will produce an onboarding one-liner that downloads and installs the Elastic Agent and enrolls it with your cluster.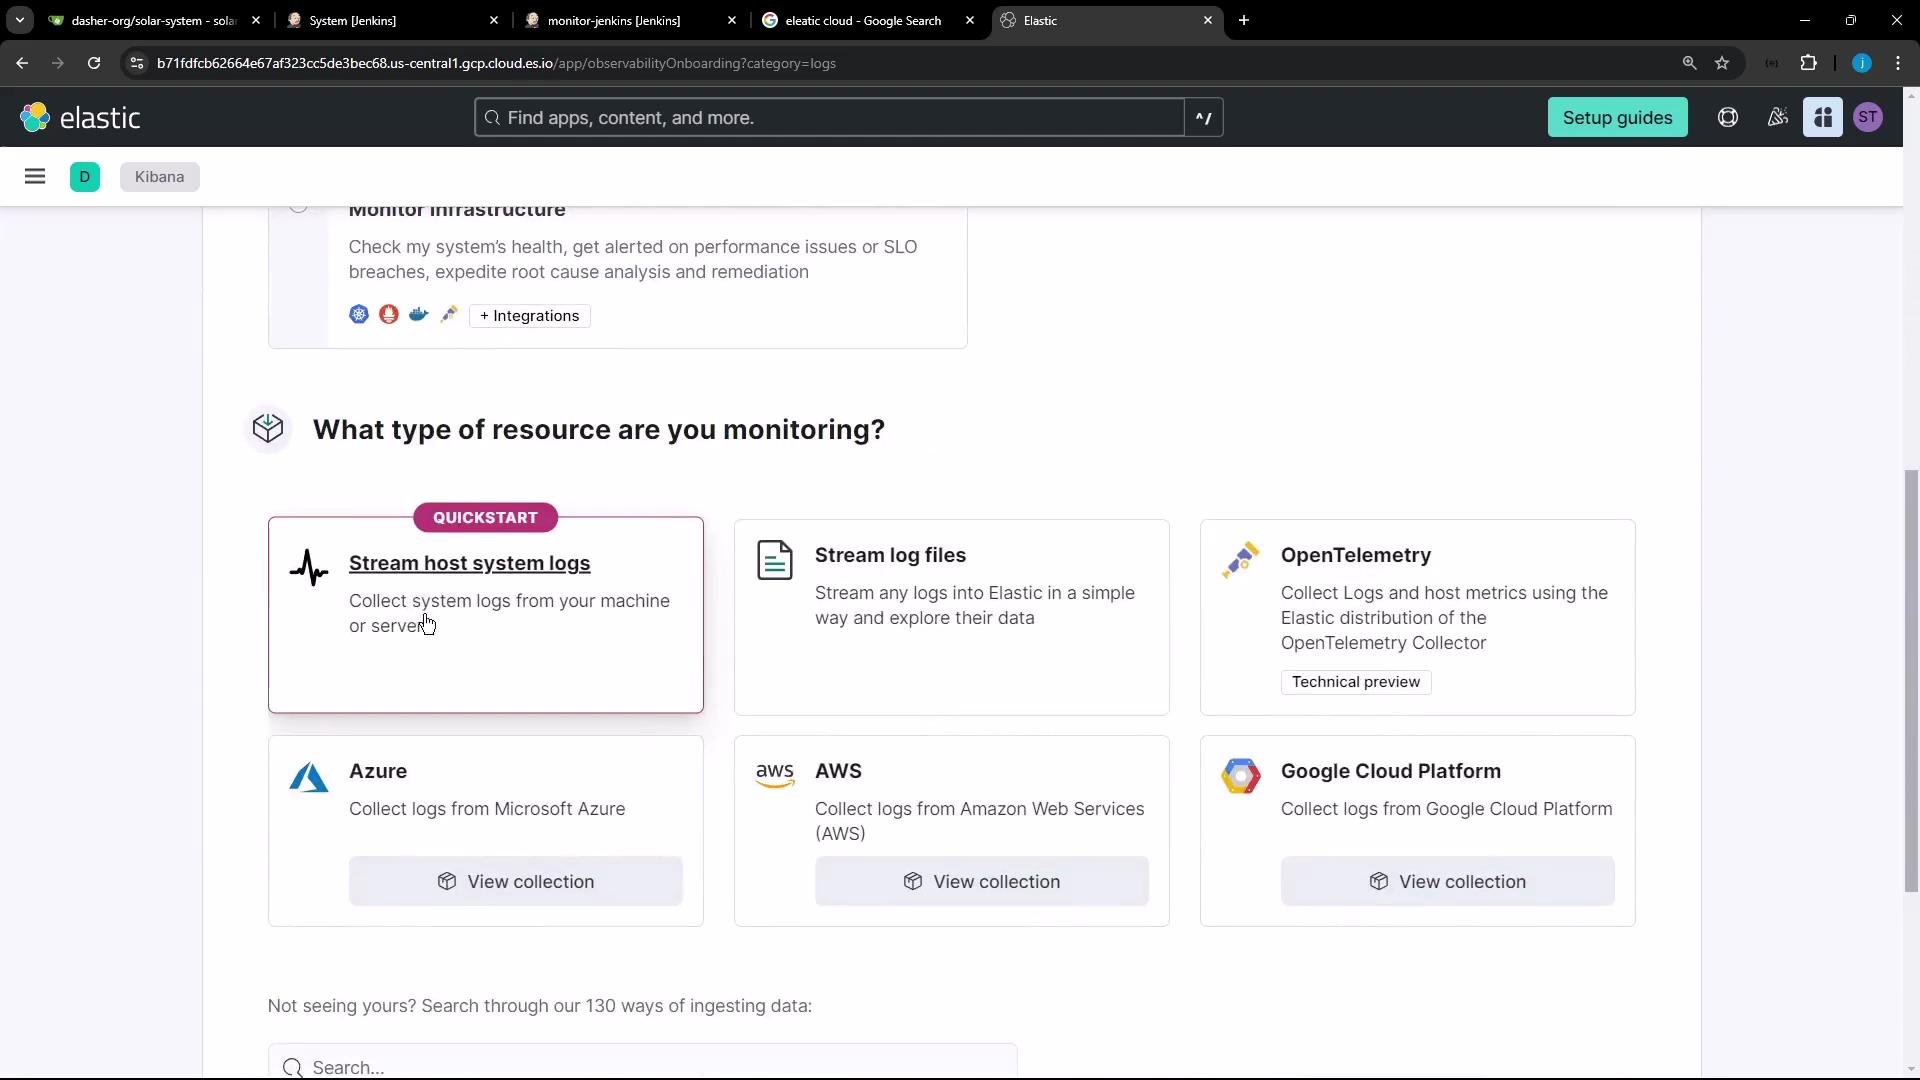
Keep your onboarding API key secret. Do not check it into source control or share it publicly. Use the exact API key and onboarding endpoint provided by your Elastic Cloud Observability onboarding page.
/opt/Elastic/Agent/elastic-agent.yml.
Typical condensed output:
2. Confirm Jenkins Audit Trail files exist
Before configuring the agent, confirm the Audit Trail plugin writes logs somewhere accessible to the agent. Common location:3. Review the onboarding configuration
The onboarding script writes a baseelastic-agent.yml. Important sections:
outputs— where the agent sends data (Elasticsearch cluster and API key).inputs— what log files to collect.
inputs: list.
4. Add a logfile input for Jenkins Audit Trail
Edit/opt/Elastic/Agent/elastic-agent.yml and add a logfile input that targets the Audit Trail files. Use wildcards to capture rotated files and include multiline only if entries span multiple lines.
Minimal example to add under inputs::
- Use
pathswith a wildcard (custom*.log*) to include rotated logs. - Only enable
multilineif log entries span multiple lines; thepattern: '^\\s'+match: aftertreats indented lines as continuations. - Select a clear
dataset(e.g.,jenkins.audit) so logs are organized correctly in Elastic.
5. Restart the Elastic Agent
After savingelastic-agent.yml, restart the agent so it applies the new configuration:
6. Verify logs in Kibana / Elastic Cloud
Open Kibana → Observability → Logs (or Discover). Look for events with the dataset you configured (for examplejenkins.audit) and inspect parsed fields.
If parsing or ingest issues occur, check:
- Agent logs on host:
/var/log/elastic-agent/orjournalctl -u elastic-agent. - That the
paths:you configured match actual files and permissions allow the agent to read them. - The ingest pipeline used by Elastic for your dataset; default pipelines may expect a different timestamp/format.
Troubleshooting
Example parsing error you might see:
grok processor in the agent configuration to normalize the fields.
Make sure to use the exact API key and onboarding endpoint provided by your Elastic Cloud Observability onboarding page. After editing
elastic-agent.yml, always restart the Elastic Agent so it reloads the configuration.Summary checklist
That’s it — once the agent is reading the audit files and sending events to your Elastic Cloud cluster, you can build Discover queries, dashboards, or alerts based on the
jenkins.audit dataset.