This article explains how to create and configure loggers in Jenkins for troubleshooting and debugging using the Log Recorder.
In this lesson, we’ll explore how to create and configure loggers in Jenkins for effective troubleshooting and debugging using the Log Recorder. You can choose one of the following methods to adjust logging levels:
Approach
Method
Persistence
1
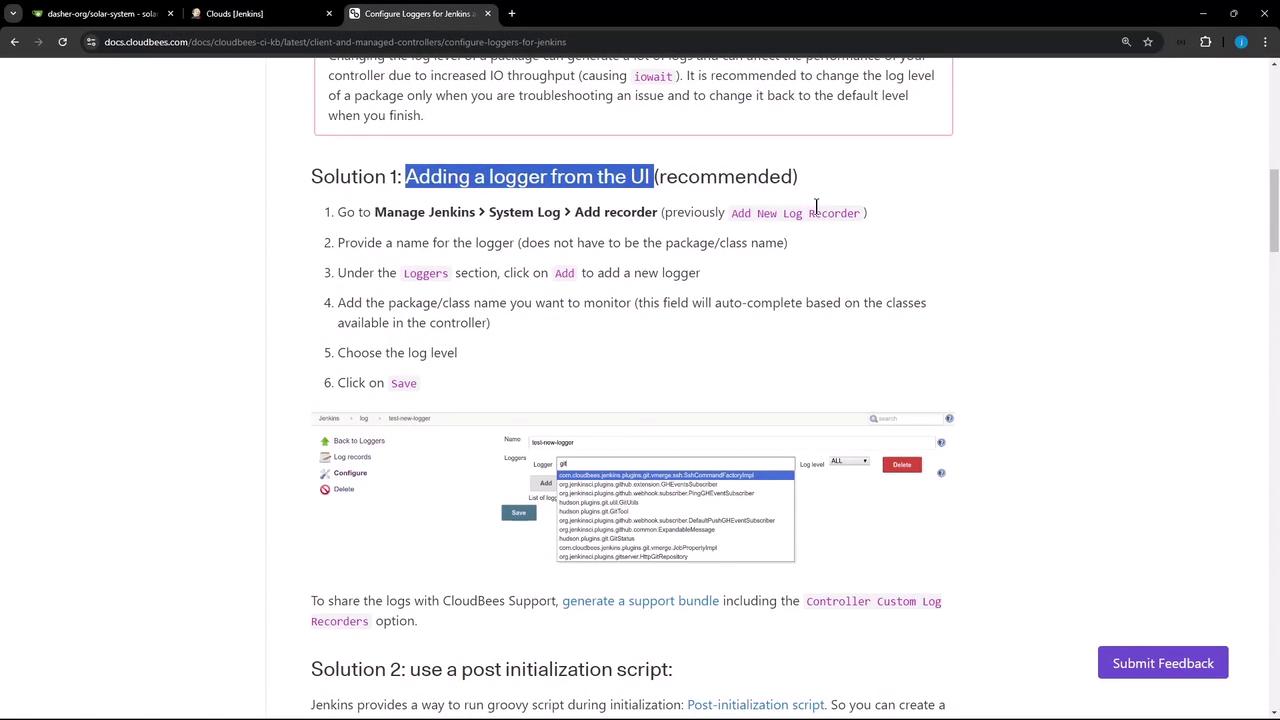
Add a logger from the UI (recommended)
Permanent
2
Run a Groovy script during Jenkins initialization
Permanent
3
Supply a logging.properties file in $JENKINS_HOME/logging.properties
Permanent
4
Place a logger configuration file in the $JENKINS_HOME/logs directory
Permanent
5
Configure default levels via the UI (non-persistent)
Session only (resets after restart)
Increasing log verbosity can generate large volumes of data and impact the Jenkins controller’s performance. Enable higher log levels only during active troubleshooting, then revert to defaults or remove the custom logger.
2. Use Case: Capturing Logs for a Kubernetes Cloud
When Jenkins is integrated with a Kubernetes cloud, a simple Test Connection might fail due to insufficient permissions:
Error testing connection https://...k8s.ondigitalocean.com: io.fabric8.kubernetes.client.KubernetesClientException: Failure executing GET at https://.../api/v1/namespaces/jenkins-123/pods. Message: pods is forbidden: User "system:serviceaccount:jenkins:jenkins-sa" cannot list resource "pods" in the namespace "jenkins-123"Received status: Status(apiVersion="", code=403, kind=Status, message=pods is forbidden: ..., metadata=...)
To troubleshoot this:
Navigate to Manage Jenkins → System Log.
Click Add new log recorder, name it k8s-logs.
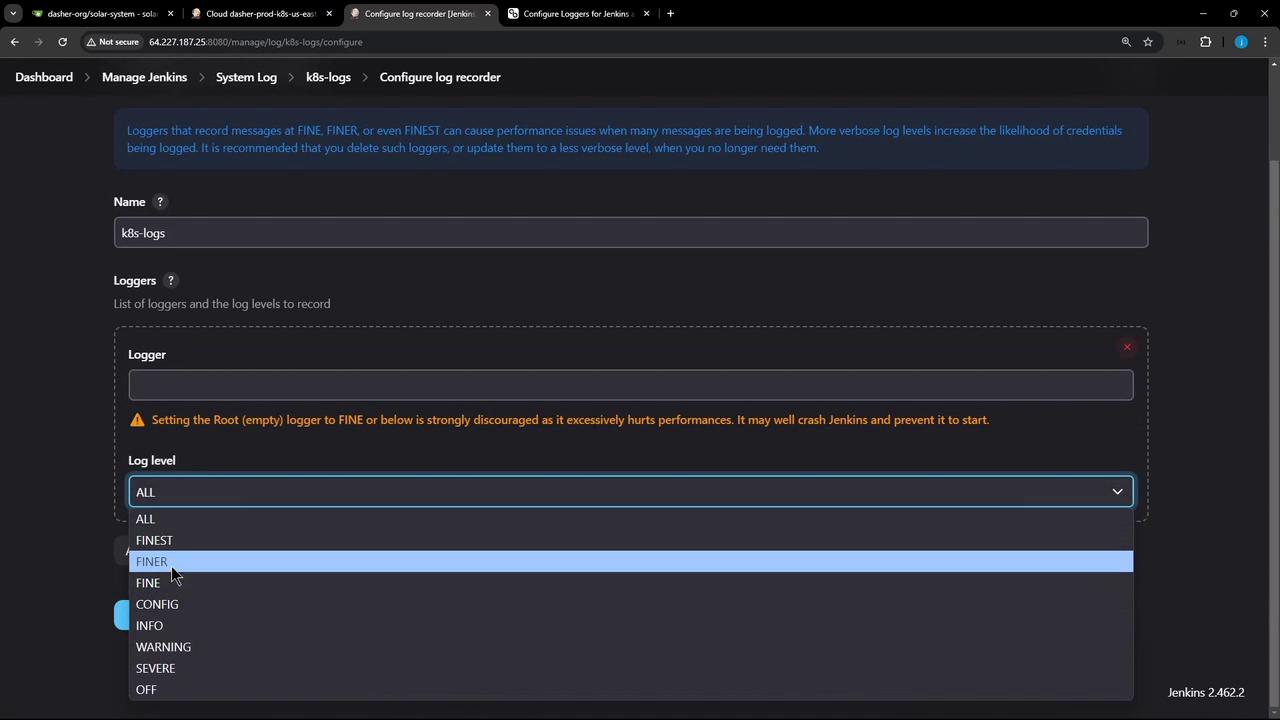
Under Log Levels, set ALL (or another desired level).
In Loggers, search for kubernetes and select io.fabric8.kubernetes.client (or a specific sub-package).
Click Save.
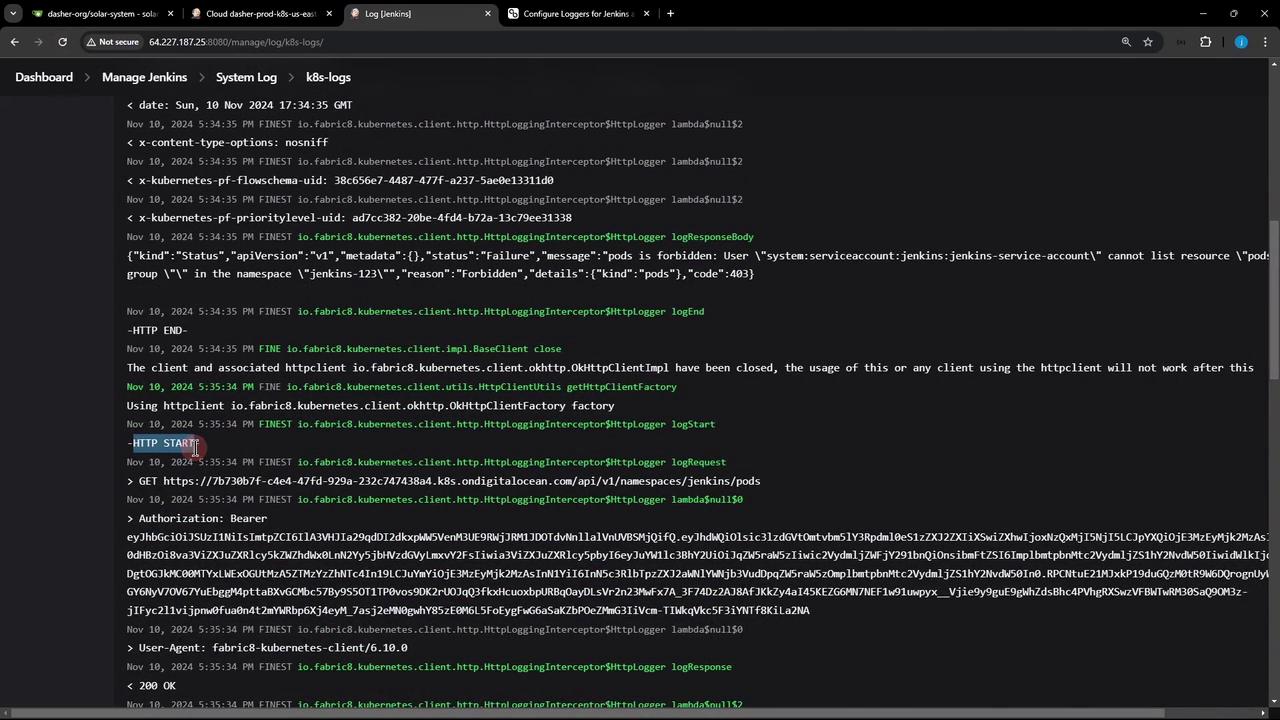
After saving, trigger Test Connection again and refresh the k8s-logs recorder. You should see detailed HTTP traffic:
Nov 10, 2024 17:34:35 FINE io.fabric8.kubernetes.client.utils.HttpClientUtils getHttpClientFactoryUsing httpclient io.fabric8.kubernetes.client.okhttp.OkHttpClientFactory factoryNov 10, 2024 17:34:35 FINEST io.fabric8.kubernetes.client.http.HttpLoggingInterceptor$HttpLogger logStart-HTTP START-Nov 10, 2024 17:34:35 FINEST io.fabric8.kubernetes.client.http.HttpLoggingInterceptor$HttpLogger logRequest> GET https://.../api/v1/namespaces/jenkins-123/pods> Authorization: Bearer eyJhbGciOiJSUzI1NiIsImtpZCI6Ij...Nov 10, 2024 17:34:35 FINEST io.fabric8.kubernetes.client.http.HttpLoggingInterceptor$HttpLogger logResponse< HTTP/1.1 403 Forbidden< content-type: application/json< content-length: 302{ "kind": "Status", "apiVersion": "v1", "status": "Failure", "message": "pods is forbidden: User \"system:serviceaccount:jenkins:jenkins-service-account\" cannot list resource \"pods\" in the namespace \"jenkins-123\"", "reason": "Forbidden", "details": { "kind": "pods" }, "code": 403}Nov 10, 2024 17:34:35 FINE io.fabric8.kubernetes.client.impl.BaseClient closeThe client and associated httpclient ... have been closed.
Once credentials or RBAC rules are corrected, rerunning the test will produce a concise success response: