

Use Audit Trail to maintain an auditable record of administrative and job-related actions. Choose the logging destination that fits your operational and compliance requirements (local file, syslog, or Elasticsearch).
Install the plugin
- In Jenkins go to Manage Jenkins → Manage Plugins.
- Install from the Available tab (or check Installed if you already have it).
- After installation, open Manage Jenkins → Configure System and scroll to the Audit Trail section.
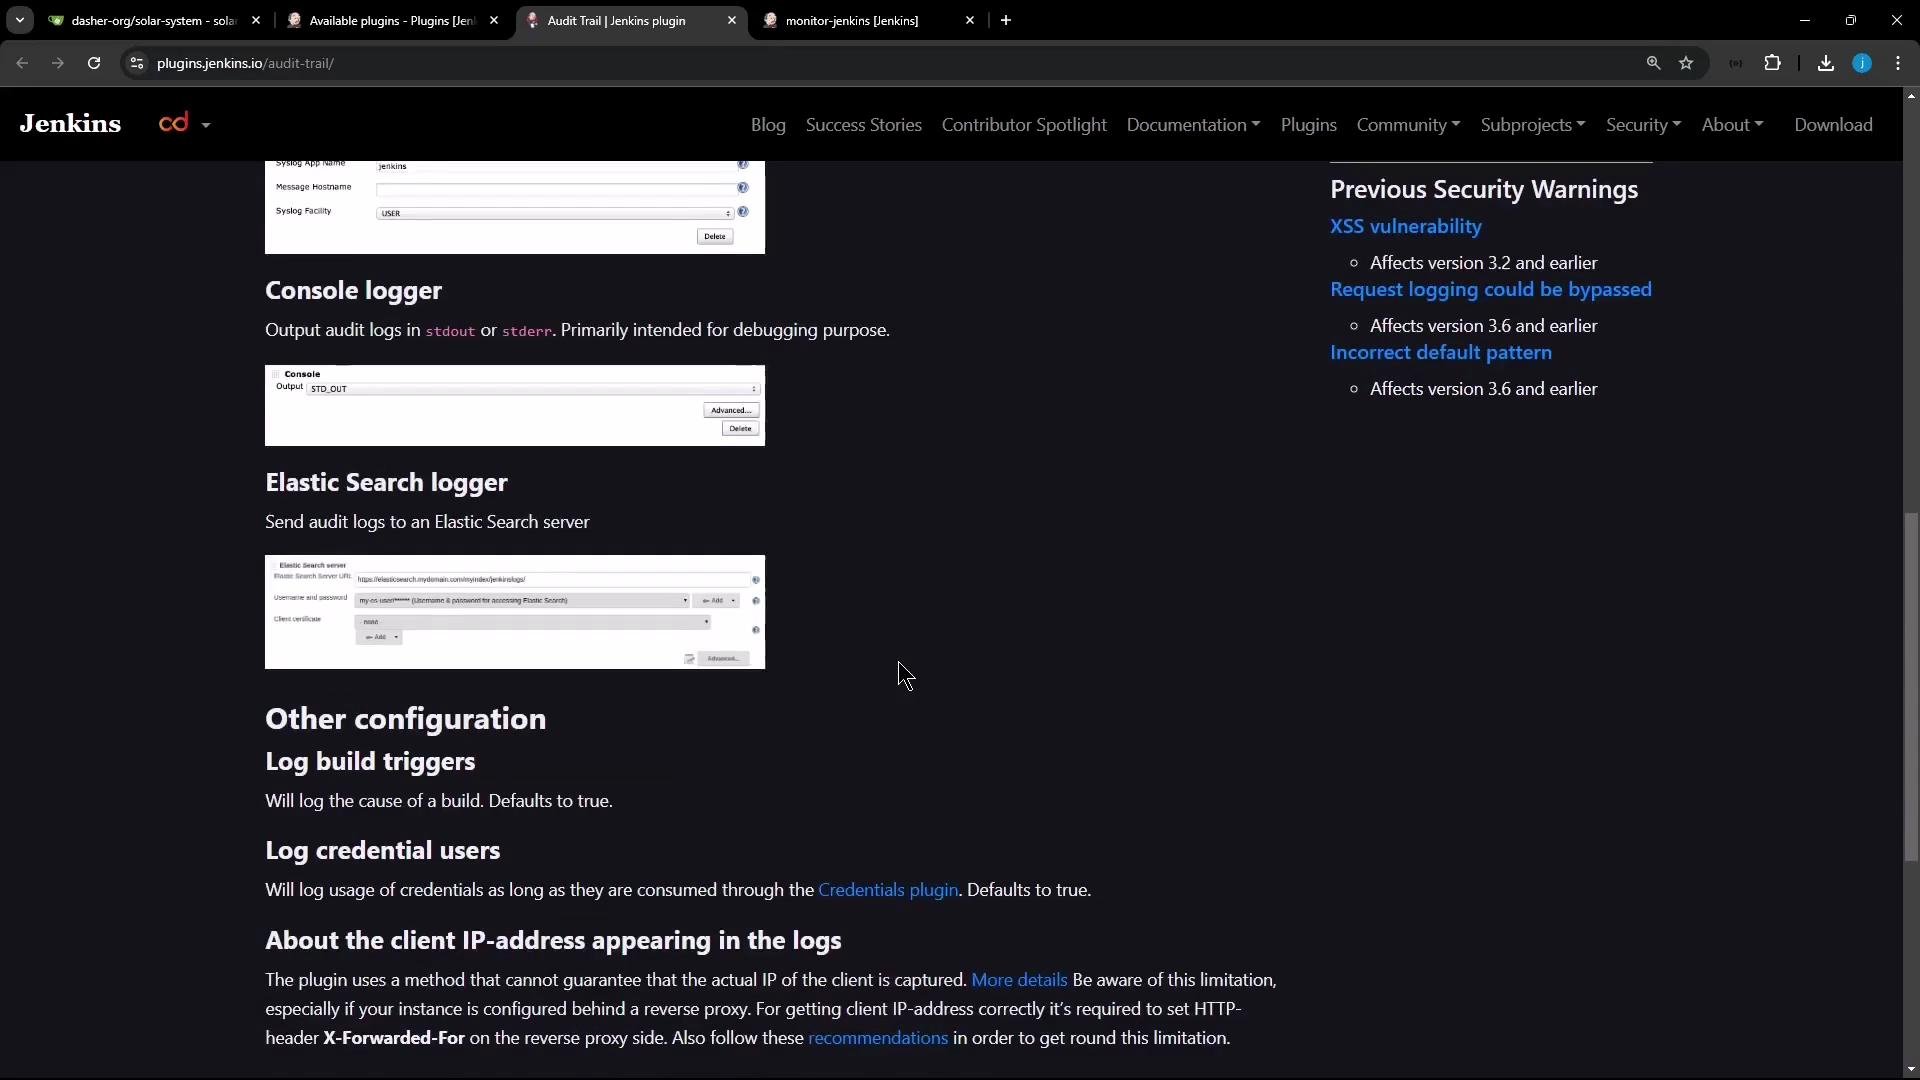
Configure Audit Trail (example: Log file with daily rotation)
This example configures Audit Trail to write rotated daily logs to/var/log/jenkins/custom-audit-%g.log.
- Open Manage Jenkins → Configure System → Audit Trail.
- Enable Log file (daily rotation).
- Set the log file name pattern. Use
%gfor rotated file numbering, for example:
- Optionally set the number of rotated files to keep (
file count). - Provide a regular expression to match Jenkins endpoints/actions you want to capture. Example:
Ensure the Jenkins process has write permissions to the configured log directory (for example
/var/log/jenkins). On systems with SELinux or custom permissions, you may need to adjust policies or folder ownership (chown jenkins:jenkins /var/log/jenkins) to allow logging.Test and verify logging
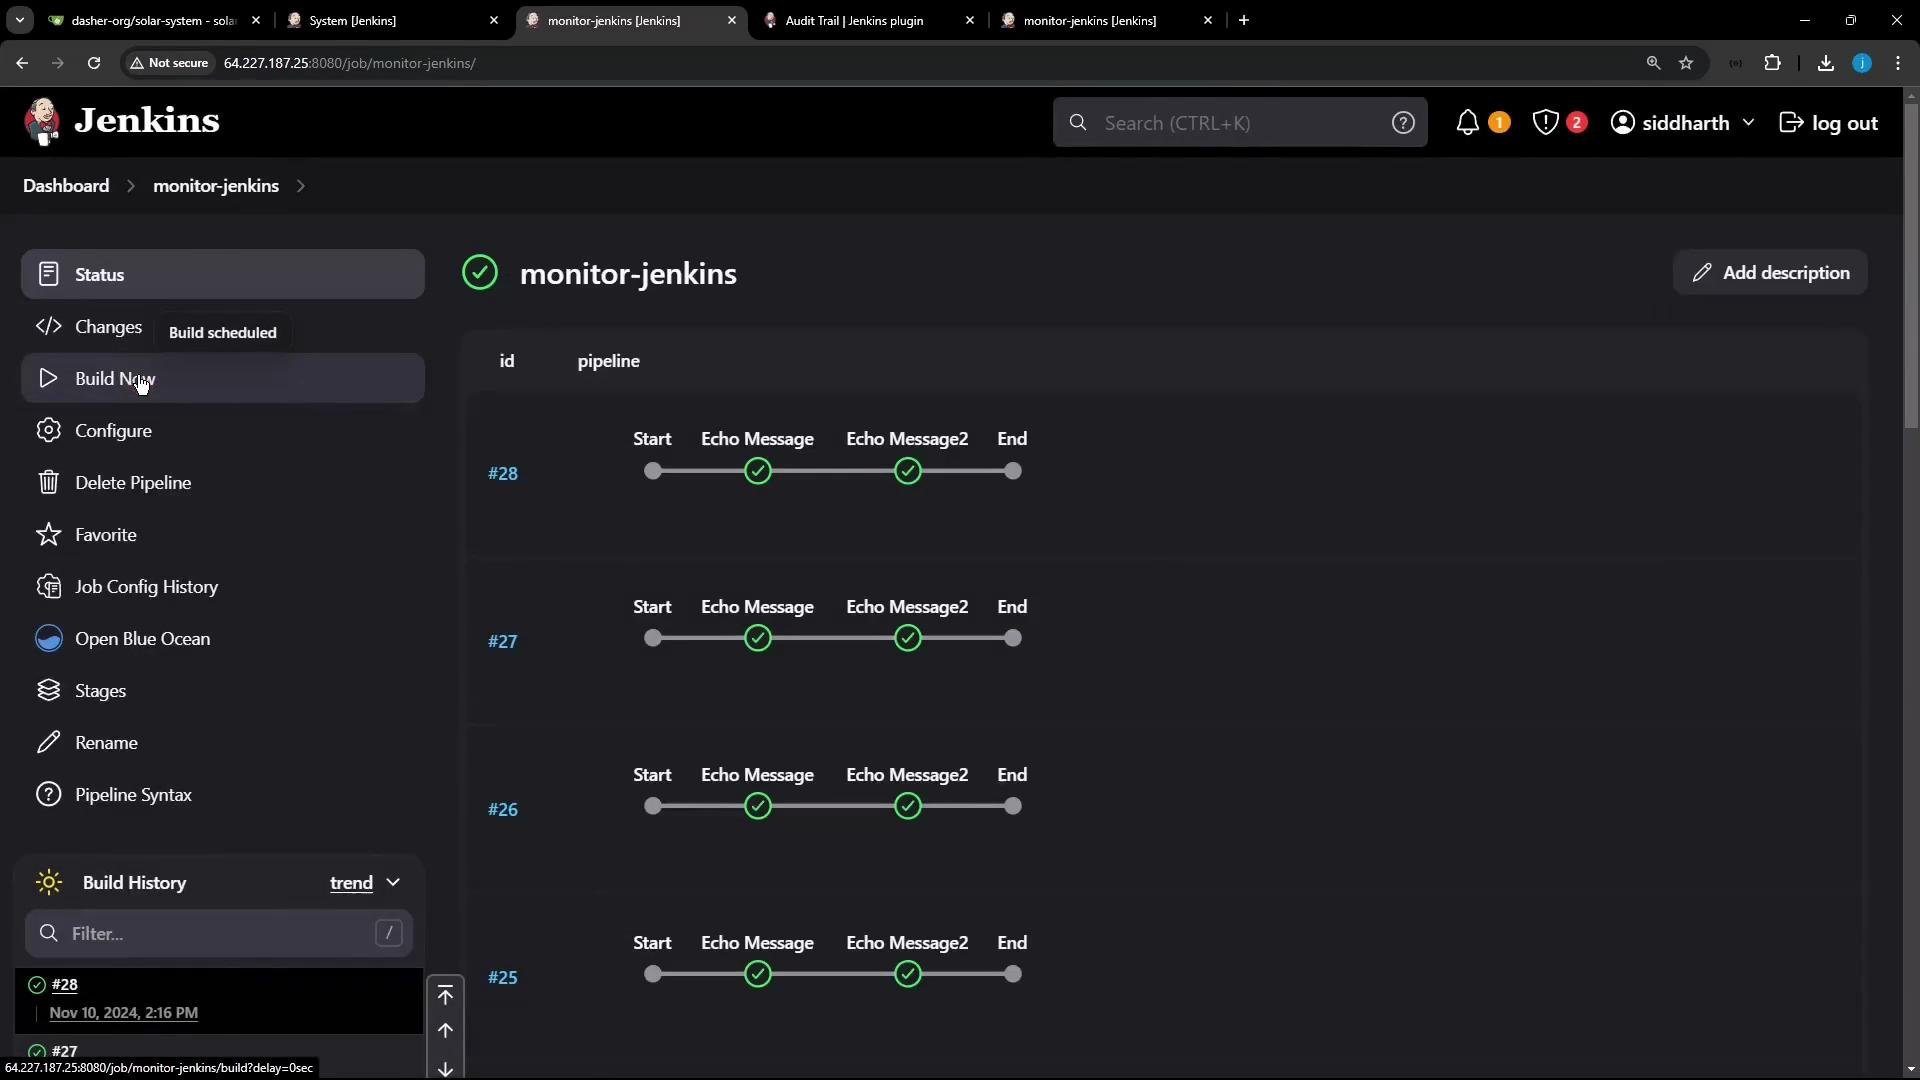
To verify the configuration:- Make a small change to a job (for example, update a step that echoes messages).
- Trigger a build for that job.
- Check the log directory for the rotated audit files.
monitor-jenkins is modified and a build is triggered.
- The first line shows a configuration submission for the job
monitor-jenkinsby usersiddharthfrom IP124.123.186.17. - The next lines show job #29 being started and then completed successfully, with timestamps and node information.
- Subsequent entries show Manage Jenkins configuration changes.
Adapting Audit Trail to your environment
- Syslog: Forward events to your centralized syslog collector for aggregation and retention.
- Elasticsearch: Send events to an Elasticsearch cluster for indexing, search, and visualization (useful with Kibana).
- Local files: Use rotated files for local retention and offline audits.
- Audit Trail Plugin (Jenkins)
- Elasticsearch
- Jenkins Configuration as Code — consider automating Audit Trail configuration
/var/log/jenkins/custom-audit-%g.log, and verified that configuration changes and job executions are recorded.