

- Install and configure the Jenkins Prometheus plugin
- Verify the
/prometheusmetrics endpoint - Run Prometheus and Grafana (Docker Compose)
- Configure Prometheus to scrape Jenkins
- Add Prometheus as a Grafana data source and import a Jenkins dashboard
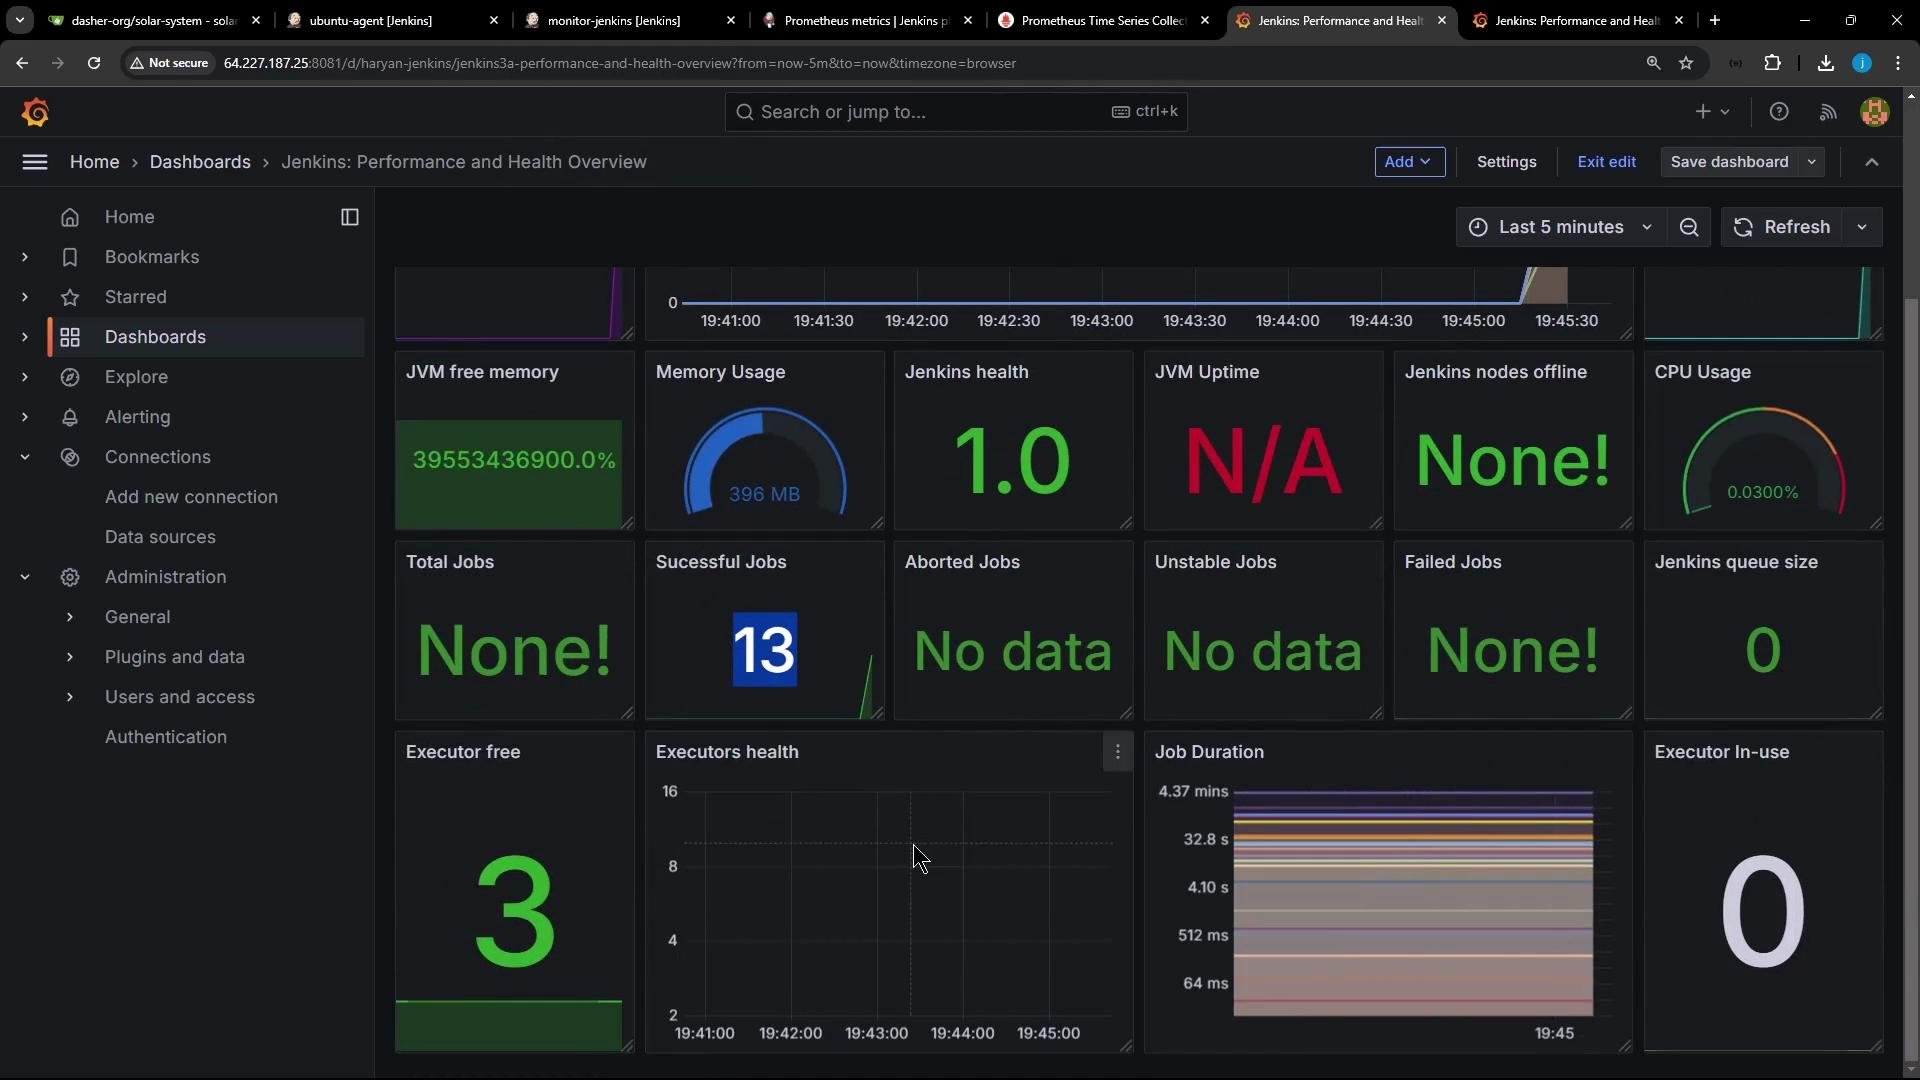
- Create test Jenkins activity and validate dashboards
- A running Jenkins instance where you can install plugins and access Manage Jenkins → Configure System
- Docker & Docker Compose (for the Prometheus + Grafana stack example) or an existing Prometheus/Grafana installation
- Network connectivity between Prometheus and Jenkins (or adjust
prometheus.ymlaccordingly)
- In Jenkins go to Manage Jenkins → Manage Plugins and install the “Prometheus metrics” plugin.
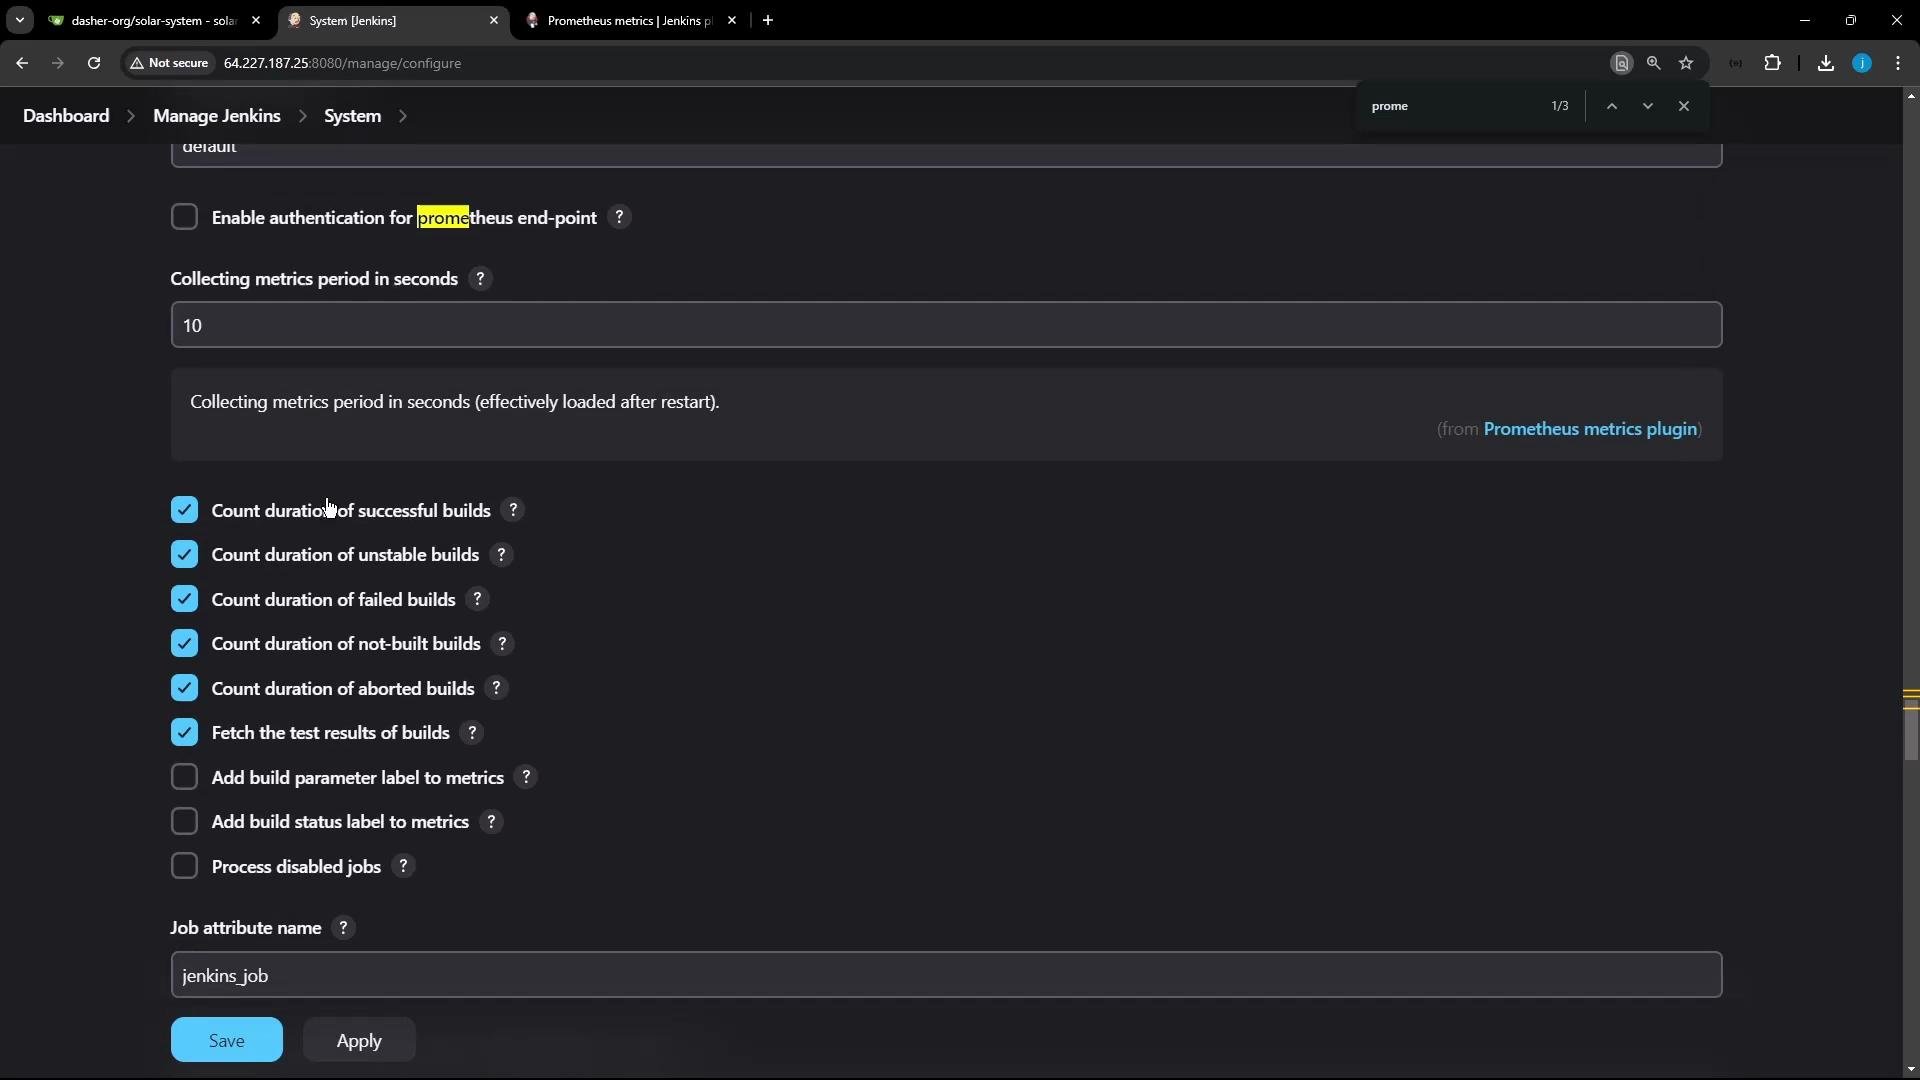
- After installation open Manage Jenkins → Configure System to review plugin settings and enable the metric groups you need (JVM, build metrics, node status, disk usage, etc.).
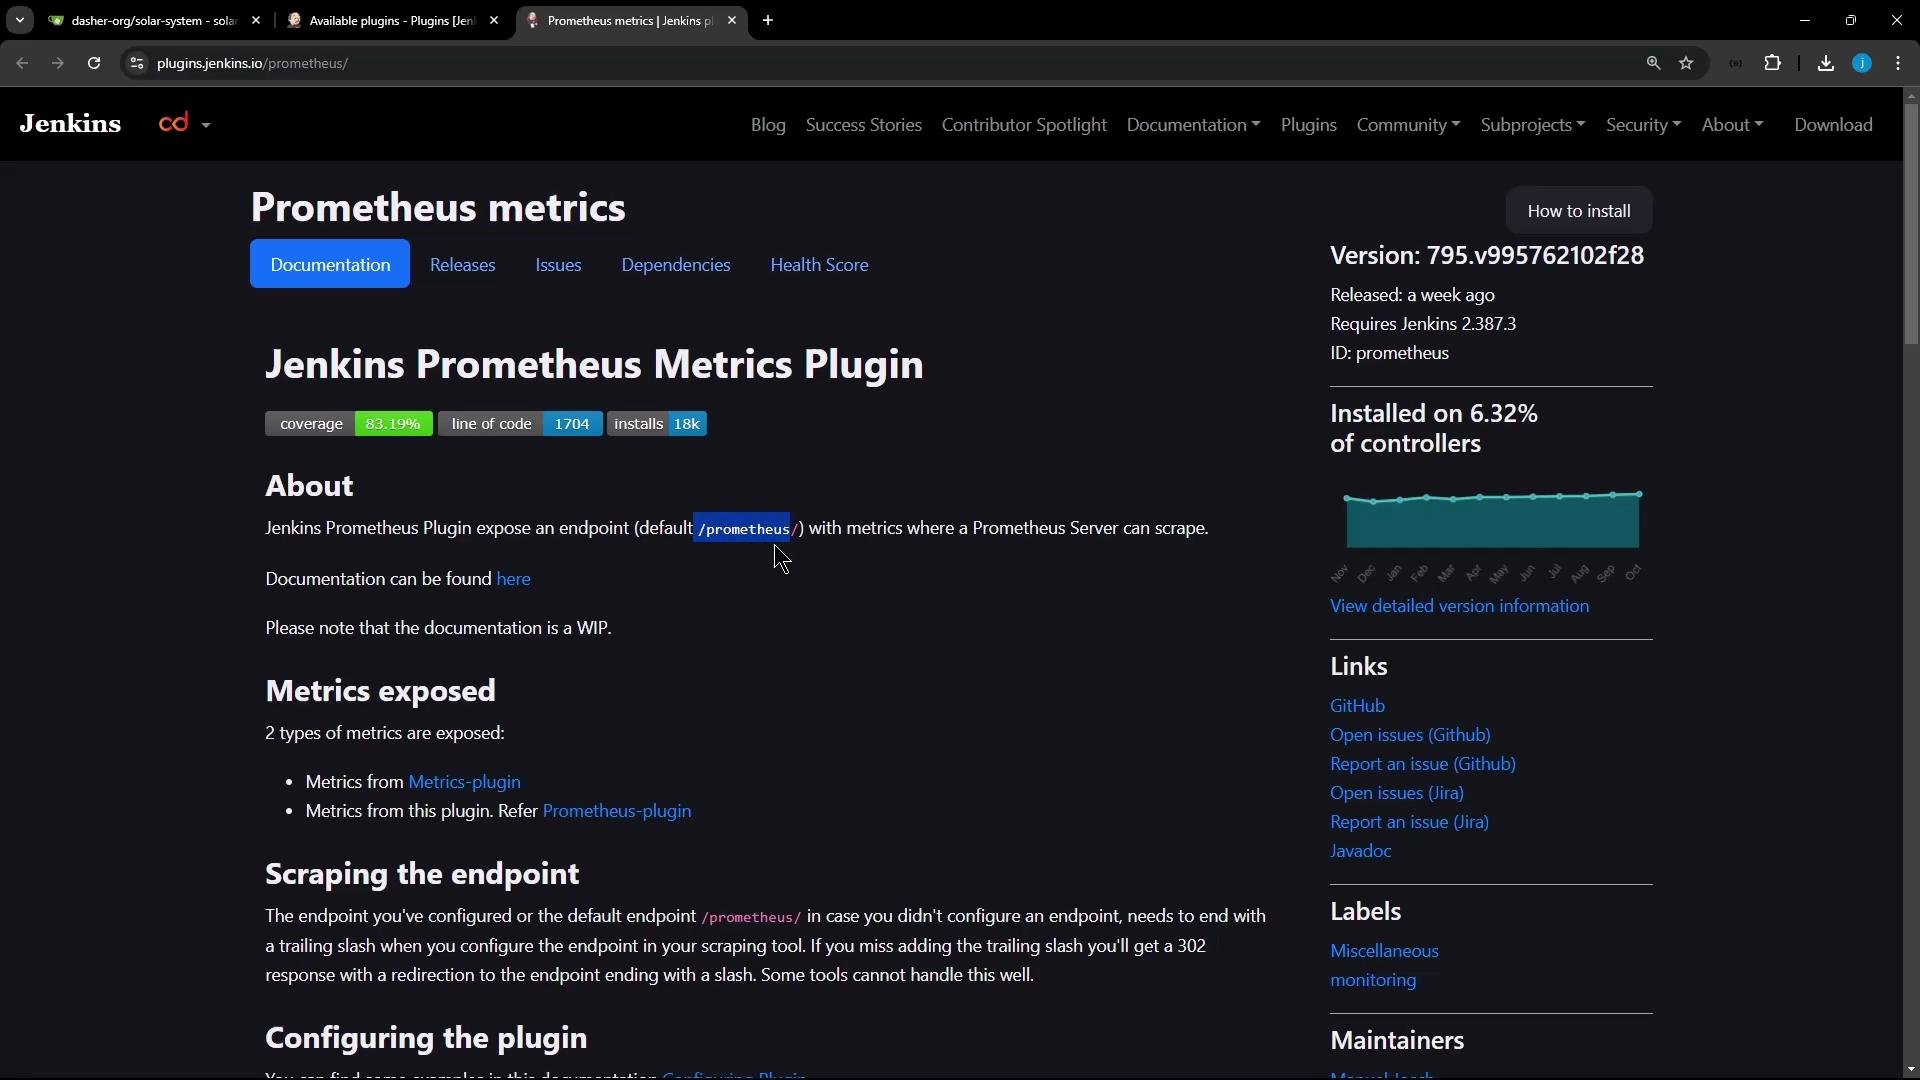
- The plugin exposes metrics at
/prometheusby default. - Typical settings include the collection interval (often 10s) and checkboxes to enable/disable metric groups (e.g., build durations, JVM metrics).
- Some metrics (like disk usage) may require extra permissions or supplemental plugins.
If the Prometheus plugin requests a Jenkins restart after changing settings, restart Jenkins so the
/prometheus endpoint is served correctly. The endpoint will be available at http://<jenkins-host>:<jenkins-port>/prometheus./prometheus endpoint returns plain text in Prometheus exposition format. Example (truncated):
admin / password credentials and is reachable on host port 8081. Prometheus reads /etc/prometheus/prometheus.yml from the ./prometheus folder.
prometheus.yml
Place this minimal prometheus.yml in ./prometheus/prometheus.yml (update the Jenkins target to your host/IP):
- Open Prometheus at
http://<vm-ip>:9090(orhttp://localhost:9090). - Navigate to Status → Targets and confirm the
jenkinsjob target is UP and scraping the/prometheuspath.
Example Prometheus expression queries:
- Log in to Grafana at
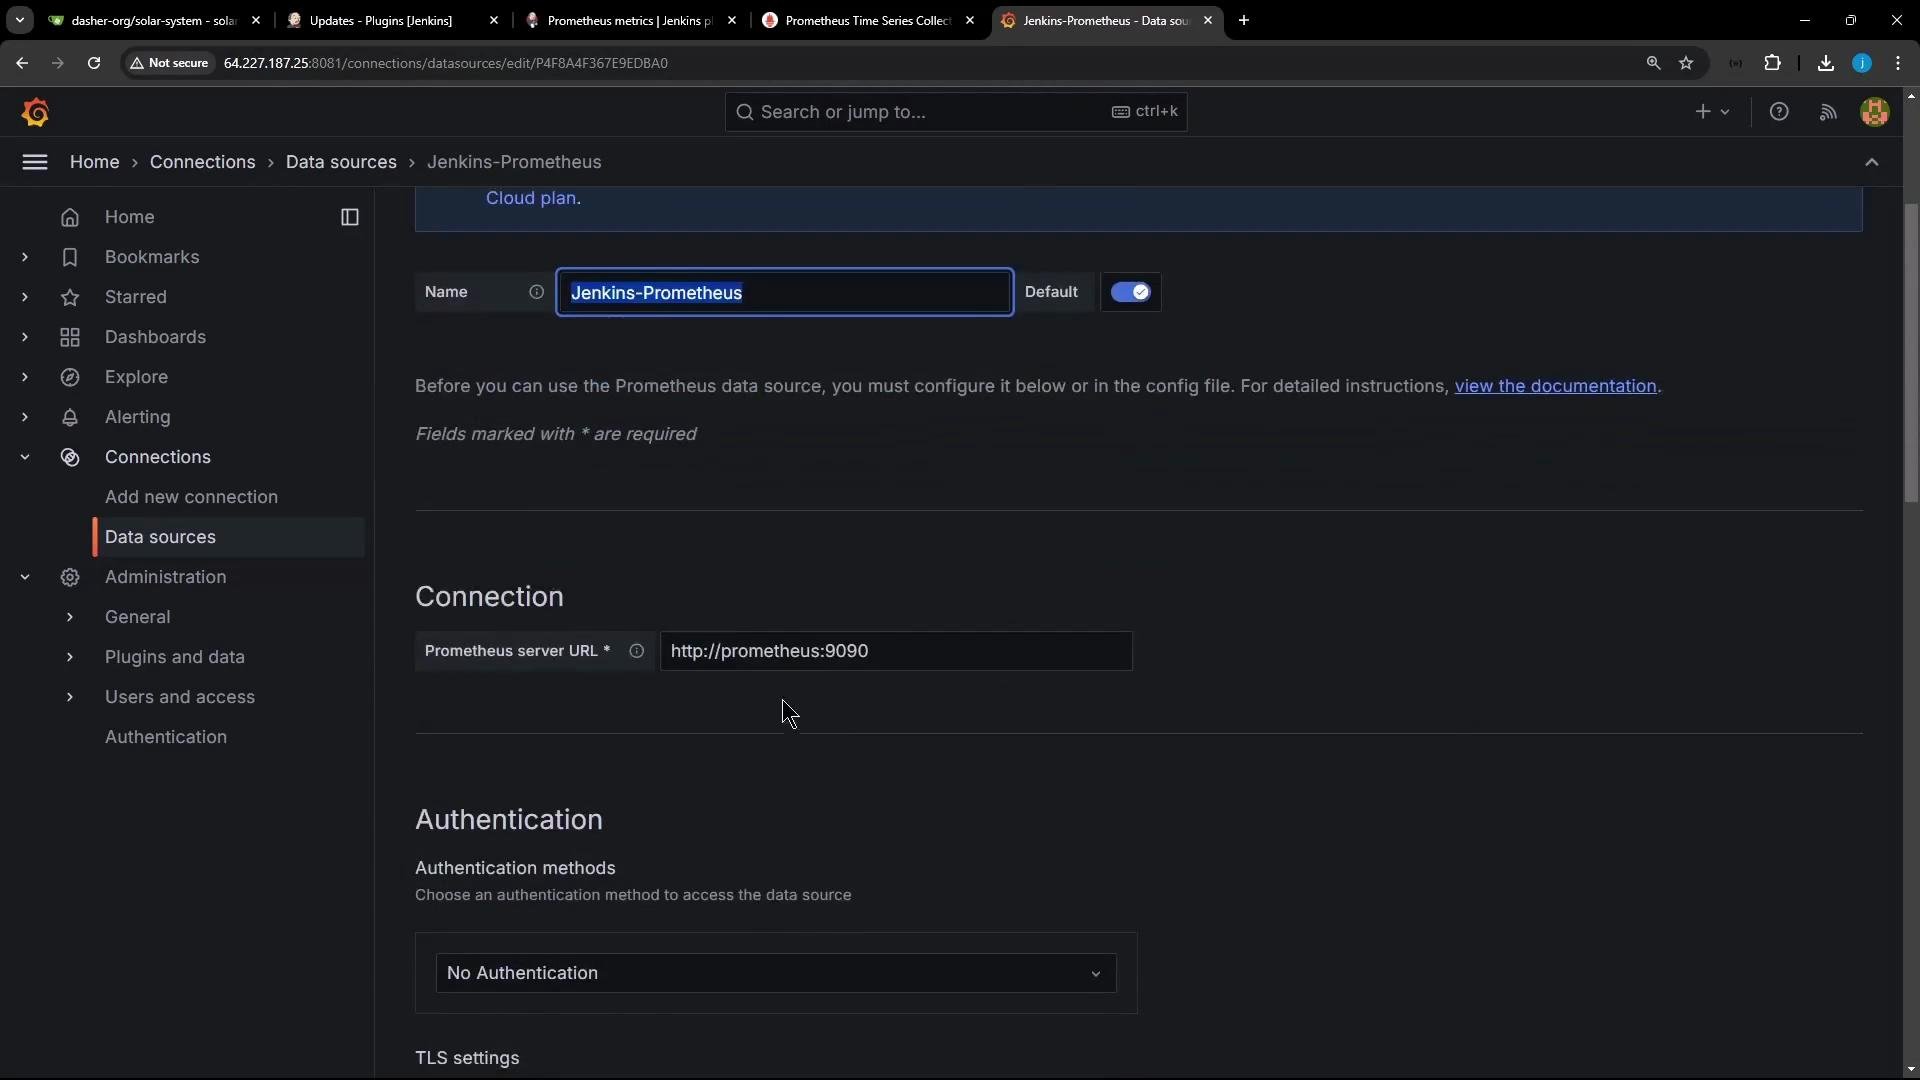
http://<vm-ip>:8081using the admin credentials. - Add a new Prometheus data source. If Grafana and Prometheus are in the same Docker network, use
http://prometheus:9090. If accessing externally, usehttp://<vm-ip>:9090.
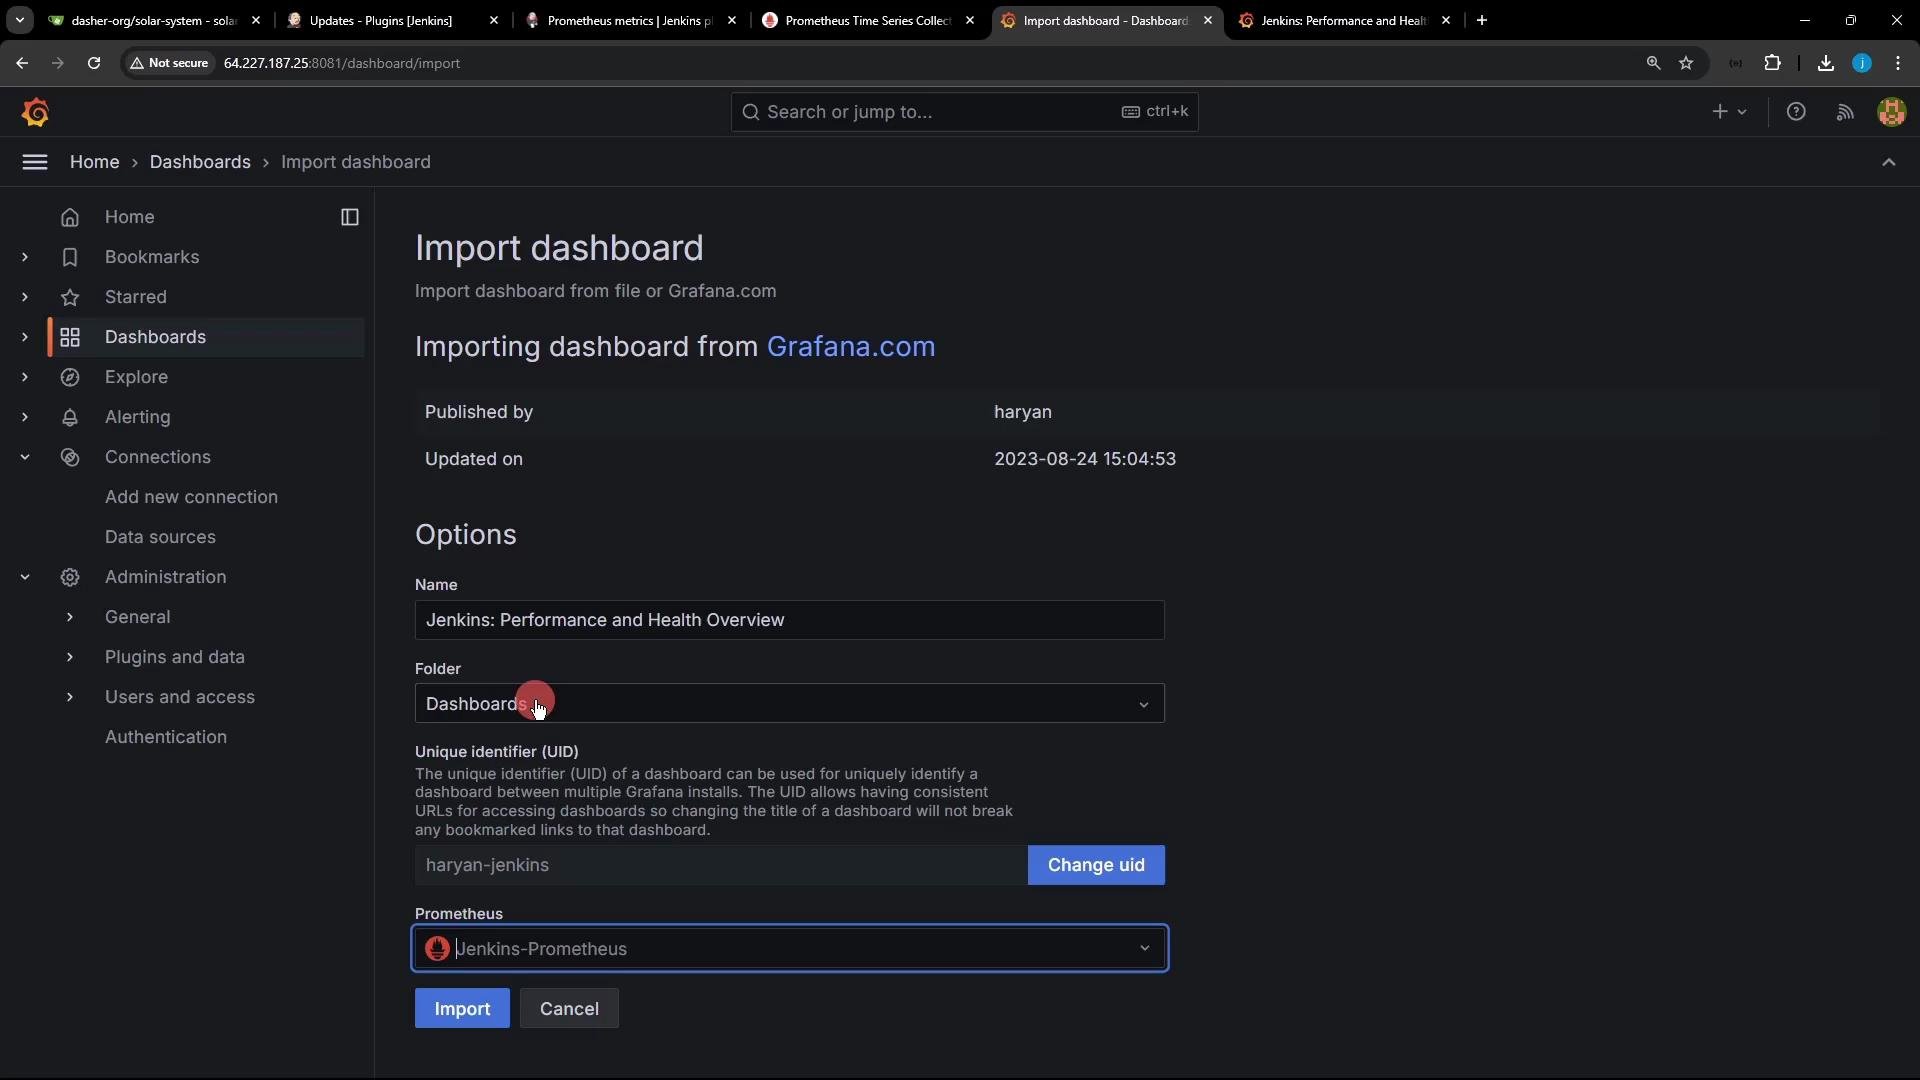
- In Grafana go to Dashboards → Import
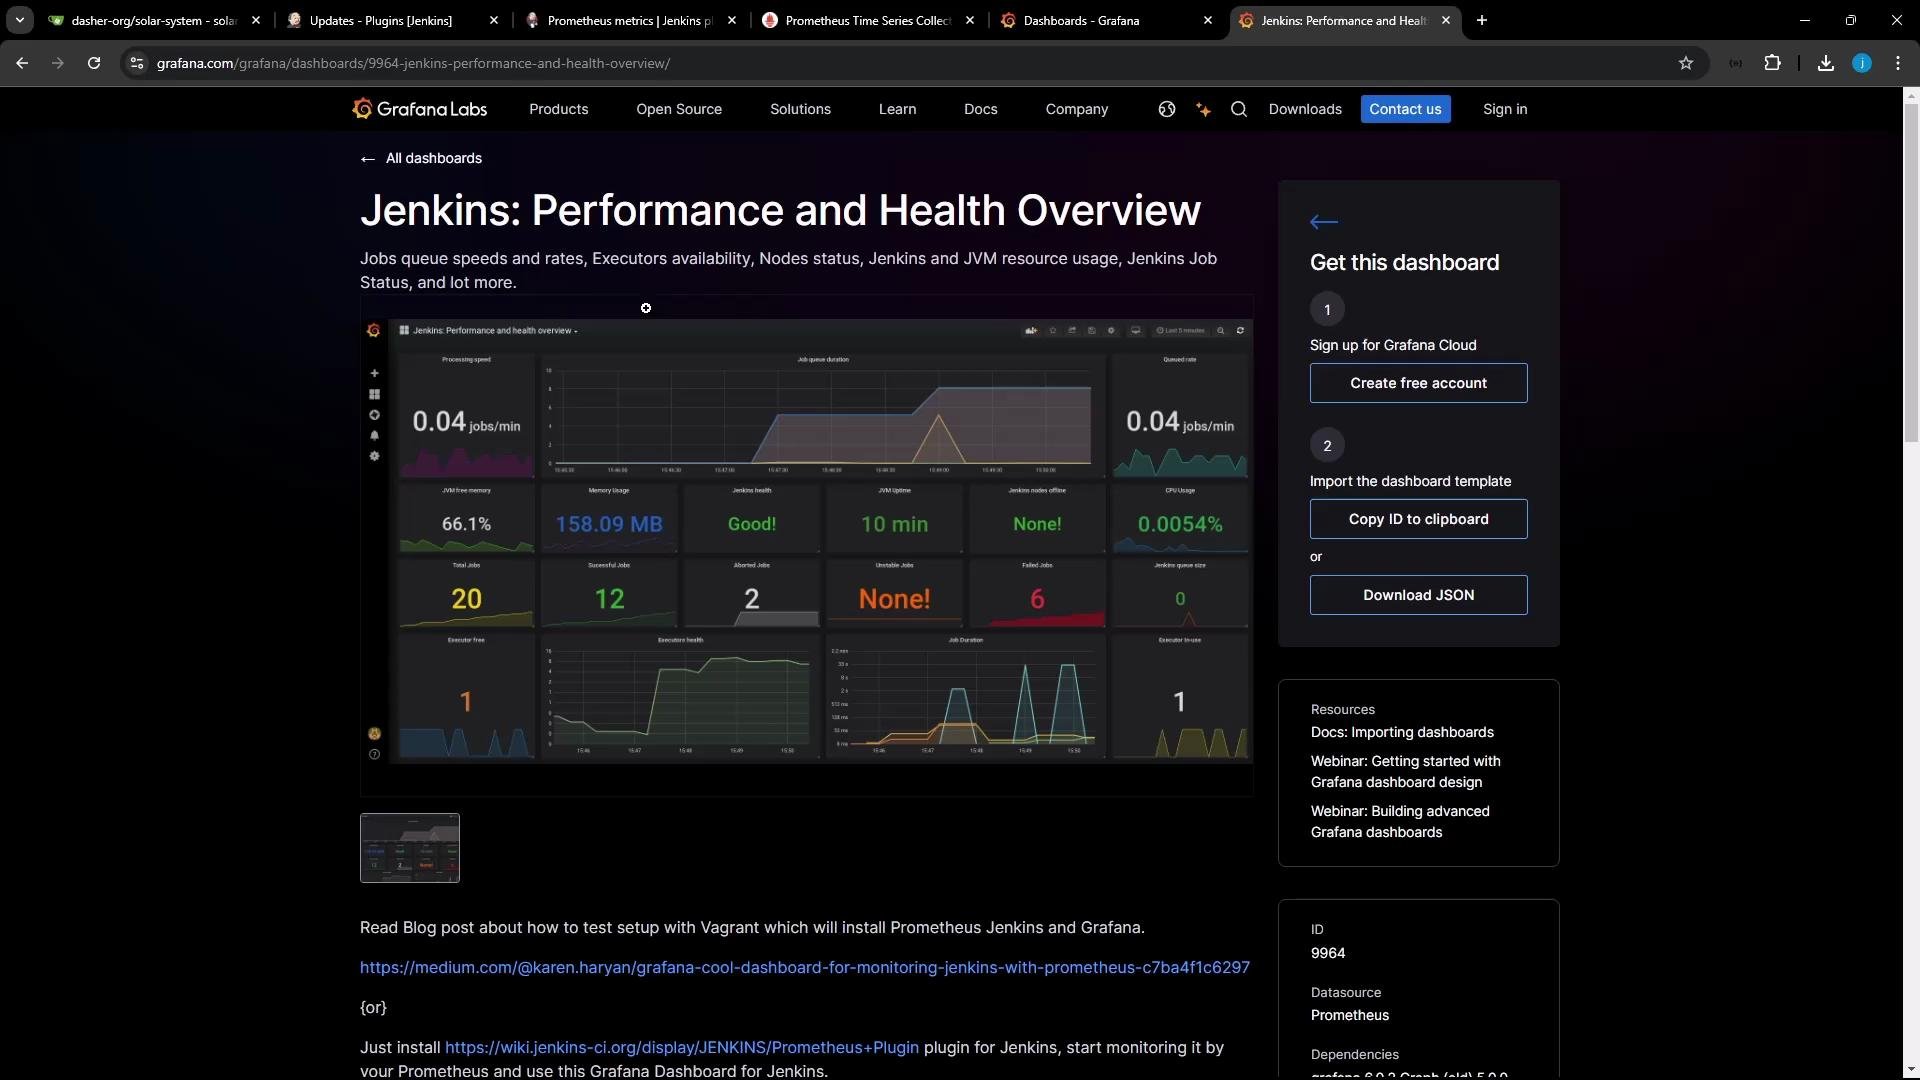
- Enter dashboard ID
9964, select a name and folder, and map the panels to your Prometheus data source
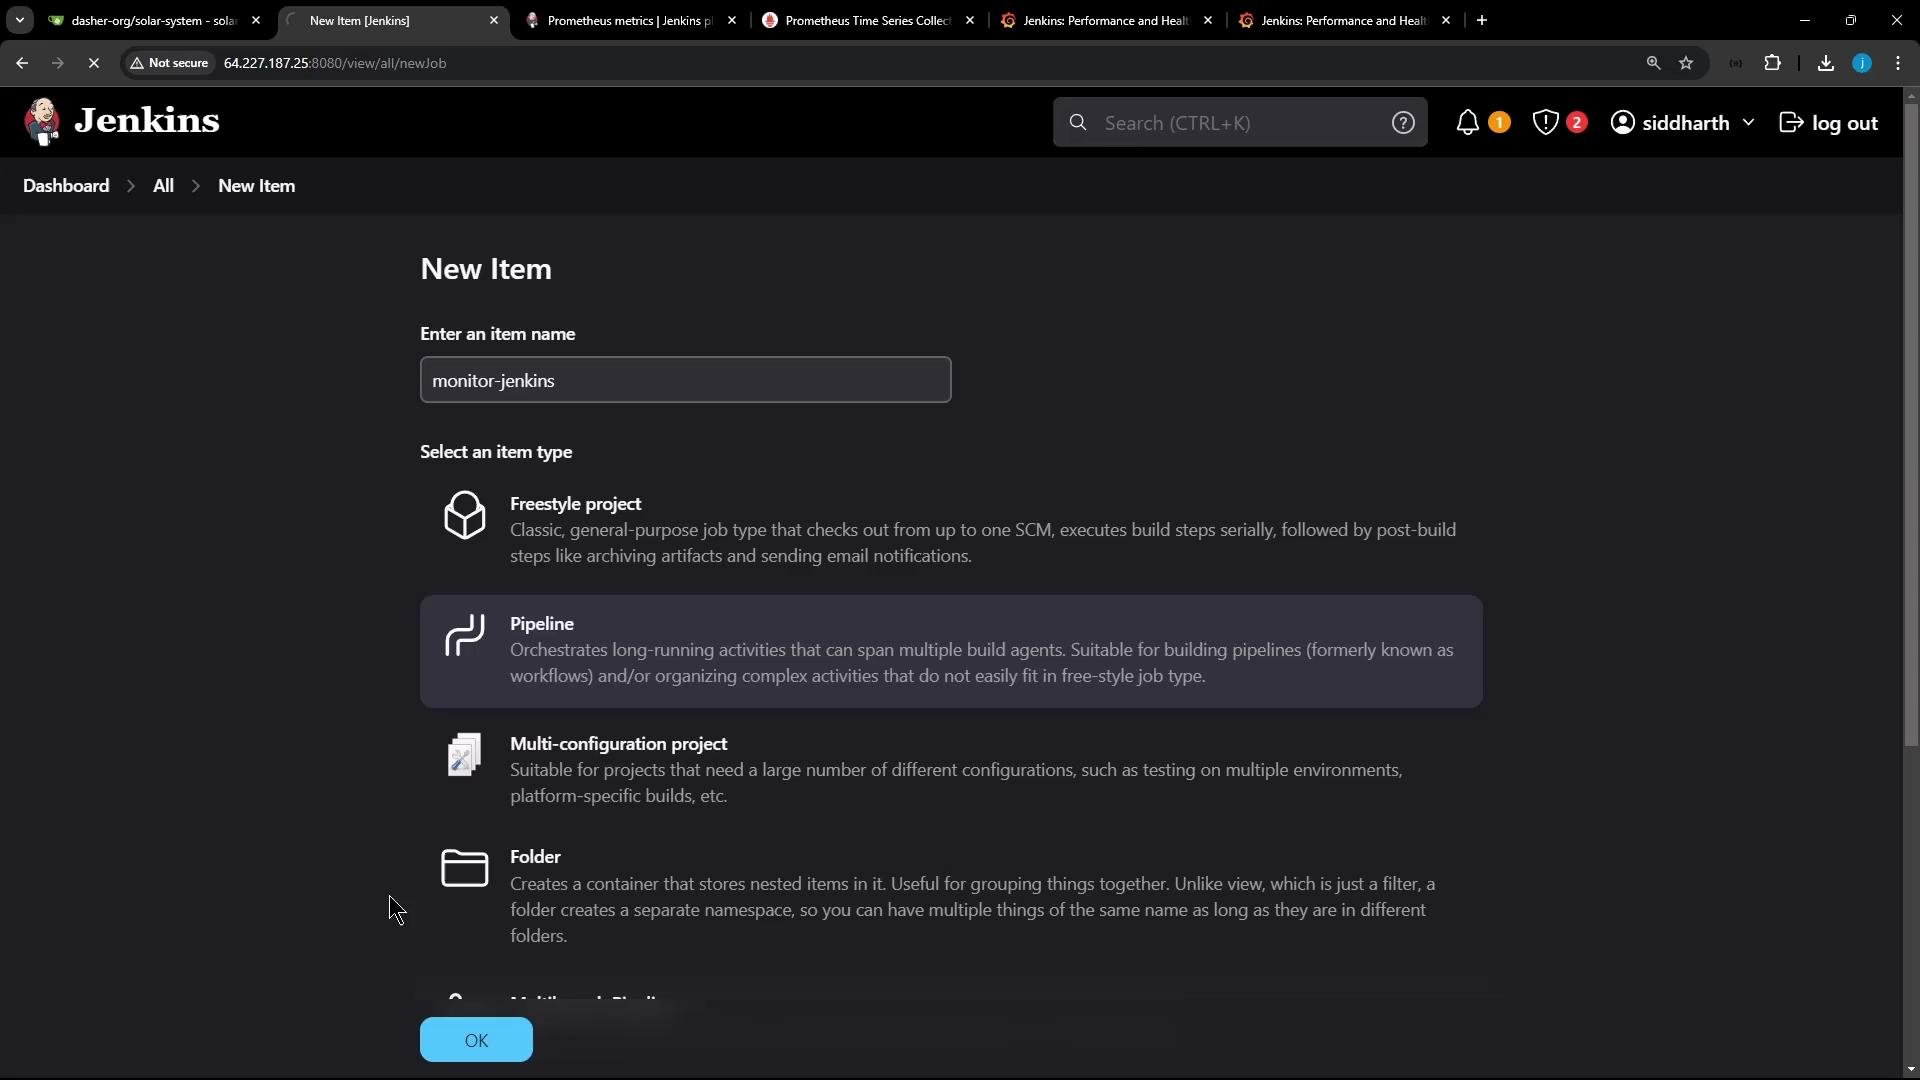
- Create a new Pipeline job (e.g.,
monitor-jenkins). - Use an inline Pipeline script like:
- Jenkins Prometheus metrics plugin — plugin page (Manage Plugins in Jenkins)
- Prometheus exposition formats — https://prometheus.io/docs/instrumenting/exposition_formats/
- Prometheus documentation — https://prometheus.io/docs/
- Grafana dashboards search — https://grafana.com/grafana/dashboards
- Example dashboard: Jenkins: Performance and Health Overview (ID 9964) — https://grafana.com/grafana/dashboards/9964
- Expose Jenkins metrics via the Prometheus plugin at
/prometheus - Configure Prometheus to scrape Jenkins metrics
- Run Prometheus and Grafana with Docker Compose
- Add Prometheus as a Grafana data source and import a Jenkins dashboard
- Generate Jenkins activity to validate the metrics and dashboards