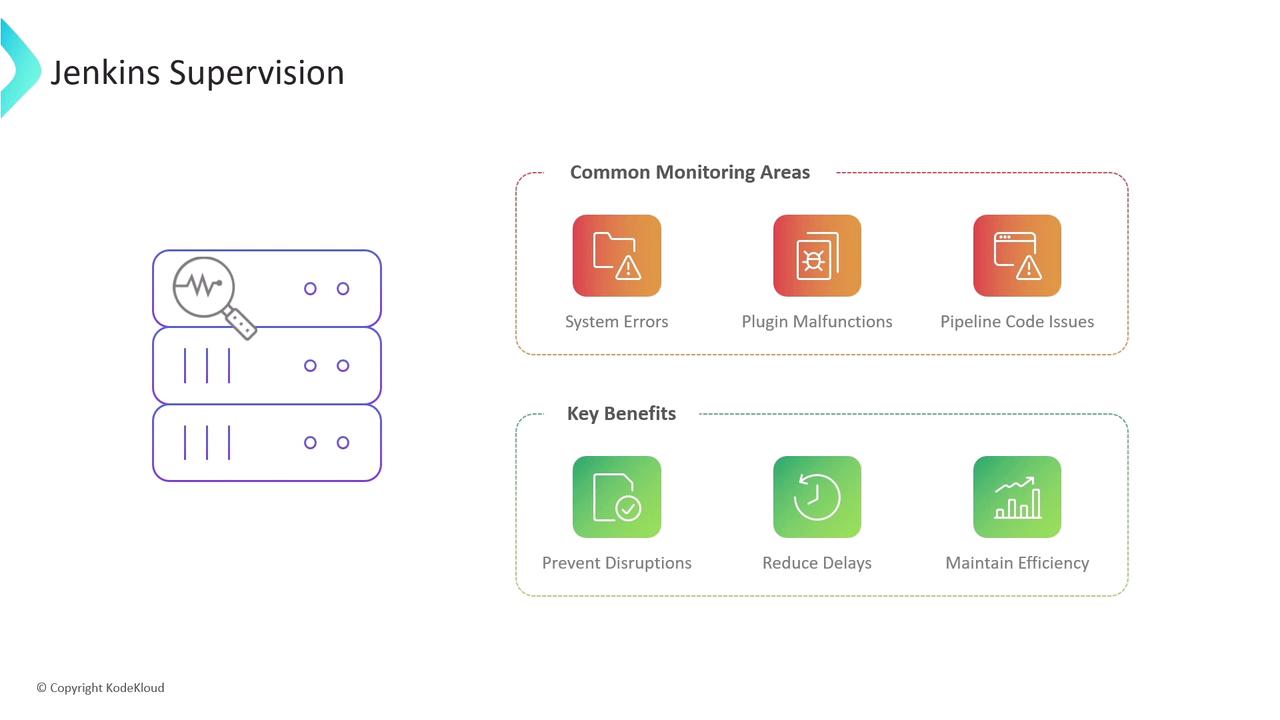
Effective CI/CD workflows depend on proactive Jenkins supervision. By monitoring your Jenkins server, you can catch system errors, plugin failures, or pipeline issues before they impact your testing and deployments.Documentation Index
Fetch the complete documentation index at: https://notes.kodekloud.com/llms.txt
Use this file to discover all available pages before exploring further.
- Logs and their insights
- Performance and resource monitoring
- Auditing user activity and configuration changes
1. Logs: The Foundation of Jenkins Insights
Jenkins logs reveal crucial details about server operations and pipeline executions. Depending on your setup, log locations vary:Rotate and compress your logs regularly to prevent disk overload. Adjust the
maxFileSize and maxBackupIndex settings in your logging configuration.2. Performance and Resource Monitoring
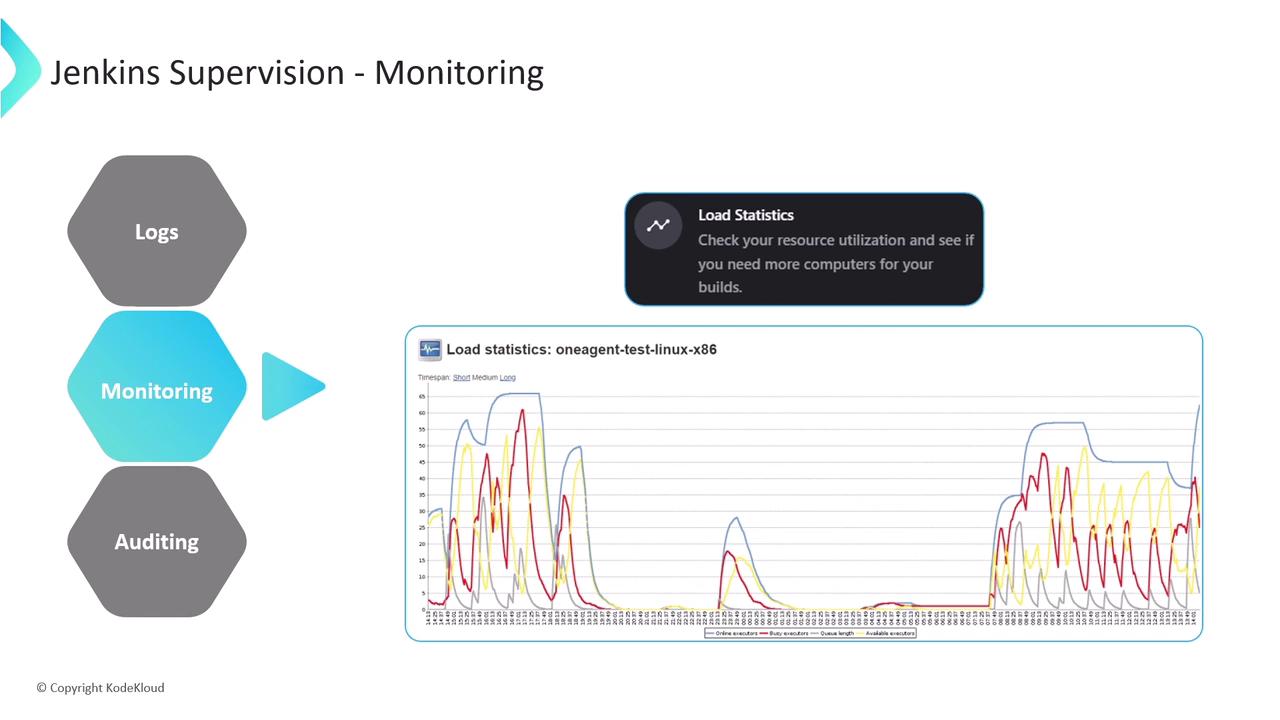
Jenkins offers built-in dashboards to track server health:- Available executors: Idle workers ready for builds
- Busy executors: Currently running jobs
- Pending jobs: Queued builds
- Overall server load: Aggregate workload metric
Key Plugins for Jenkins Monitoring
| Plugin | Purpose | Major Features |
|---|---|---|
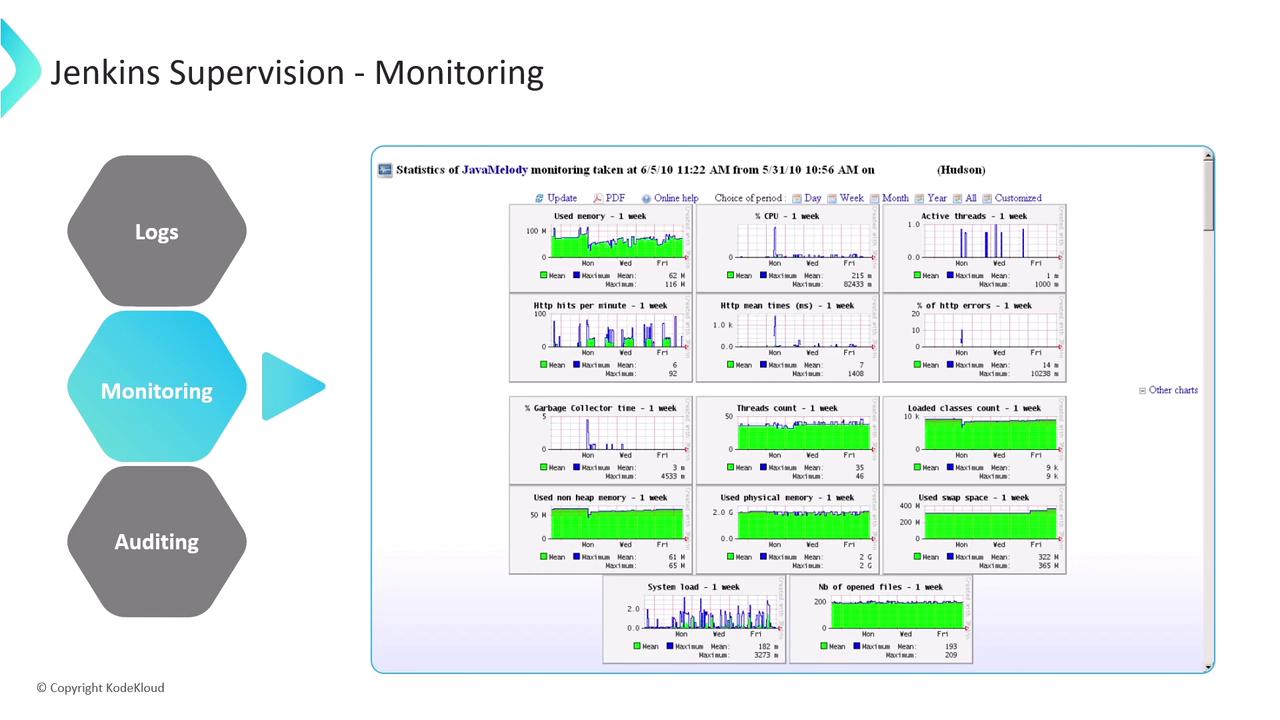
| Monitoring Plugin | JVM & system metrics | CPU, memory, load, response times, HTTP sessions, GC details |
| Disk Usage Plugin | Disk space analysis | Job/workspace usage breakdown, historical trends |
| Build Monitor Plugin | Visual job status | Customizable job view, failure highlights |
Integrating with External Systems
For centralized dashboards, use: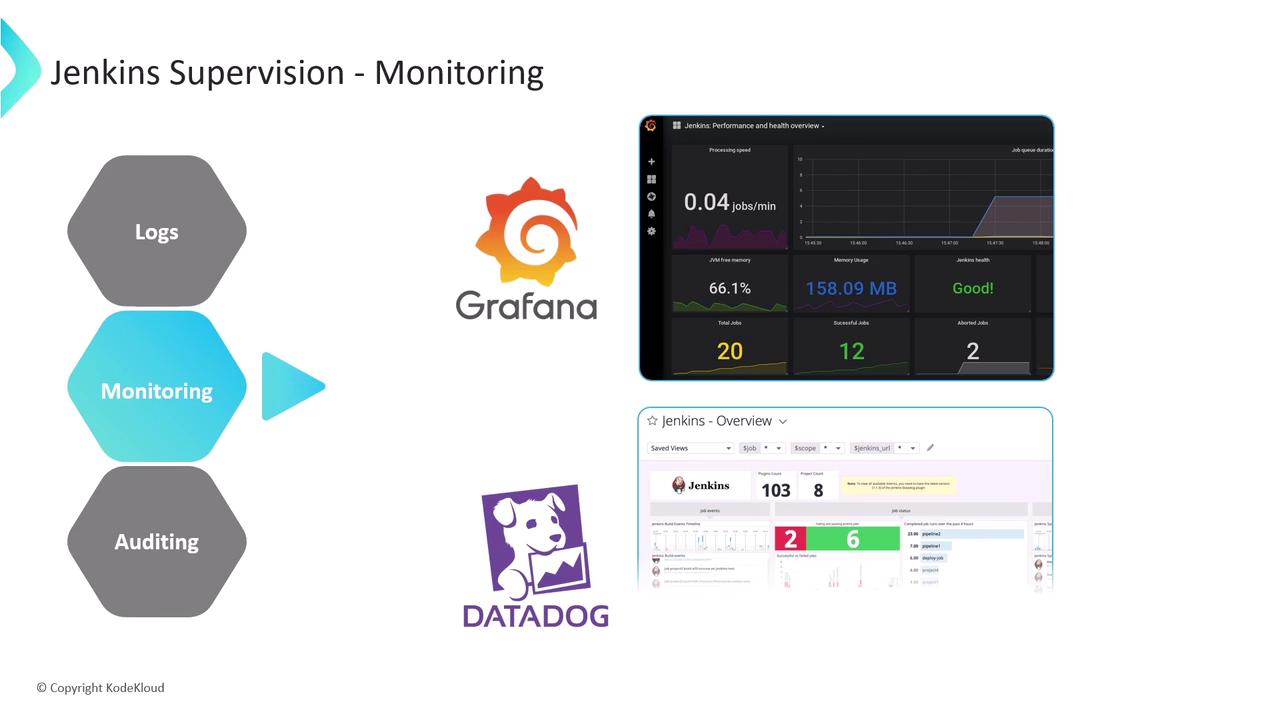
3. Auditing and Configuration Changes
Tracking who did what—and when—is vital for compliance and troubleshooting. Two complementary plugins capture user actions and config updates:| Plugin | Function | Highlights |
|---|---|---|
| Audit Trail Plugin | User action logging | File, Syslog, Elasticsearch, or Console logger options |
| Job Config History Plugin | Version control for configs | Records config.xml changes, diff view, and rollback capability |
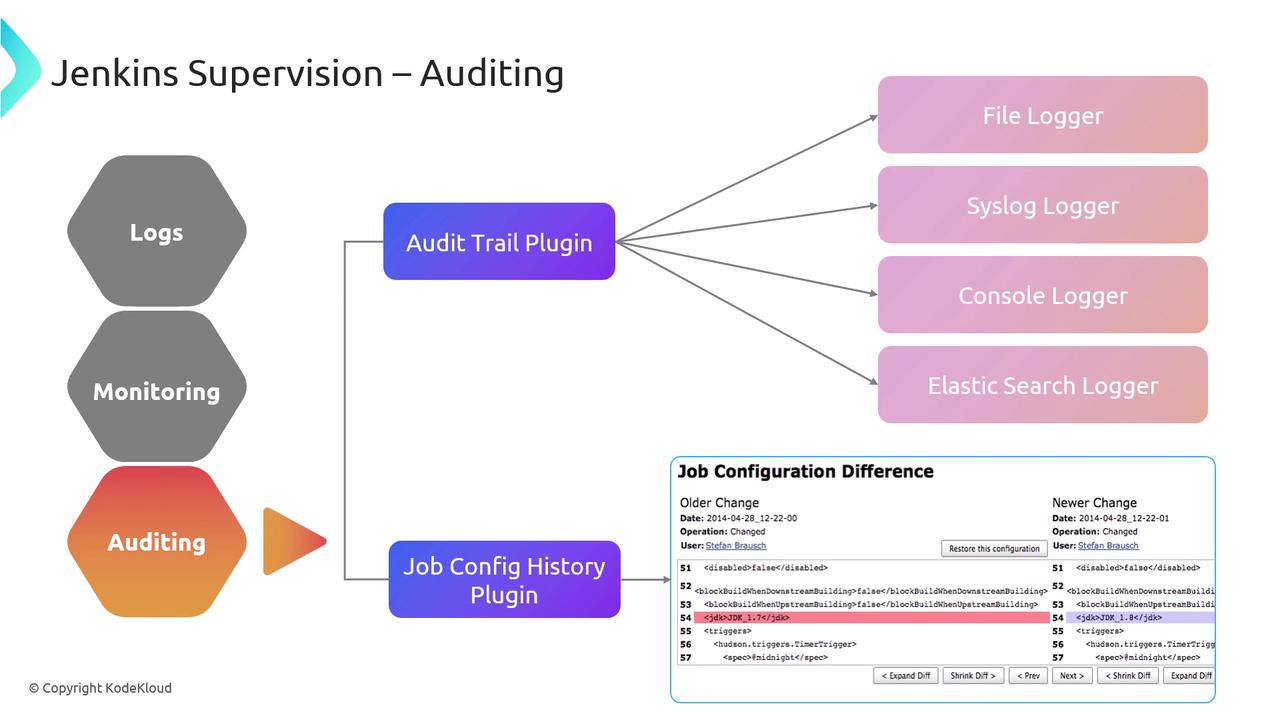
- File Logger (default, rotating files)
- Syslog Logger (central syslog server)
- Console Logger (for quick debugging)
- Elasticsearch Logger (powerful search & analytics)
Avoid using the Console Logger in production—it can expose sensitive data in build logs.
References
- Monitoring Plugin
- Disk Usage Plugin
- Build Monitor Plugin
- Datadog Plugin
- New Relic Plugin
- Prometheus Plugin
- Grafana
- Audit Trail Plugin
- Job Config History Plugin