

1. Business goal identification
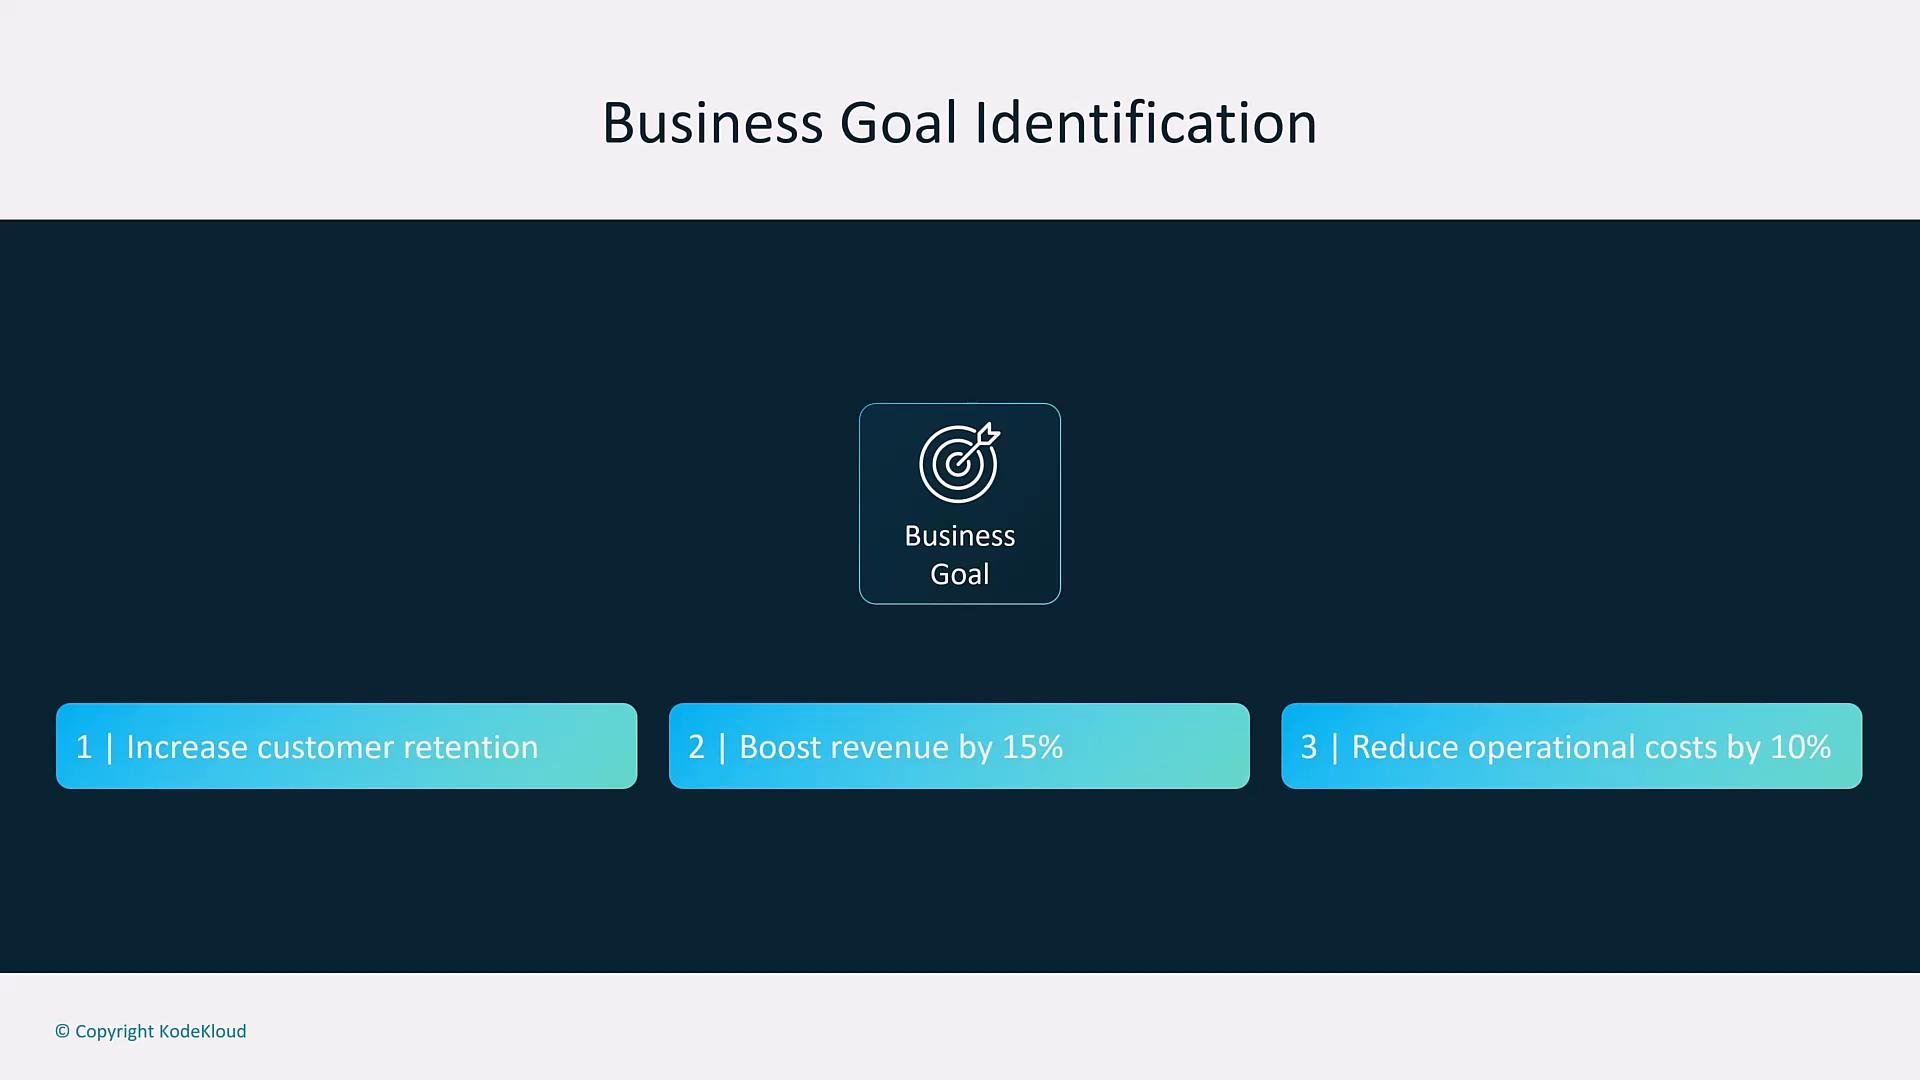
Every ML initiative must start with a clearly defined business objective and measurable success criteria. Examples:- Increase customer retention by X% within Y months.
- Improve revenue per user or lifetime value.
- Reduce operational costs or incident response time by a target amount.
2. Data collection and preparation
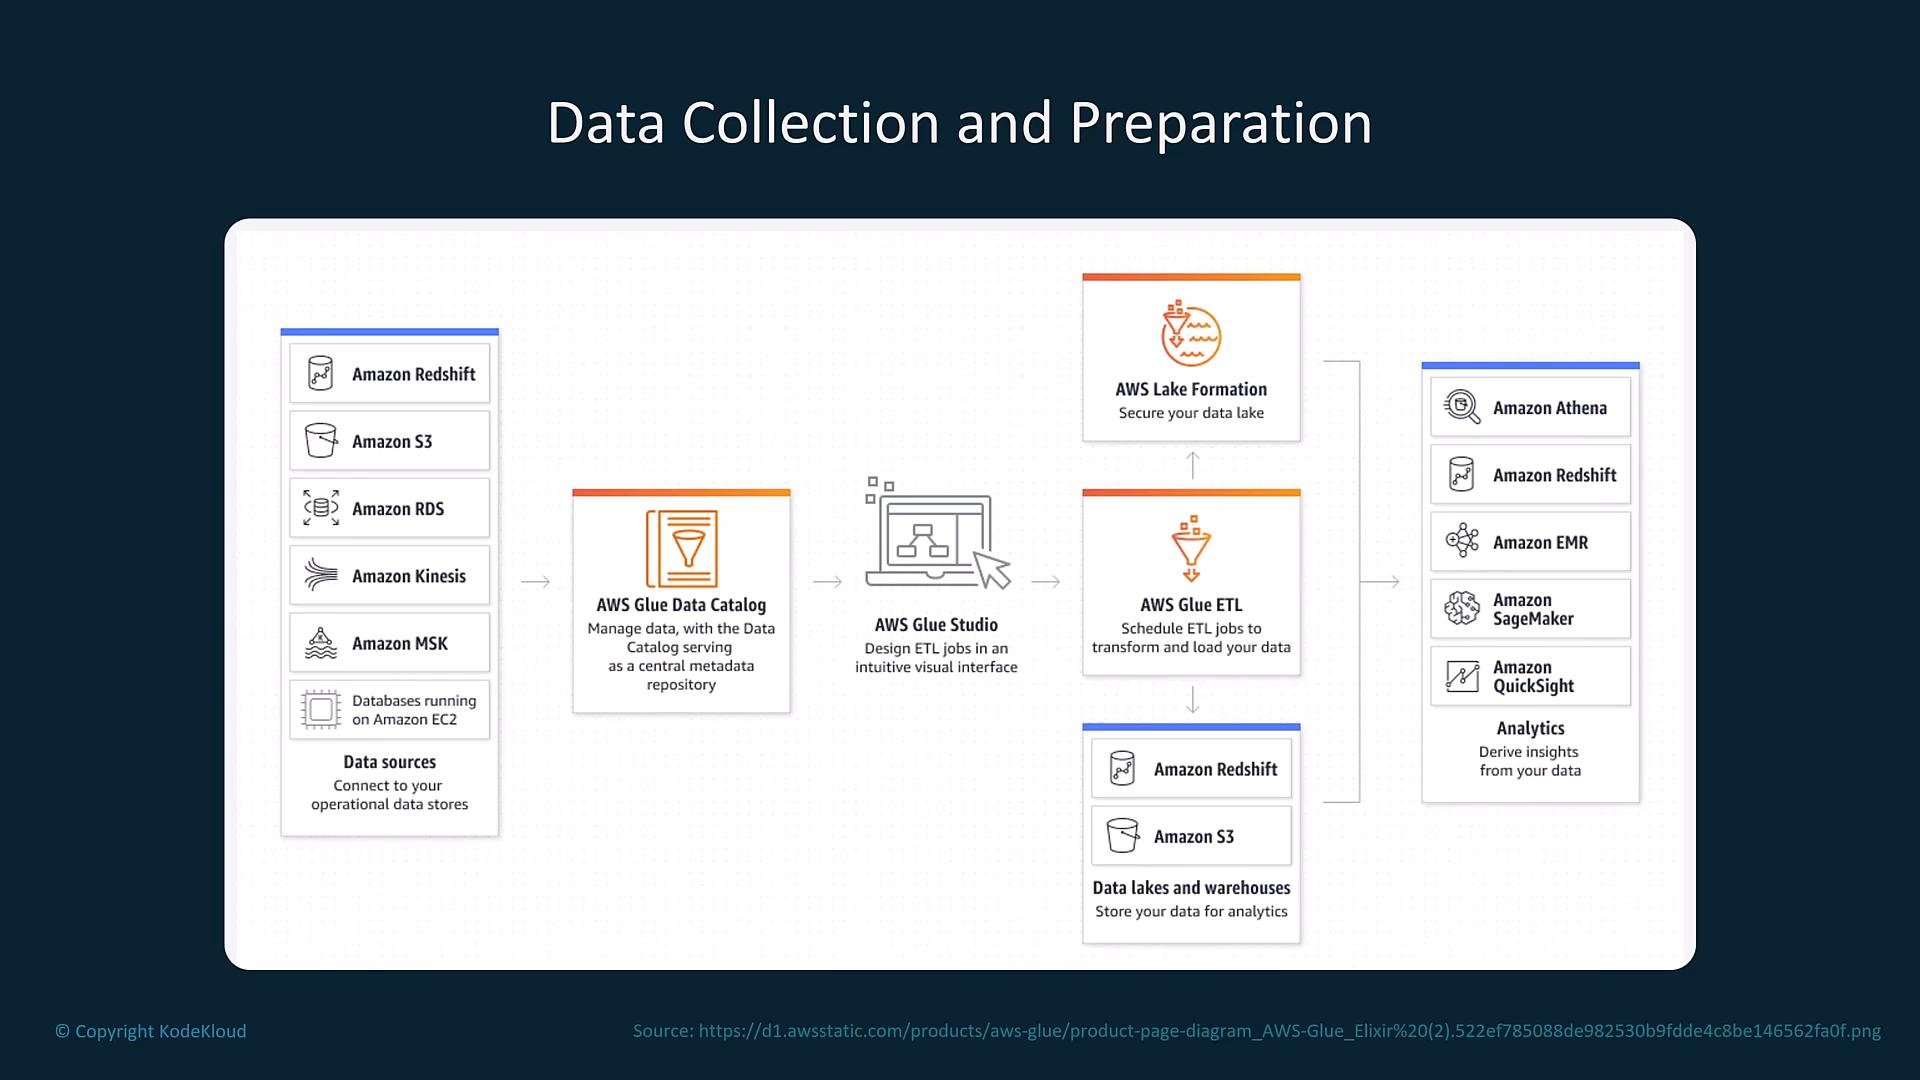
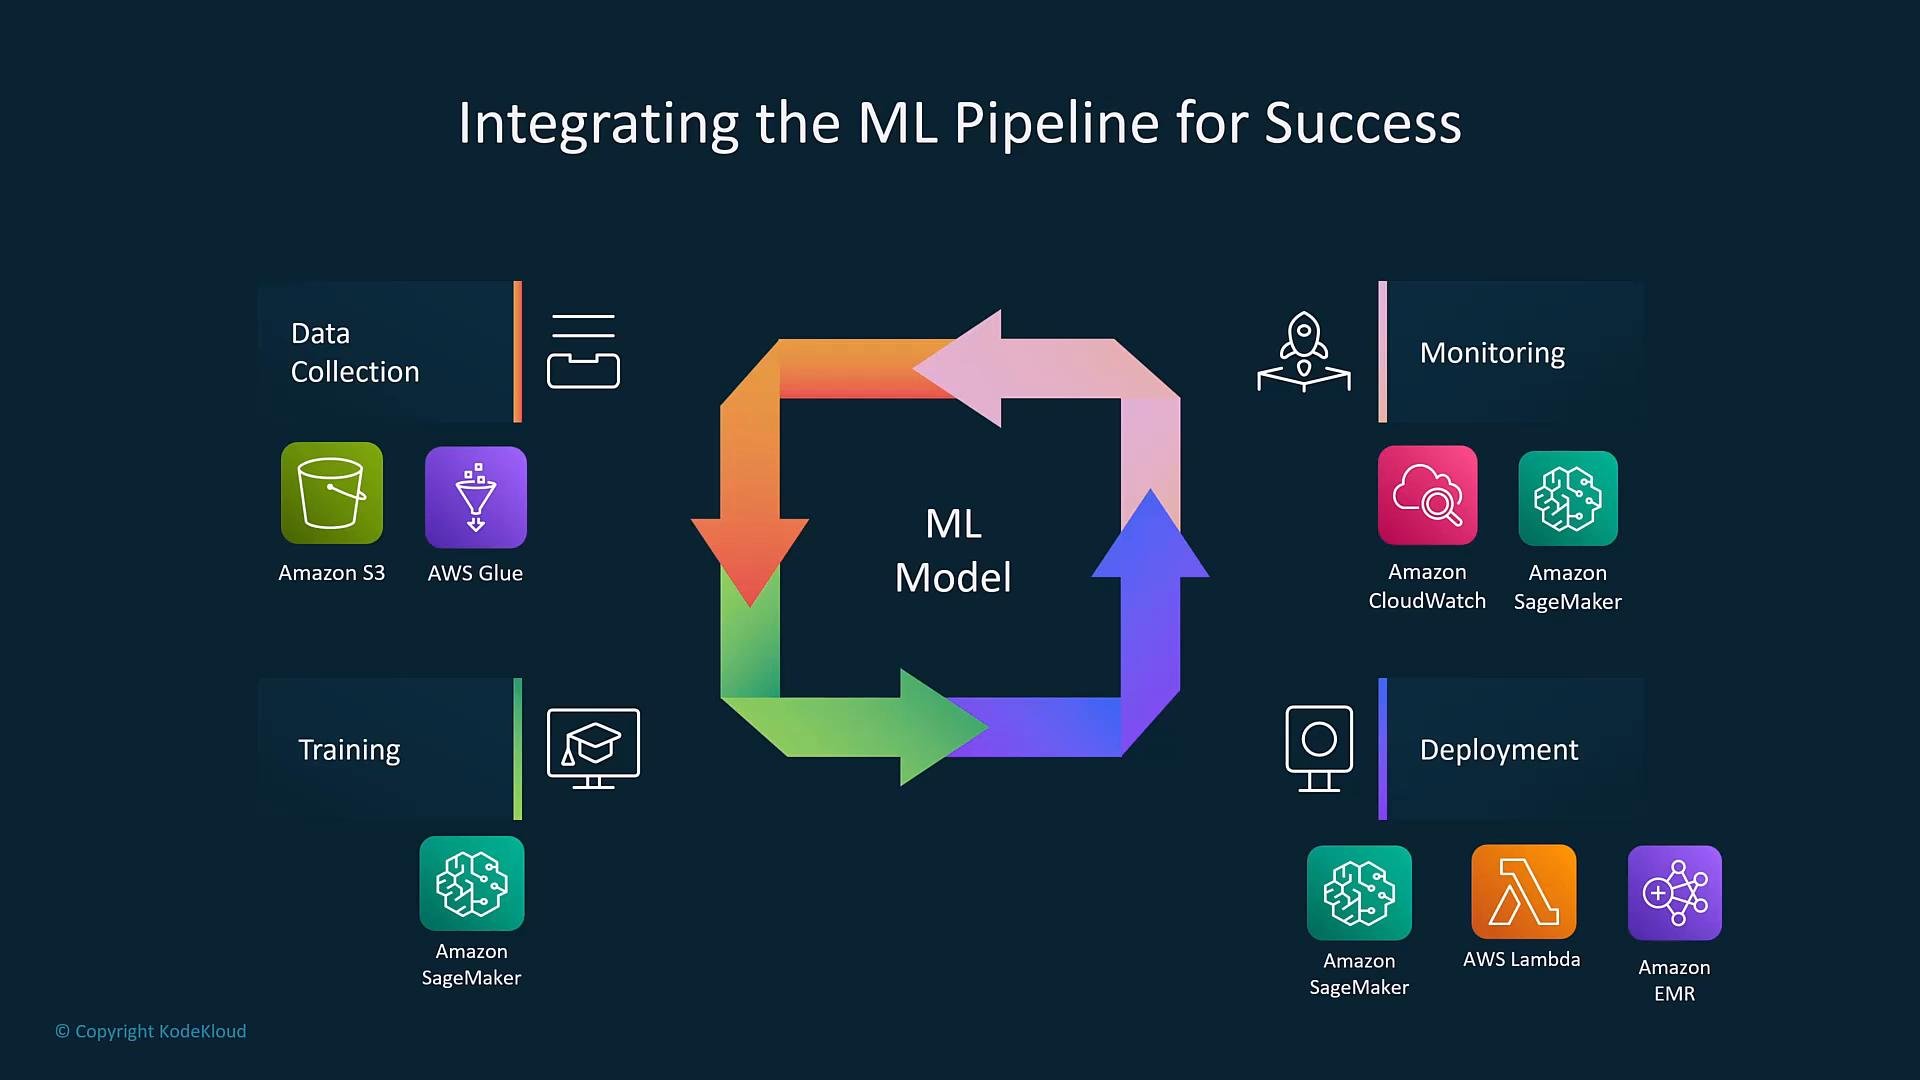
Identify sources needed to meet your business objective and design an ingestion pipeline. Common AWS data sources and storage patterns include:- Object storage: Amazon S3 (central artifact store for raw and processed data).
- Relational databases: Amazon RDS.
- Data warehouses: Amazon Redshift.
- Streaming sources: Amazon Kinesis, Amazon MSK.
- Compute hosts and batch jobs: EC2, EMR.
Design your data contracts and schema early. Consistent schemas and metadata (via a data catalog) reduce downstream surprises when training or deploying models.
- Use S3 as the single source of truth for artifacts (features, training data, model artifacts).
- Use AWS Glue and Lake Formation for cataloging and governing datasets.
- Stream or batch ingest based on latency requirements; use AWS Lambda for serverless stream processing when appropriate.
Data preprocessing and feature engineering
Preprocessing turns raw data into features suitable for model consumption:- Impute missing values (mean/median or model-based).
- Normalize/scale numeric features.
- Encode categorical variables.
- Detect and remove outliers or anomalies.
- Create derived features (feature crosses, embeddings).
- Reduce dimensionality or downsample for efficiency.
- SageMaker notebooks and Processing jobs for medium-scale tasks.
- Managed ETL: AWS Glue for schema discovery and batch transforms.
- Big-data frameworks (Spark on EMR) for large-scale feature pipelines.
Data augmentation
When datasets are limited or class-imbalanced, augment data to improve generalization. Examples:- Image transforms: flip, rotate, crop, color jitter.
- Text augmentation: synonym replacement, back-translation.
- Synthetic data generation for rare events.
Train / validation / test split
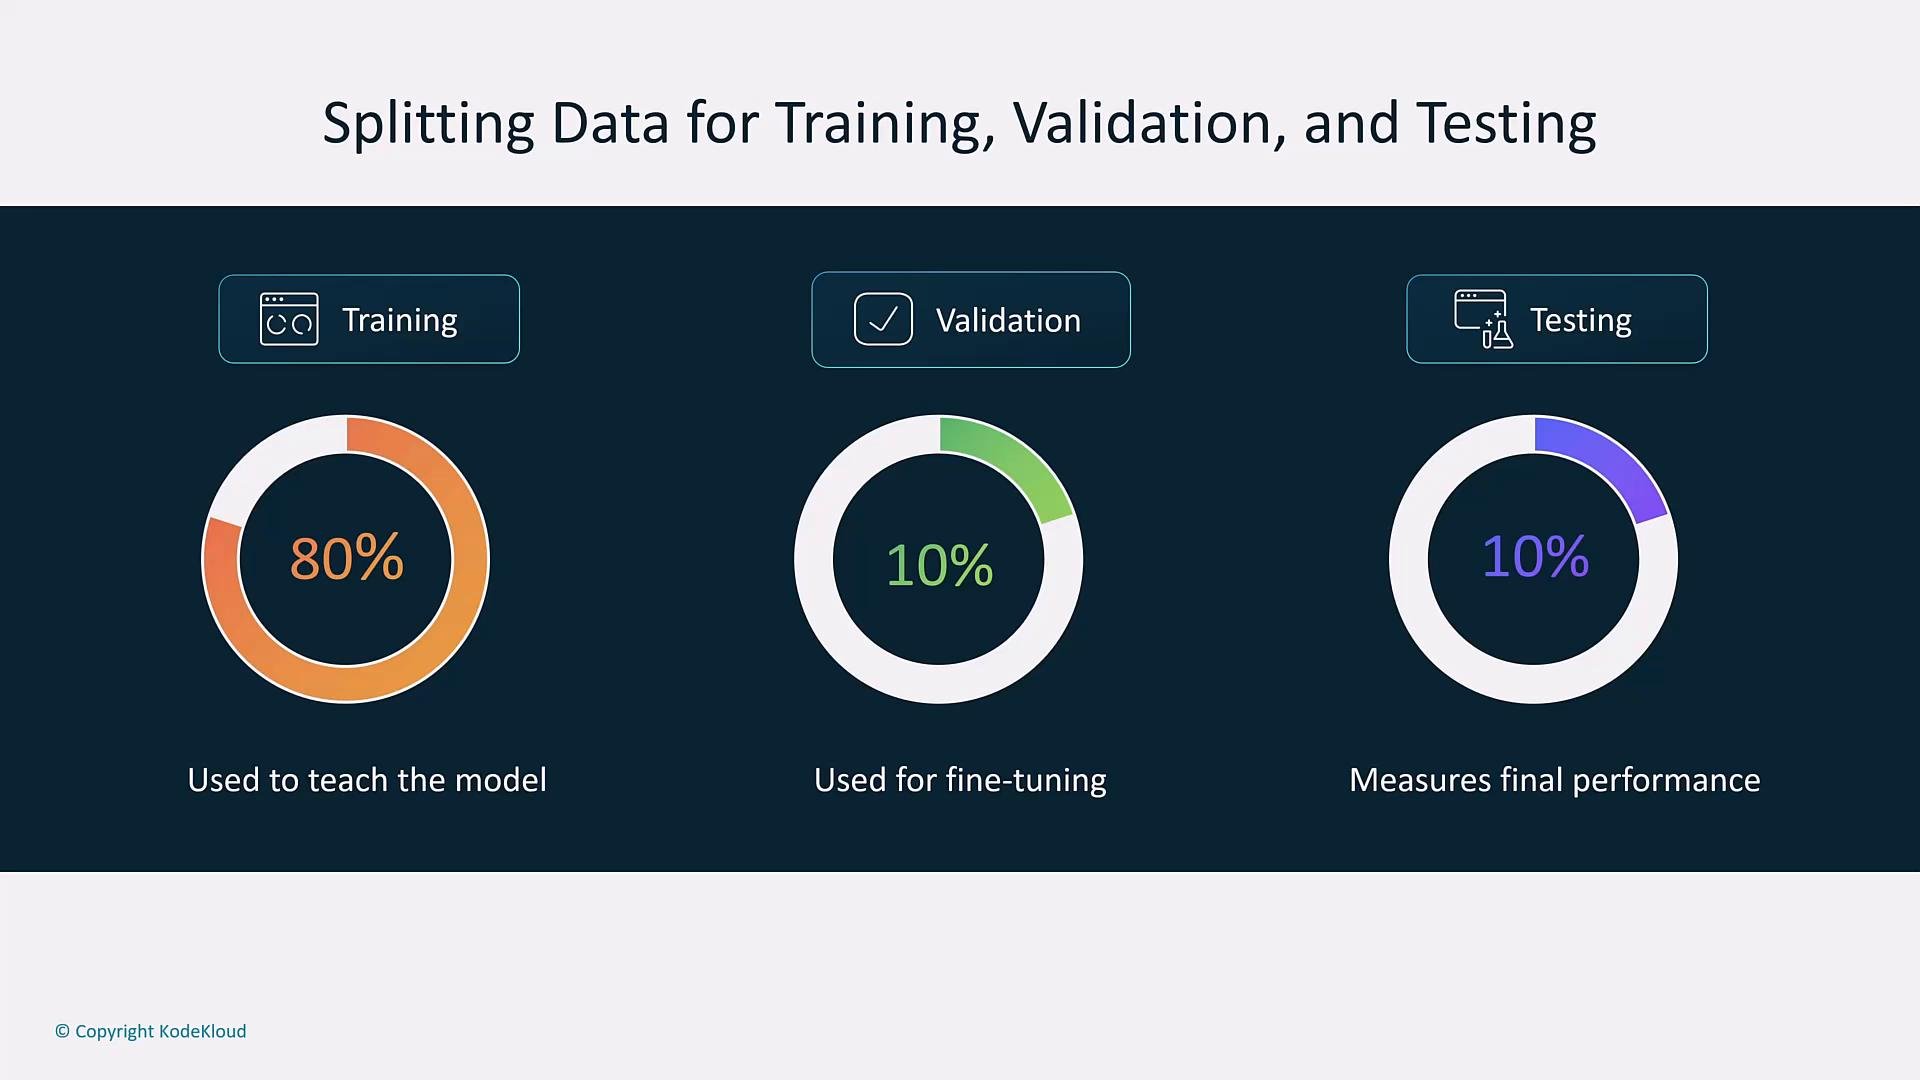
Recommended practice: split your dataset to prevent overfitting and to produce reliable performance estimates. Common splits:80/10/10, 70/20/10, or time-based splits for temporal data.
- Training: bulk of data used to fit model parameters.
- Validation: tune hyperparameters and detect overfitting during training.
- Test: final unbiased evaluation before deployment.
3. Model training
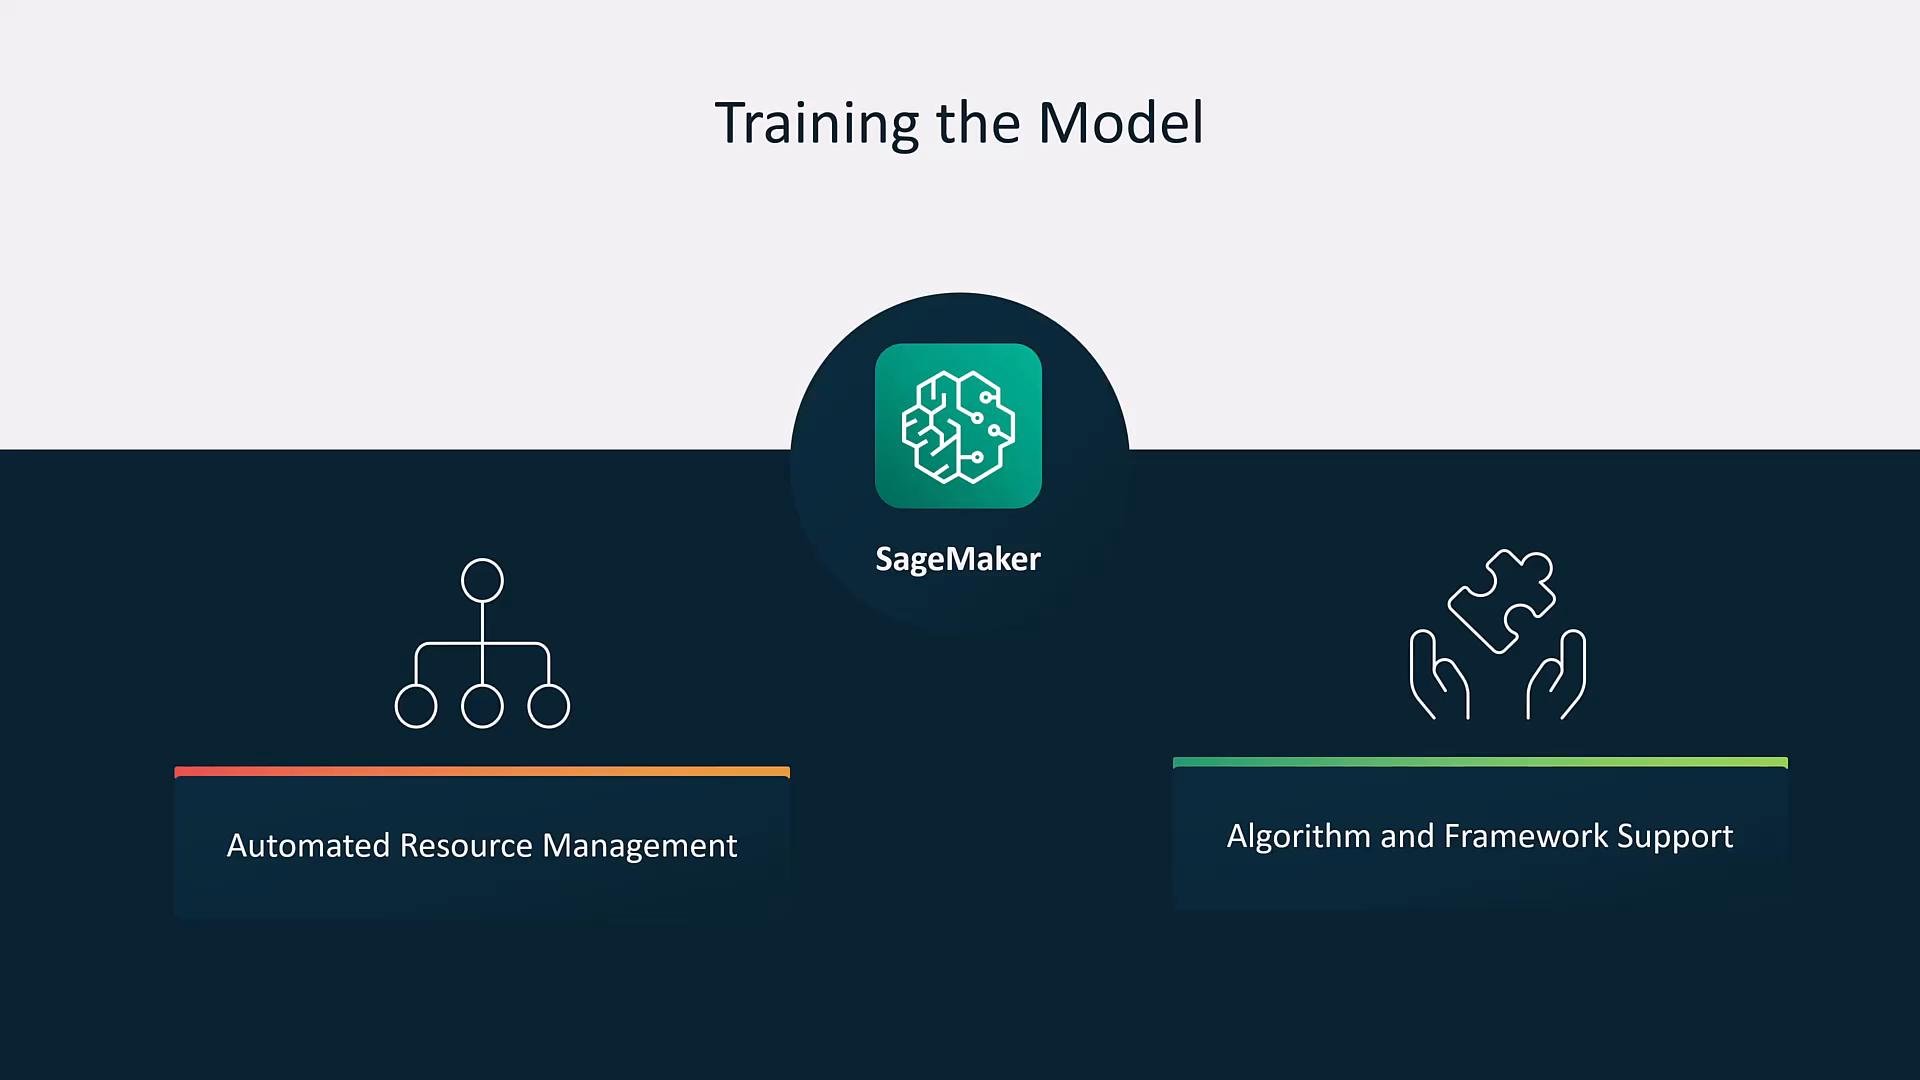
Training optimizes model parameters (weights) to minimize an objective function on training data. Training can be iterative, distributed, and resource-intensive. Amazon SageMaker provides:- Managed training jobs with automatic provisioning of compute (CPU/GPU).
- Built-in algorithms and prebuilt containers for TensorFlow, PyTorch, XGBoost, scikit‑learn.
- SageMaker Processing and Studio for experiment-driven development.
- Automatic Model Tuning for hyperparameter search across multiple jobs.
4. Evaluating model performance
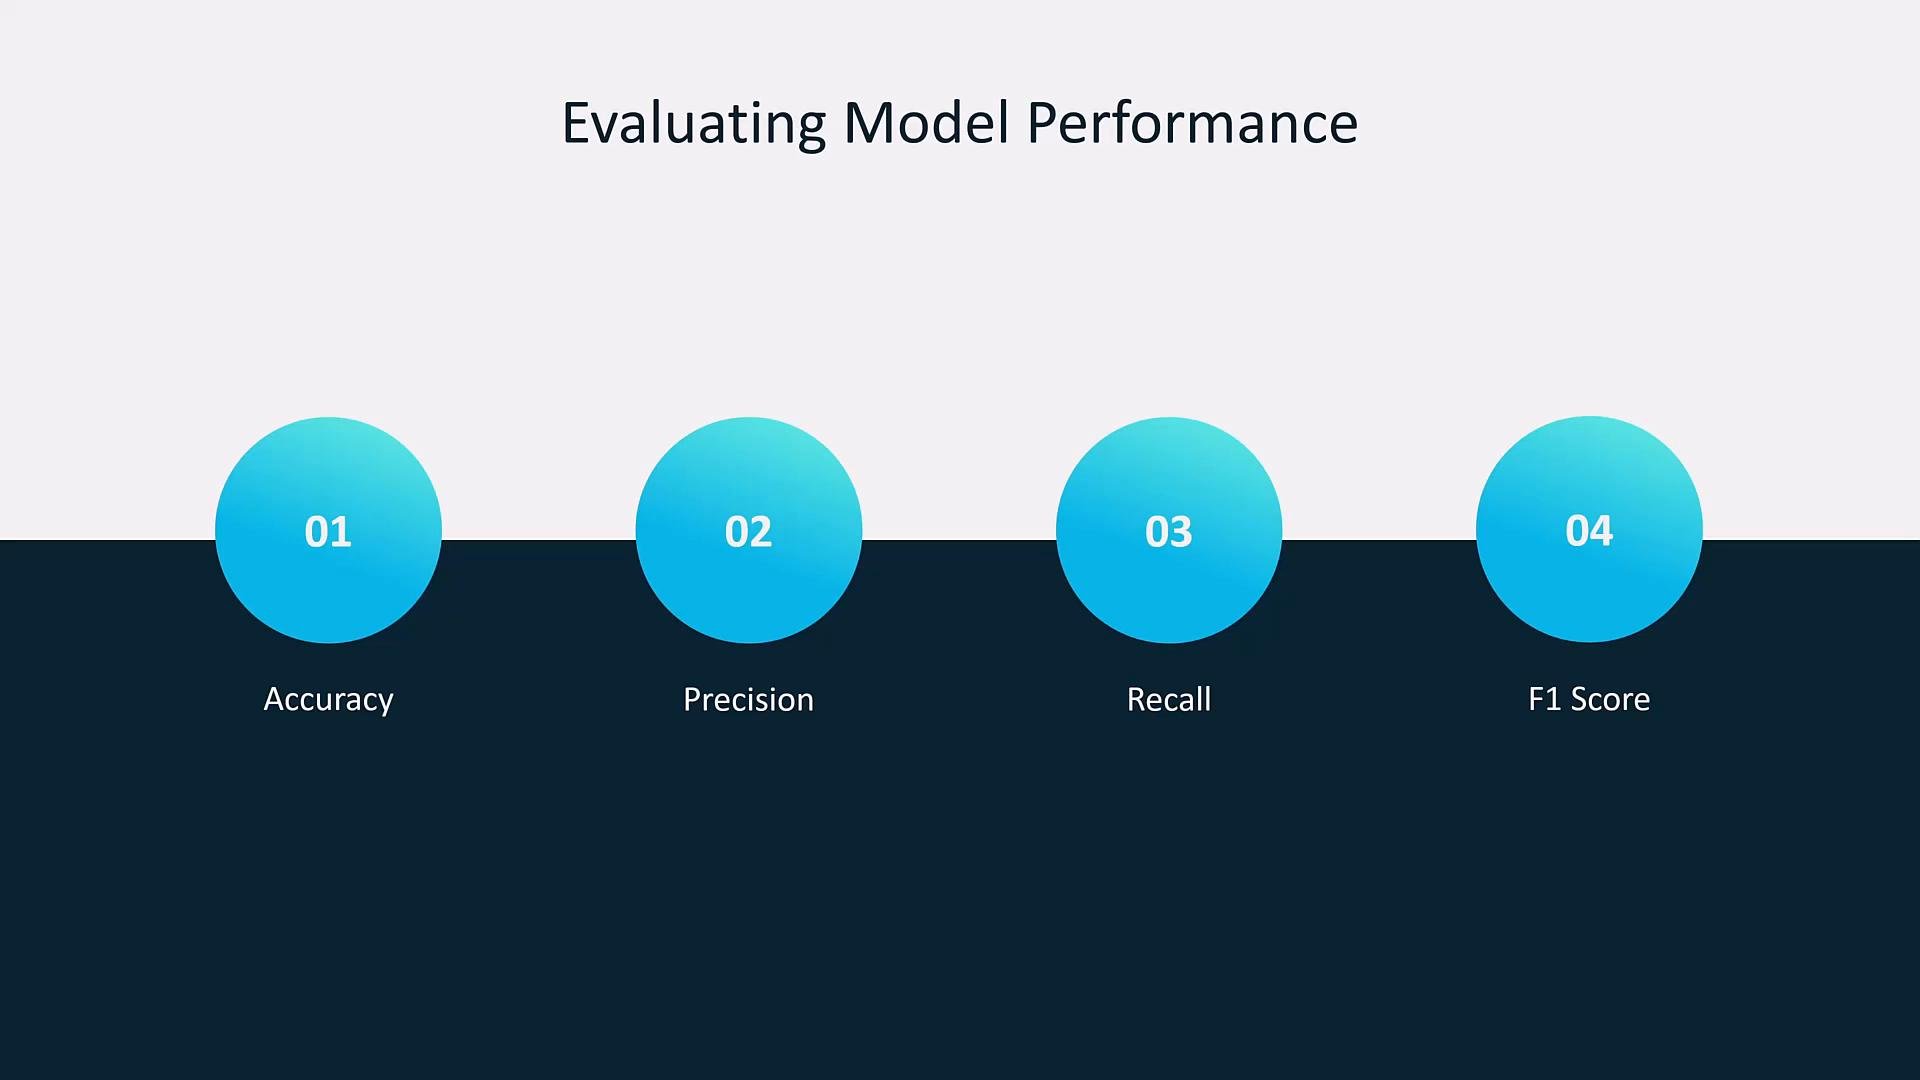
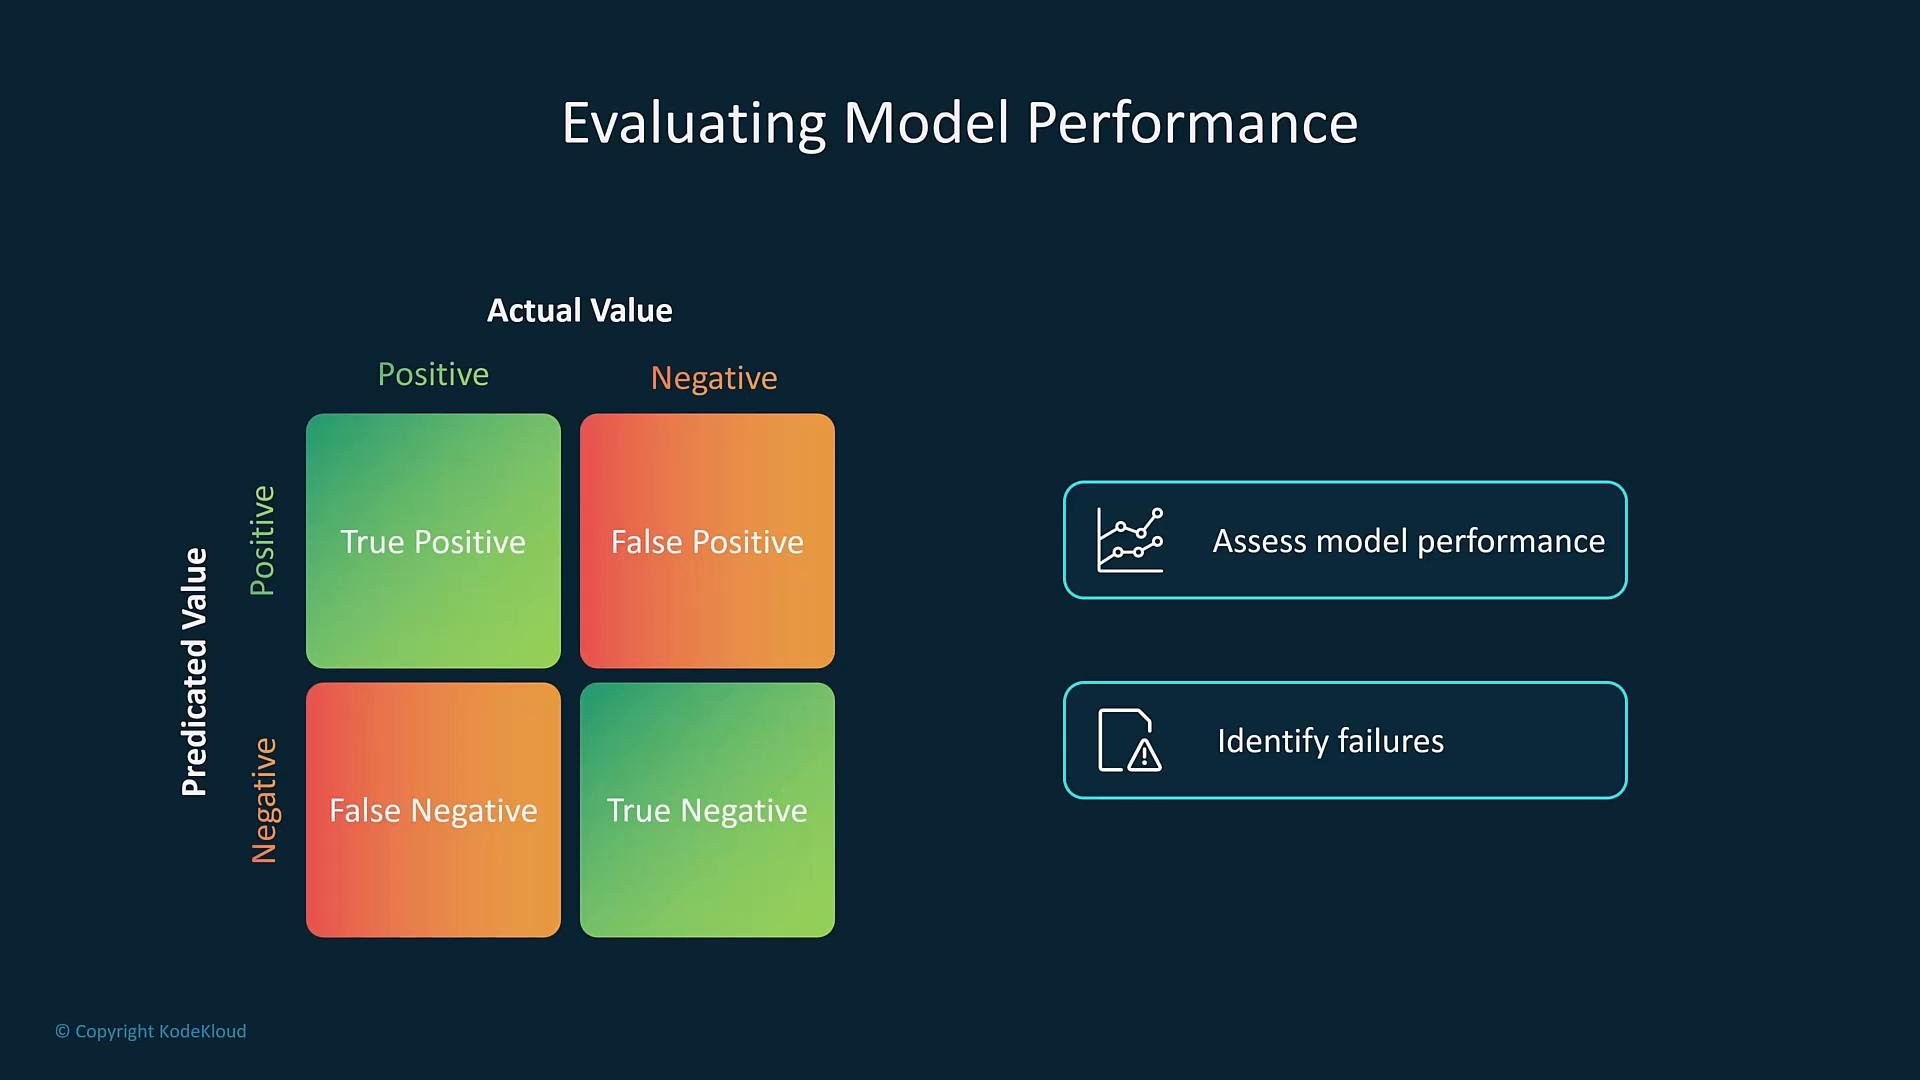
Evaluation is ongoing during training (validation) and finalized on the test set. Choose metrics aligned with business goals—classification, regression, ranking, or forecasting all require different metrics. Common metrics:- Classification: Accuracy, Precision, Recall, F1 score, ROC-AUC.
- Regression: MAE, MSE, RMSE.
- Ranking/Recommendation: MAP, NDCG.
5. Model deployment
Deployment patterns depend on latency, throughput, and cost constraints. Typical options:
For most production ML workflows on AWS, SageMaker hosted endpoints (for online) and SageMaker Batch Transform (for offline) are common choices. Containerization enables portability between SageMaker, ECS, EKS, or self-managed clusters.
6. Monitoring and continuous improvement
Post-deployment monitoring ensures models continue to meet SLAs and business KPIs. Watch for:- Data drift: input feature distributions change.
- Concept drift: relationship between inputs and labels changes.
- Model performance degradation: increasing error rates or latency spikes.
- Infrastructure and resource metrics: CPU, memory, latency, error rates.
- SageMaker Model Monitor: detect feature and prediction drift and generate alerts.
- Amazon CloudWatch: logs, custom metrics, and alarms for infra and app-level signals.
- Automated retraining pipelines: schedule or trigger retraining based on thresholds or new labeled data.
Monitor for data and concept drift continuously. Unnoticed drift can silently degrade business outcomes and introduce compliance risks.
Summary and recommended AWS components
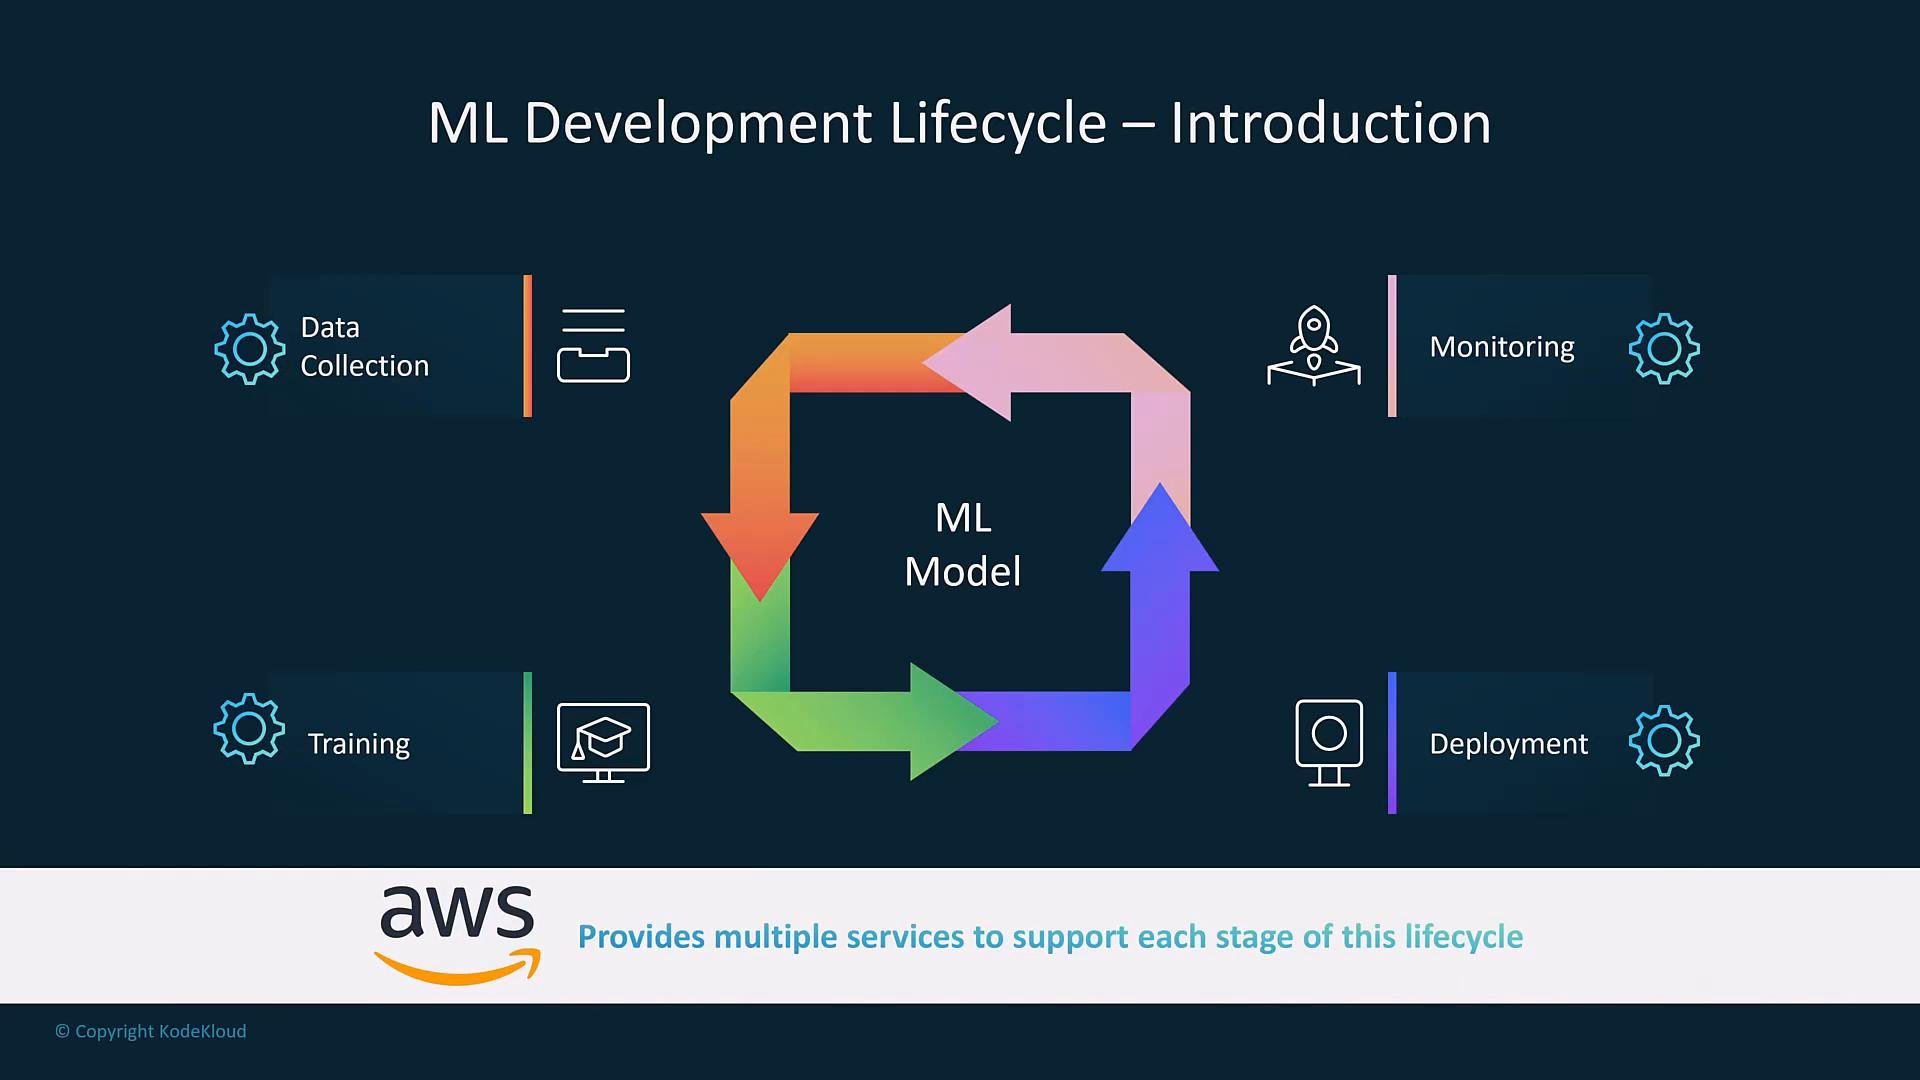
The ML lifecycle is an iterative loop of discovery, modeling, deployment, and improvement:- Identify the business problem and measurable objectives.
- Collect and prepare data (ingest, catalog, clean, augment).
- Train models (iterate and tune hyperparameters).
- Evaluate and validate (use business-aligned metrics and holdout test sets).
- Deploy models (real-time or batch inference; SageMaker is commonly used).
- Monitor in production and retrain as needed (SageMaker Model Monitor, CloudWatch).