Imagine a server suddenly becoming slow, users complaining that applications are unresponsive, and you don’t know why. Or imagine a single process consuming all the CPU and affecting everything else on the system. Without a solid grasp of process management and tuning, you are left guessing instead of diagnosing. This article teaches how to monitor running processes, control them, and adjust priority so the system stays stable and responsive. We’ll start with the Linux process lifecycle — how processes start, run, and terminate — then cover real-time monitoring, managing running processes and background jobs, process priority, and basic tuning. By the end you’ll be able to diagnose performance problems and apply the right controls.
A dark-themed presentation slide titled "Overview" showing bullet points about Linux process management. The list mentions understanding the process lifecycle, monitoring and managing processes and background jobs, adjusting process priority, and tuning system performance.
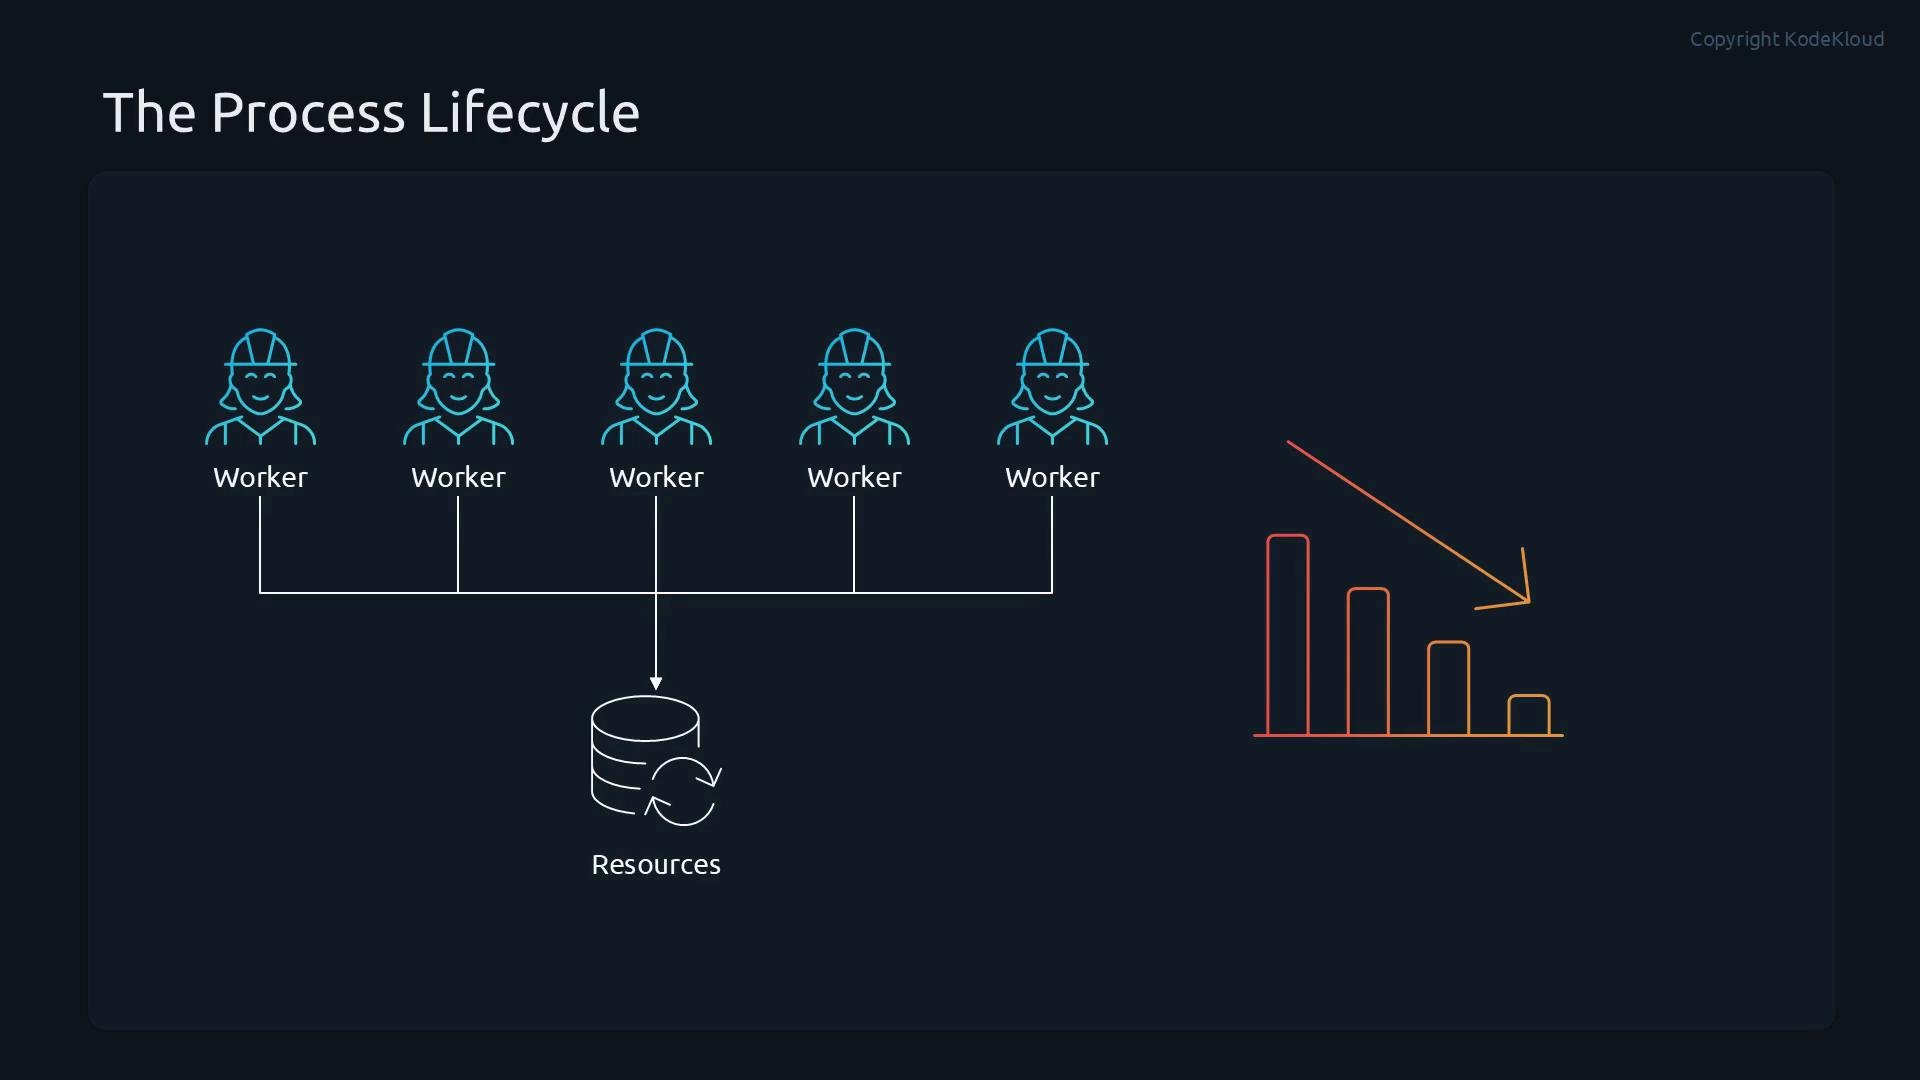
What is a process? When you run a command or program, think of it as hiring a worker to perform a task: the worker uses tools and resources, does the job, and then leaves when the task is complete. A worker may spawn assistants — child processes — to help. If too many workers use too many resources at once, overall system performance suffers.
A diagram titled "The Process Lifecycle" with five worker icons connected to a shared resources (database) symbol. An orange arrow points to a downward bar chart on the right, suggesting decreasing workload or resource usage.
Terminology recap
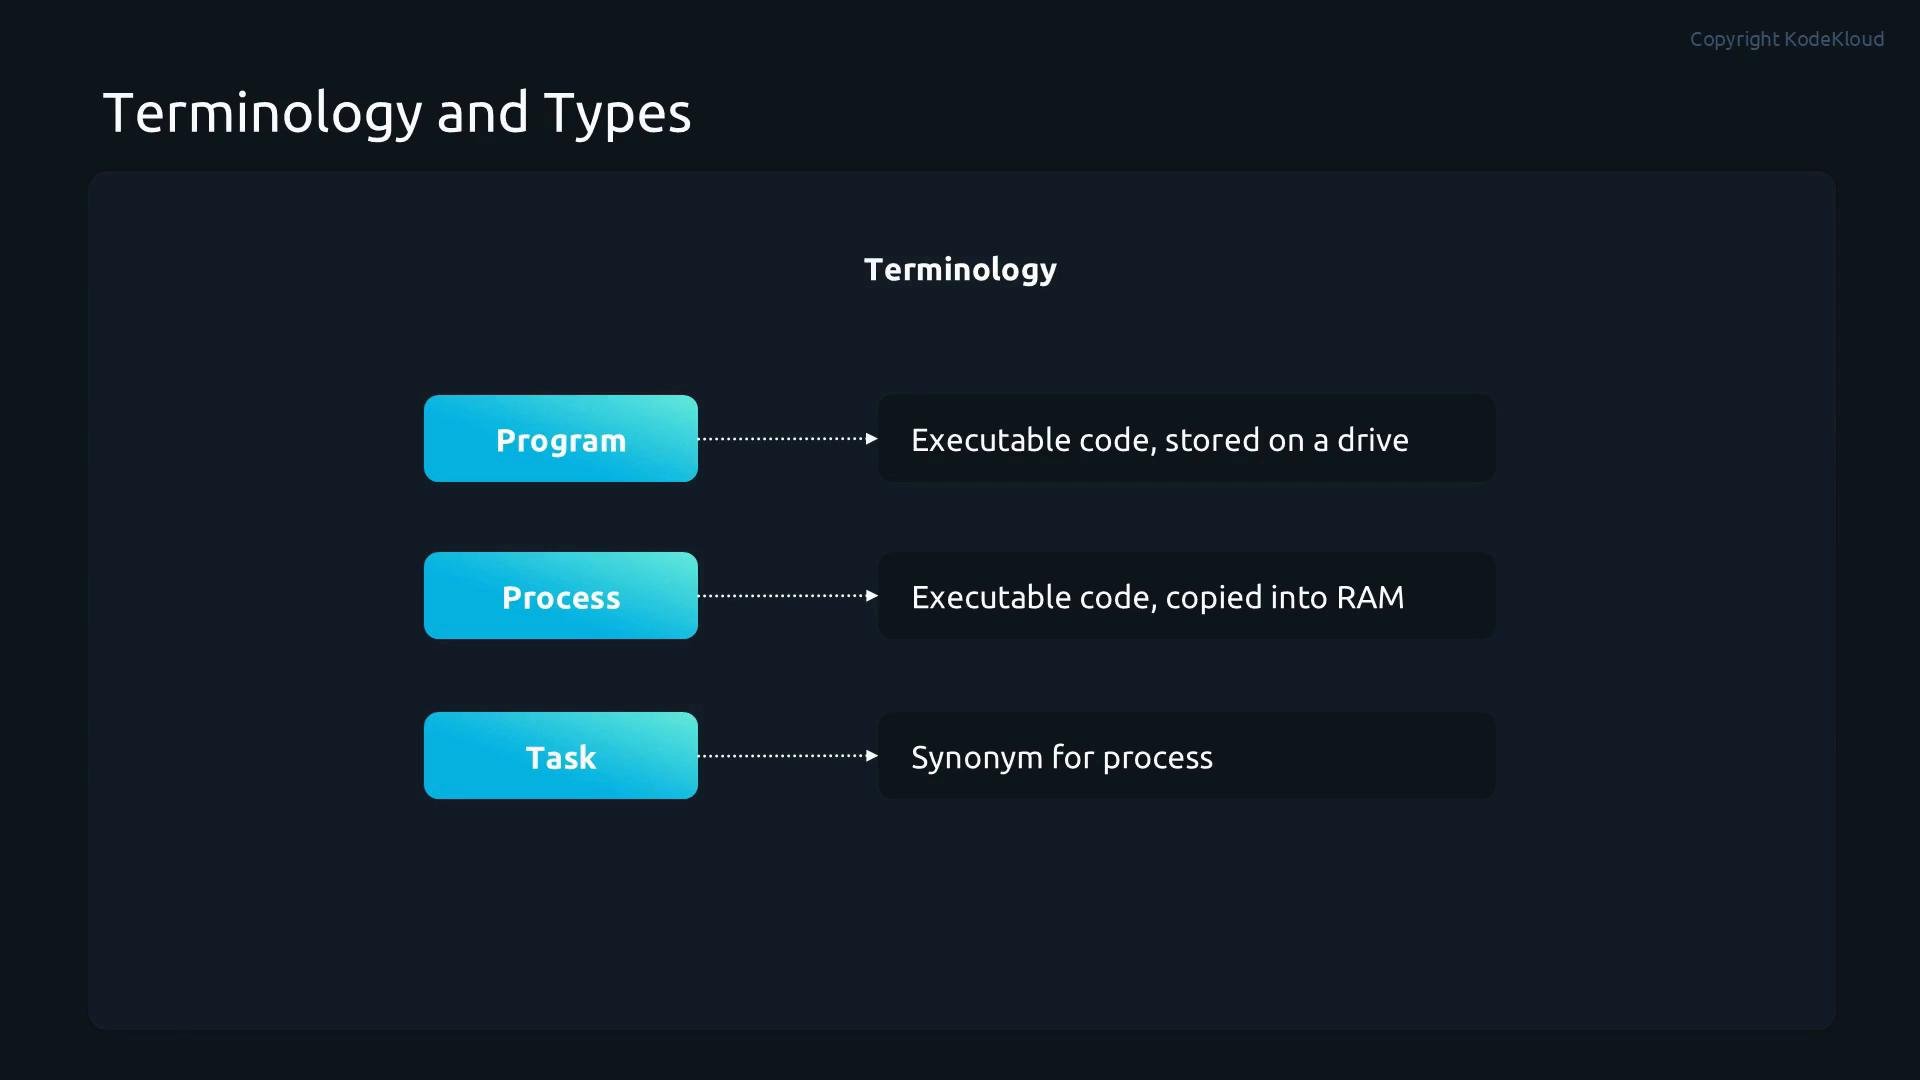
  • Program — executable code stored on disk.
  • Process — the running instance of that code, loaded into RAM.
  • Task — often used interchangeably with “process” in kernel contexts.
Important: on Linux a running process is not permanently tied to the executable file on disk. If the file is removed after execution, the process can continue because its code and data are already in memory.
A dark-themed slide titled "Terminology and Types" that defines: Program — executable code stored on a drive; Process — executable code copied into RAM; Task — synonym for process.
Process types
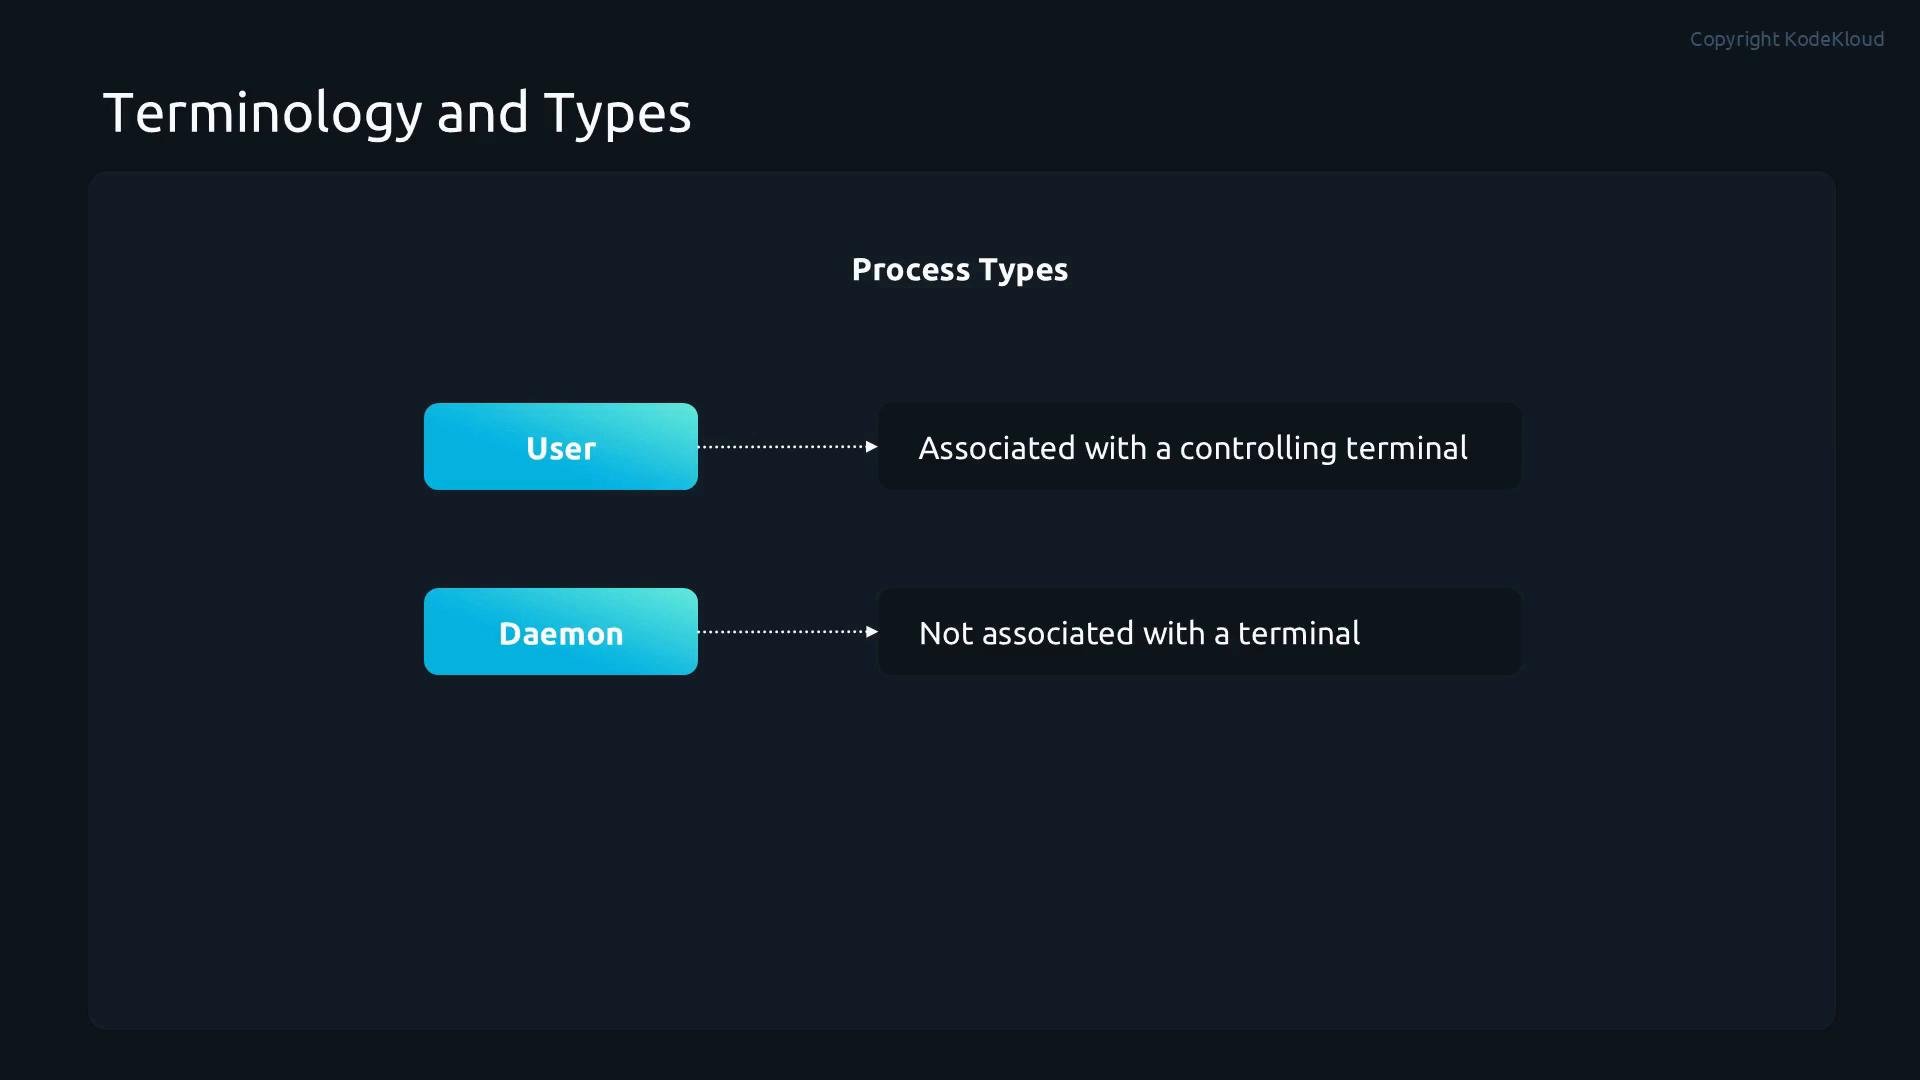
  • User processes: started by interactive users via terminal or GUI; typically have a controlling terminal.
  • Daemons (services): run in the background without a terminal, waiting for events (network requests, timers, etc.).
Examples: a network server daemon waits for incoming connections; cron and atd run scheduled jobs.
A slide titled "Terminology and Types" showing two process types: "User" (associated with a controlling terminal) and "Daemon" (not associated with a terminal).
Process states — quick reference The STAT (or S) column shown by ps, top, and similar tools indicates a process state. Use this table to translate the flag you see into real behavior: Inspect IDs and states:
Signals — controlled communication with processes Signals are the kernel’s lightweight IPC for process control: reloading config, requesting graceful shutdown, stopping, or forcing termination. Common signals: When a child process exits, its parent must collect the exit status (e.g. via wait()). If it does not, the child remains a zombie (Z) and holds a PID slot until reaped. Common kill usage:
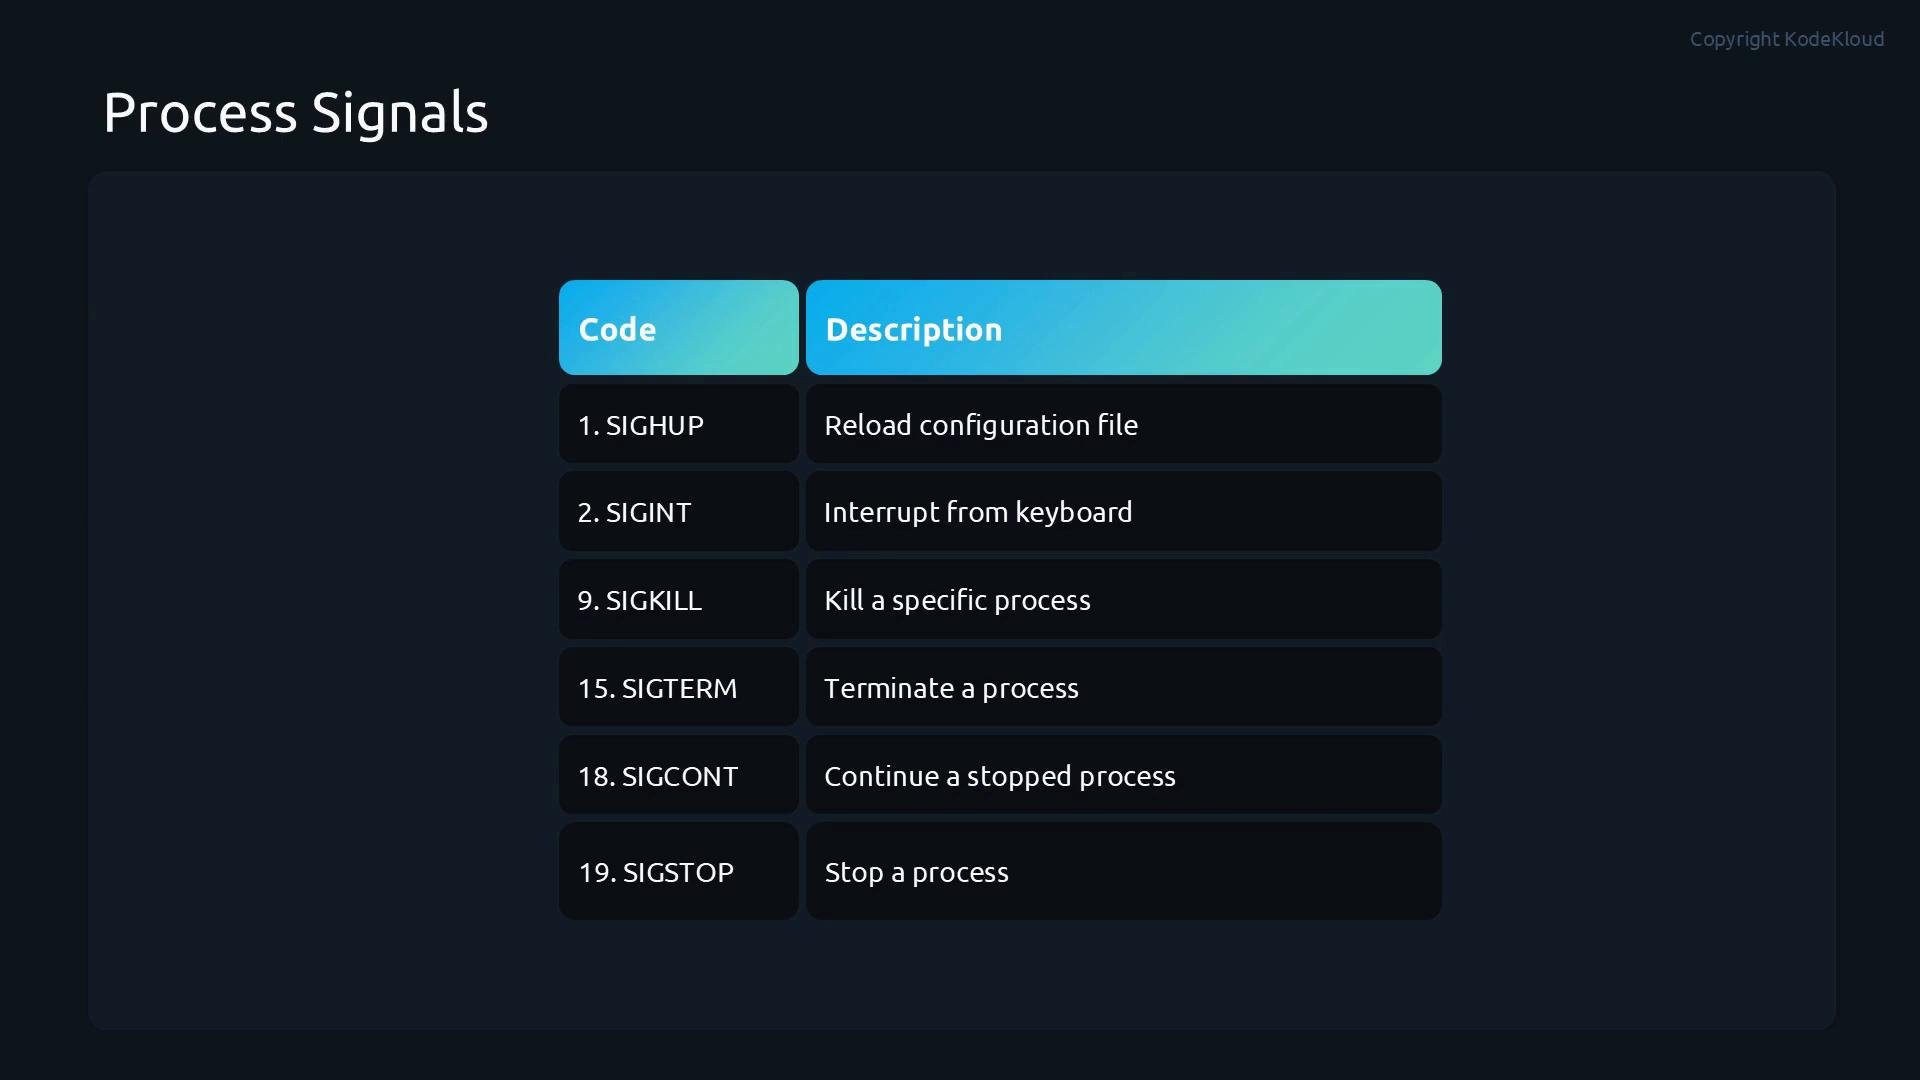
A dark-themed slide titled "Process Signals" showing a two-column table of UNIX signal codes and their descriptions (e.g., SIGHUP, SIGINT, SIGKILL) such as "reload configuration file," "interrupt from keyboard," and "kill a specific process."
Prefer SIGTERM (the default kill) so processes can exit cleanly. Use SIGKILL (kill -9) only when a process refuses to terminate.
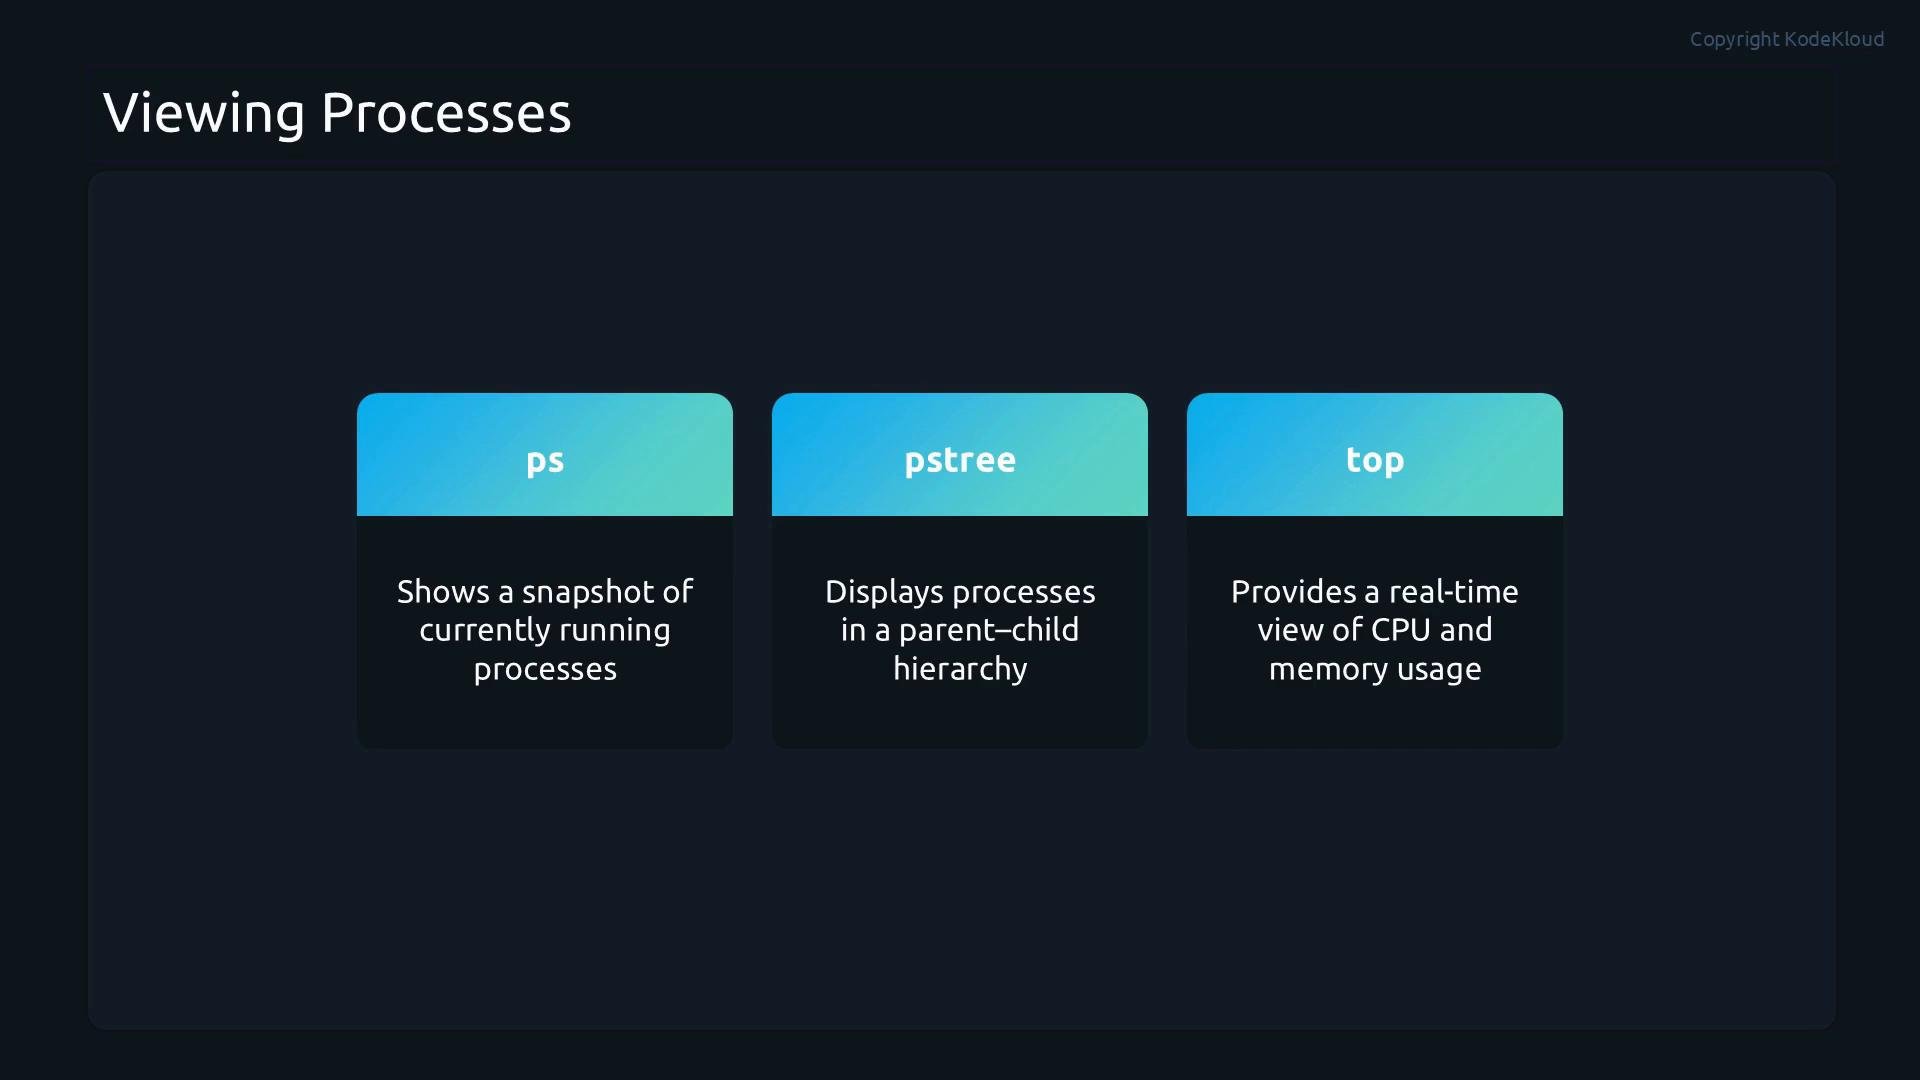
Viewing processes — tools and examples Before acting, identify what is running and how it behaves. Useful tools and short examples:
  • ps — snapshot of processes; scriptable and flexible.
  • pstree — shows parent/child hierarchies.
  • top — interactive, real-time view of CPU/memory and process metrics.
  • htop — enhanced top with keyboard-driven UI (if installed).
Commands:
A dark-themed slide titled "Viewing Processes" showing three gradient tiles labeled "ps", "pstree", and "top." Each tile gives a short description: ps shows a snapshot of running processes, pstree displays processes in a parent–child hierarchy, and top provides a real-time view of CPU and memory usage.
Controlling processes
  • kill <PID> — send a signal to one PID.
  • killall <name> — send a signal to all processes with that name.
  • pkill <pattern> — send a signal to processes matching a pattern or other attributes.
  • top and htop — provide interactive options to kill or change priority (renice) for processes.
Examples:
Background jobs and job control (interactive shell) When you start a process from a shell, you can run it in foreground or background. Shell job control commands:
  • Ctrl-Z — suspend current foreground job (sends SIGSTOP).
  • bg — resume a suspended job in background.
  • fg — bring a background job to the foreground.
  • jobs — list shell jobs with job IDs.
  • disown — remove a job from the shell’s job table so it won’t receive SIGHUP.
  • nohup <cmd> & — run a command immune to hangups and in the background.
Examples:
Quick commands cheat sheet Summary Understanding the Linux process lifecycle, states, signals, and the tools to inspect and control processes is essential for diagnosing performance issues and keeping systems responsive. Use ps, pstree, and top (or htop) to discover what is running; use kill, pkill, and killall with appropriate signals to control processes; and use shell job control (jobs, bg, fg, disown, nohup) to manage interactive and background workloads. Next topics to explore (recommended)
  • Process priority and scheduling: nice, renice, and scheduler basics.
  • System tuning tools: tuned, sysctl, and cgroup resource controls.
  • Service management: systemctl for daemon lifecycle and resource limits.
Links and references

Watch Video