

- Locate important log entries quickly.
- Filter logs for specific services, severities, or time ranges.
- Use logs to diagnose and correlate system issues across services or hosts.
Accurate timestamps are essential. If system time is incorrect or drifting, correlating events across logs or multiple systems becomes unreliable. Ensure NTP or
chrony is configured so logs carry consistent timestamps across servers.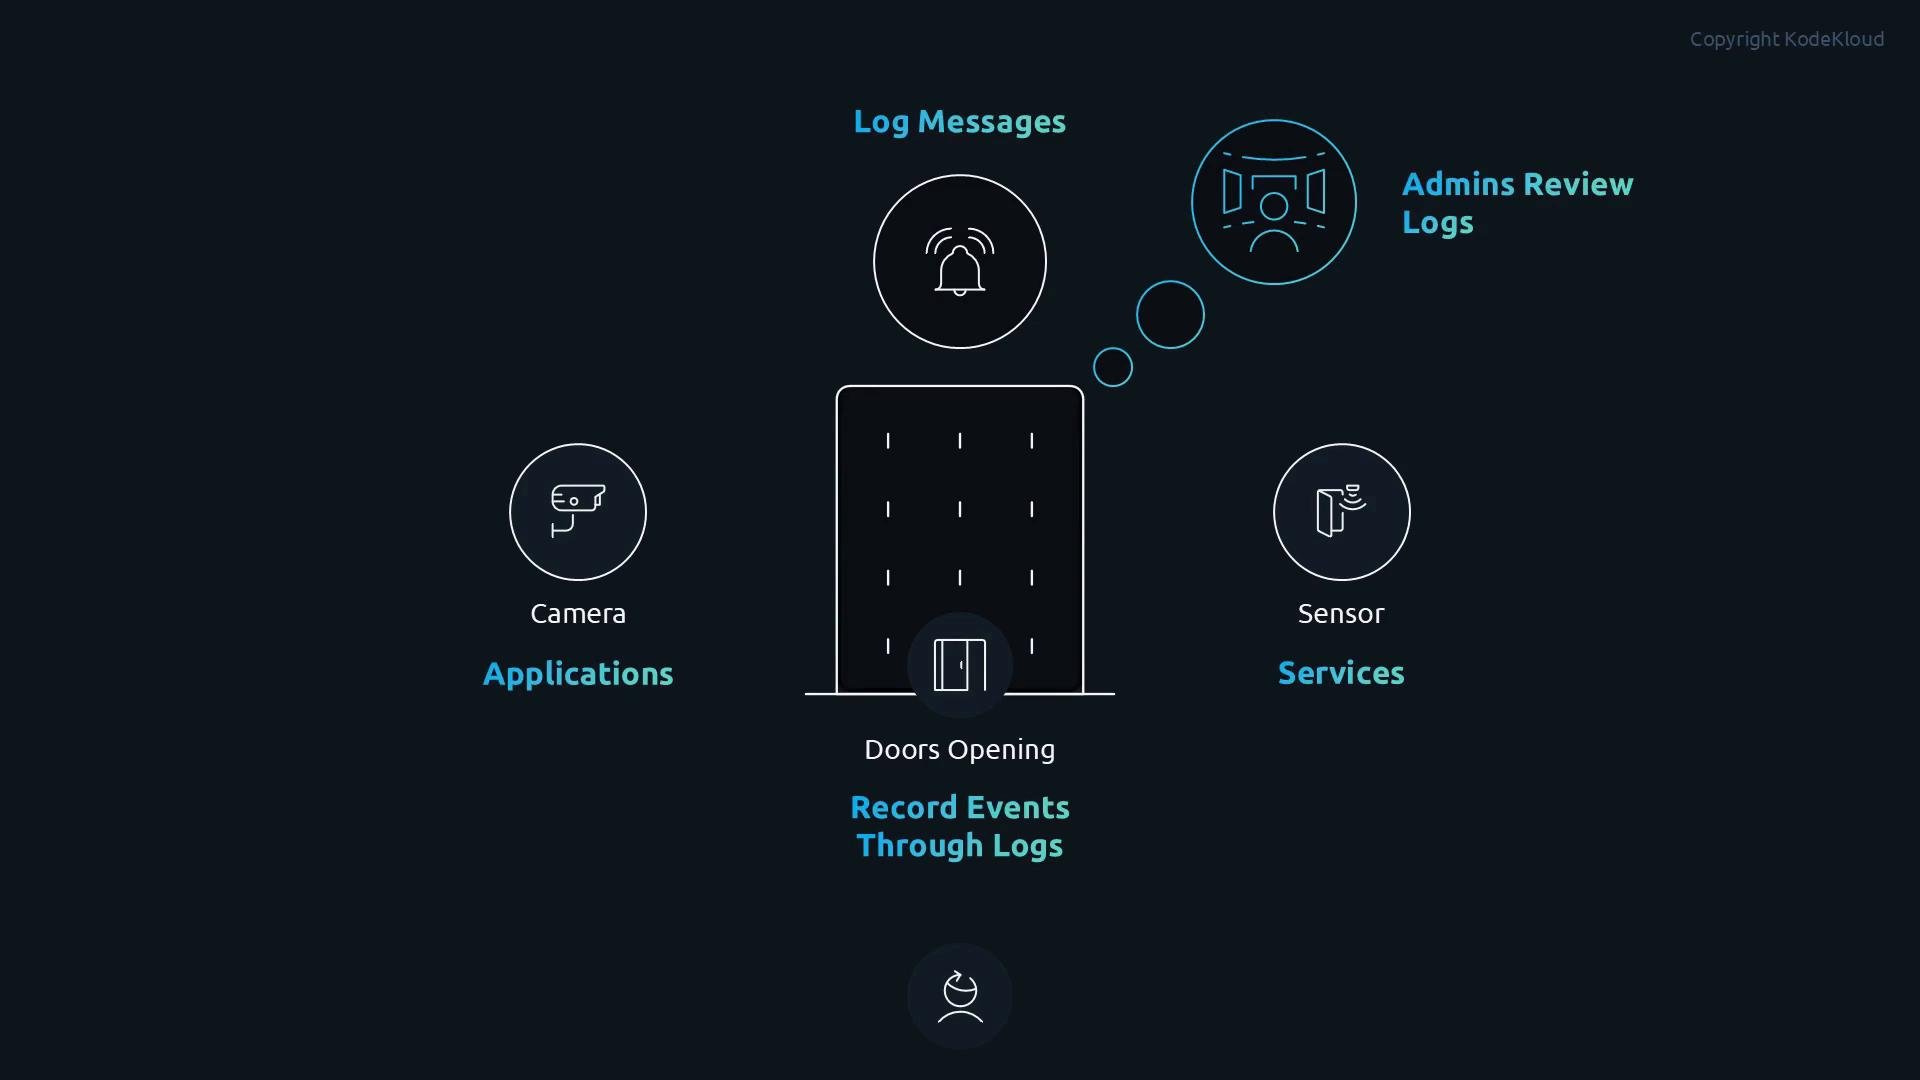
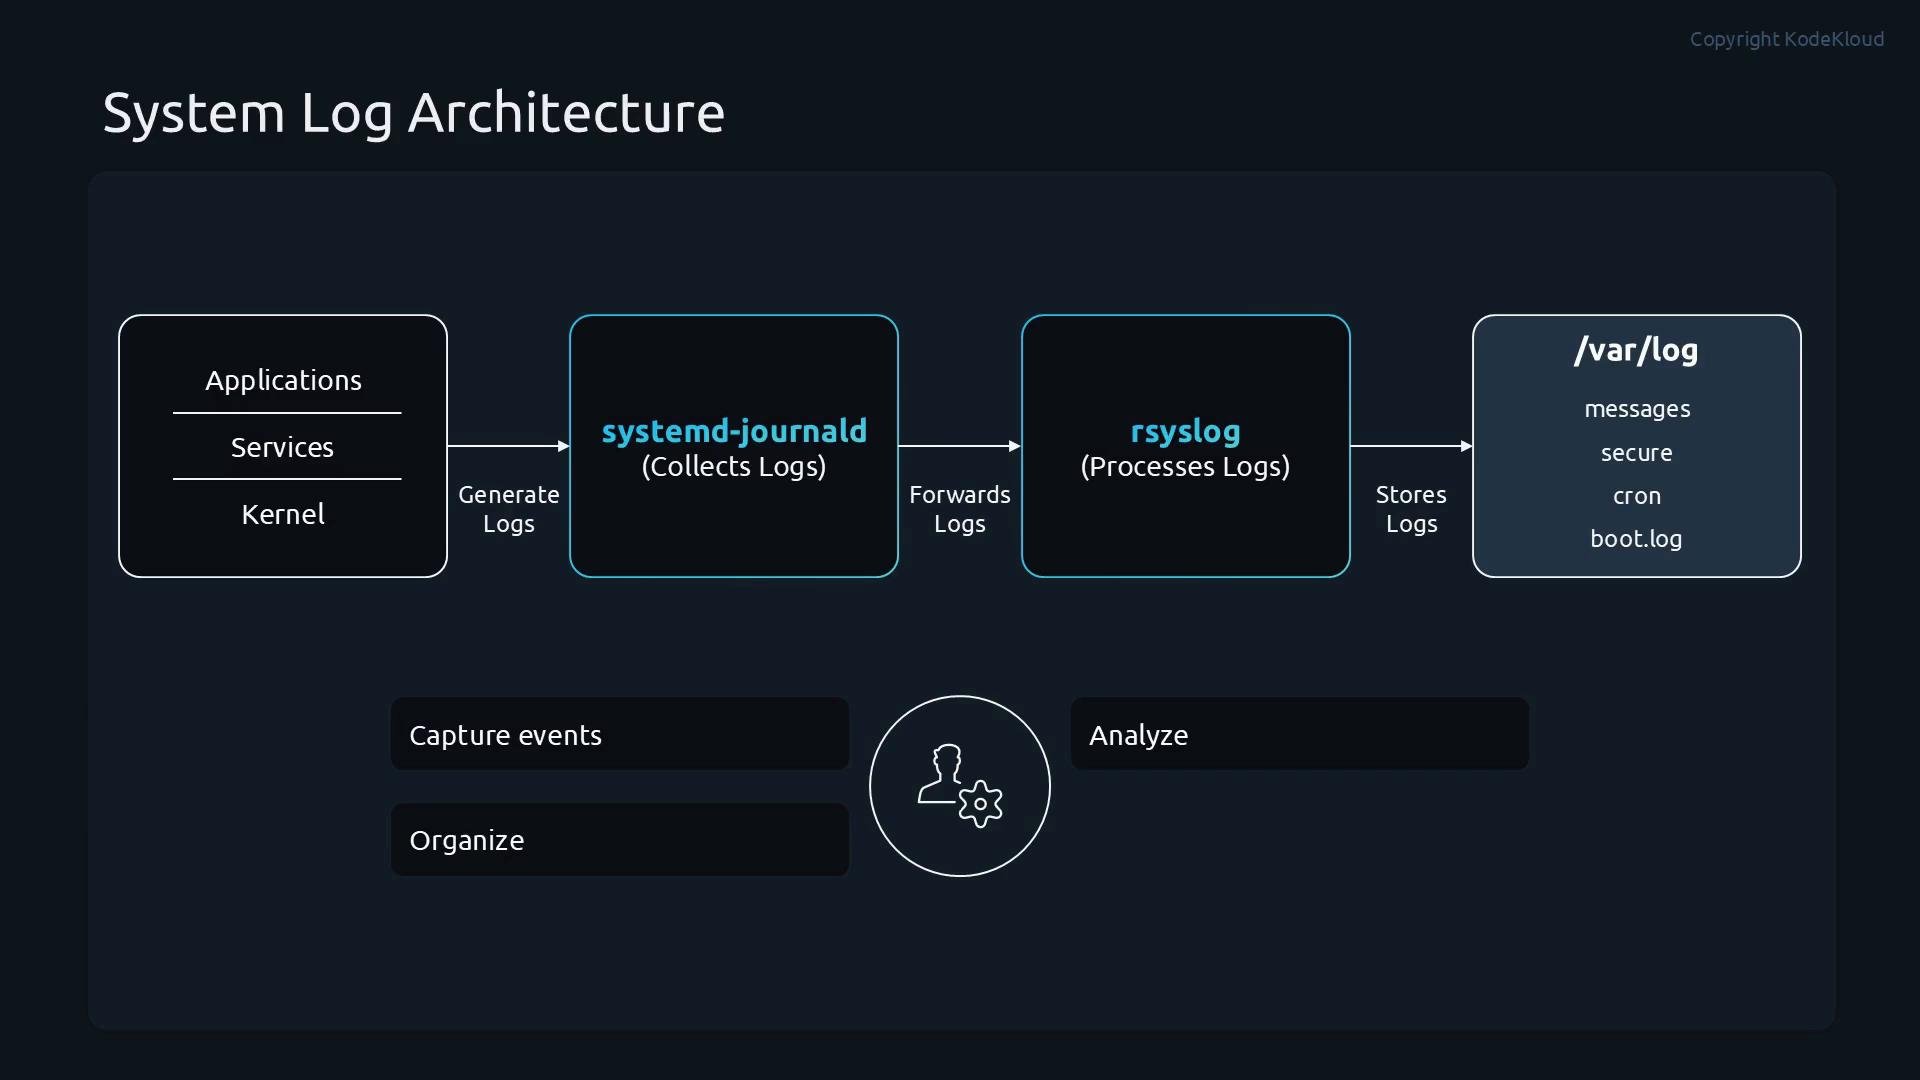
- Sources: kernel, system services (daemons), user applications, and security systems (PAM, auditd).
- Collection: On systemd-based systems,
systemd-journaldcollects kernel messages, syslog, and service stdout/stderr into a binary journal. - Processing & storage: The journal can be queried directly with
journalctland may forward messages to a syslog daemon (e.g.,rsyslog) which writes plain-text logs under/var/logfor compatibility and archival.
- Applications / kernel produce messages.
systemd-journaldaggregates messages into the journal.journaldcan forward messages torsyslog.rsyslogapplies filters/formatting and writes to files in/var/logor forwards to remote log collectors.
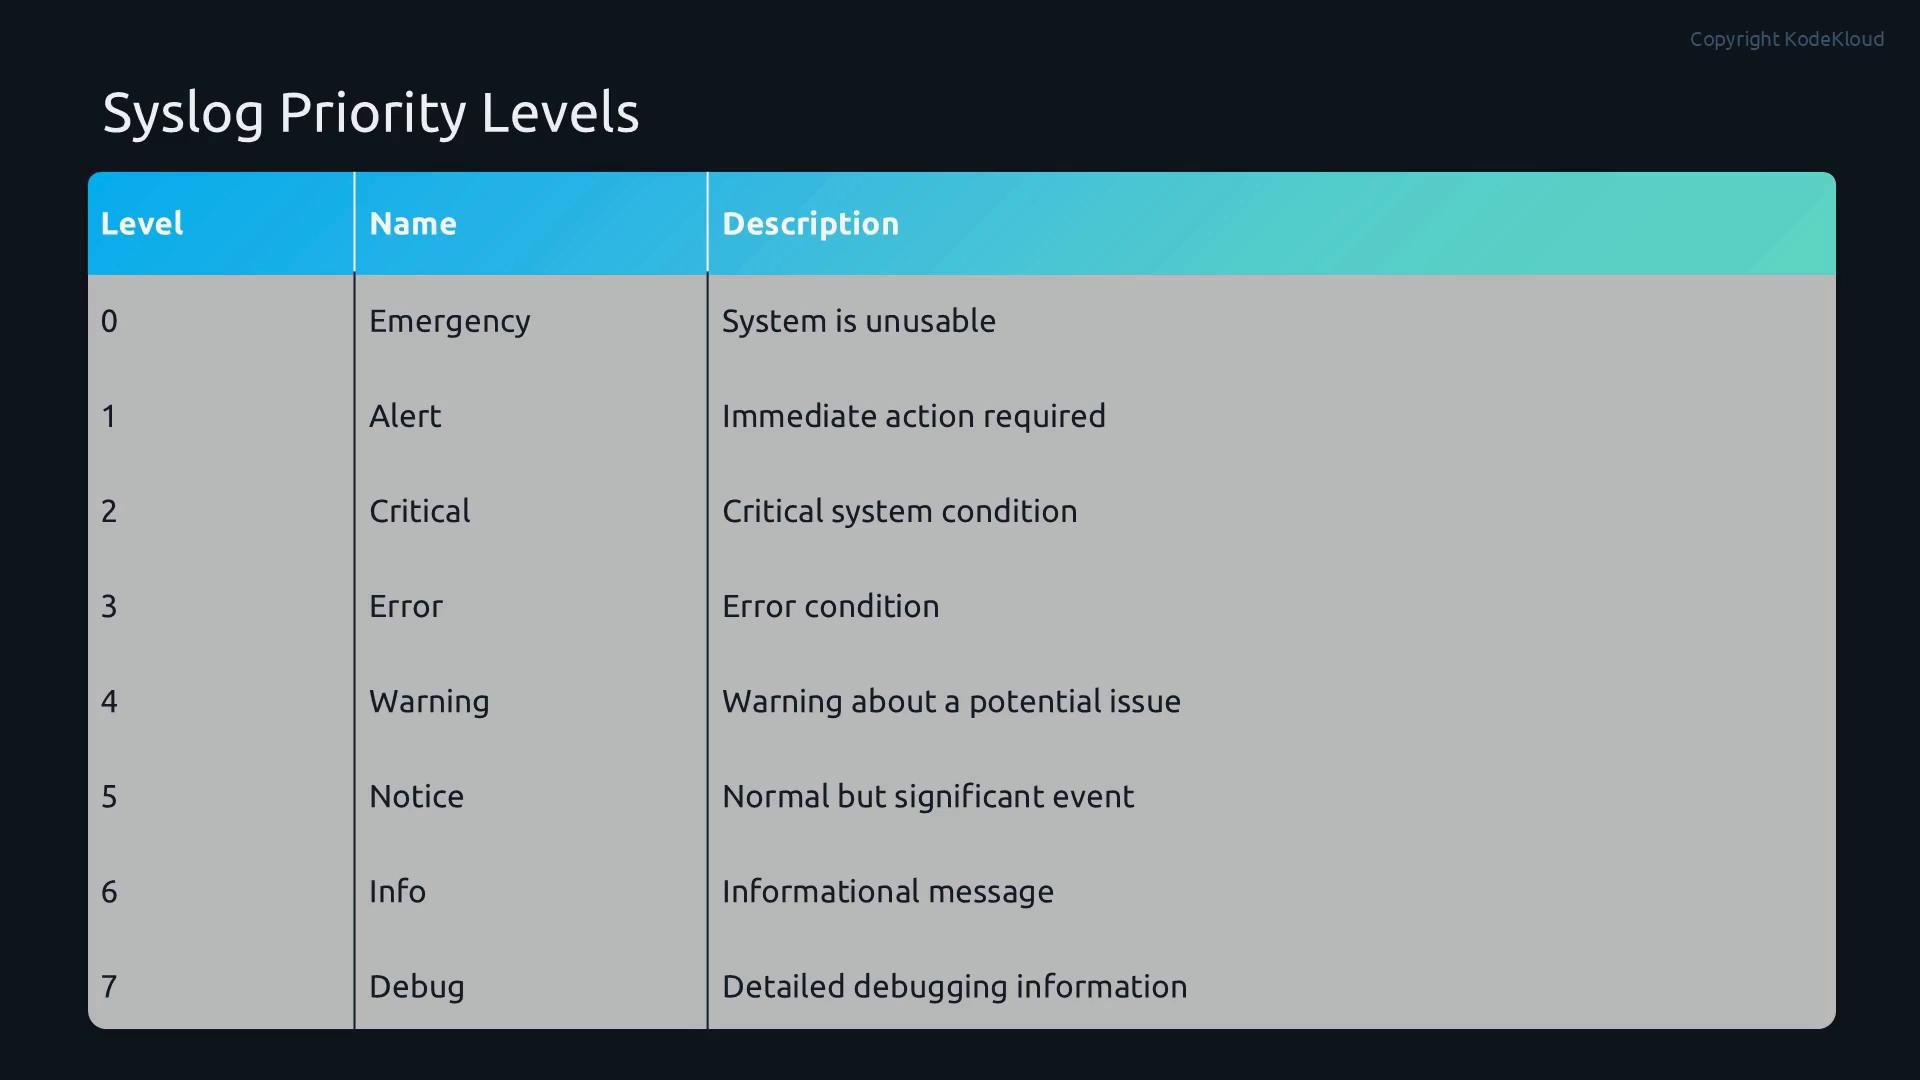
You can filter logs by priority (severity) when querying or when creating rsyslog/journald rules to route messages.
Practical journalctl examples
- Tail live journal:
journalctl -f - Show messages for a service (e.g., sshd):
journalctl -u sshd.service - Show messages since boot with error or higher:
journalctl -b -p err..emerg - Time-range query:
journalctl --since "2026-10-01" --until "2026-10-02" -u nginx.service - Output with ISO timestamps:
journalctl --output=short-iso -u nginx.service --since today
/etc/rsyslog.conf or /etc/rsyslog.d/*.conf):
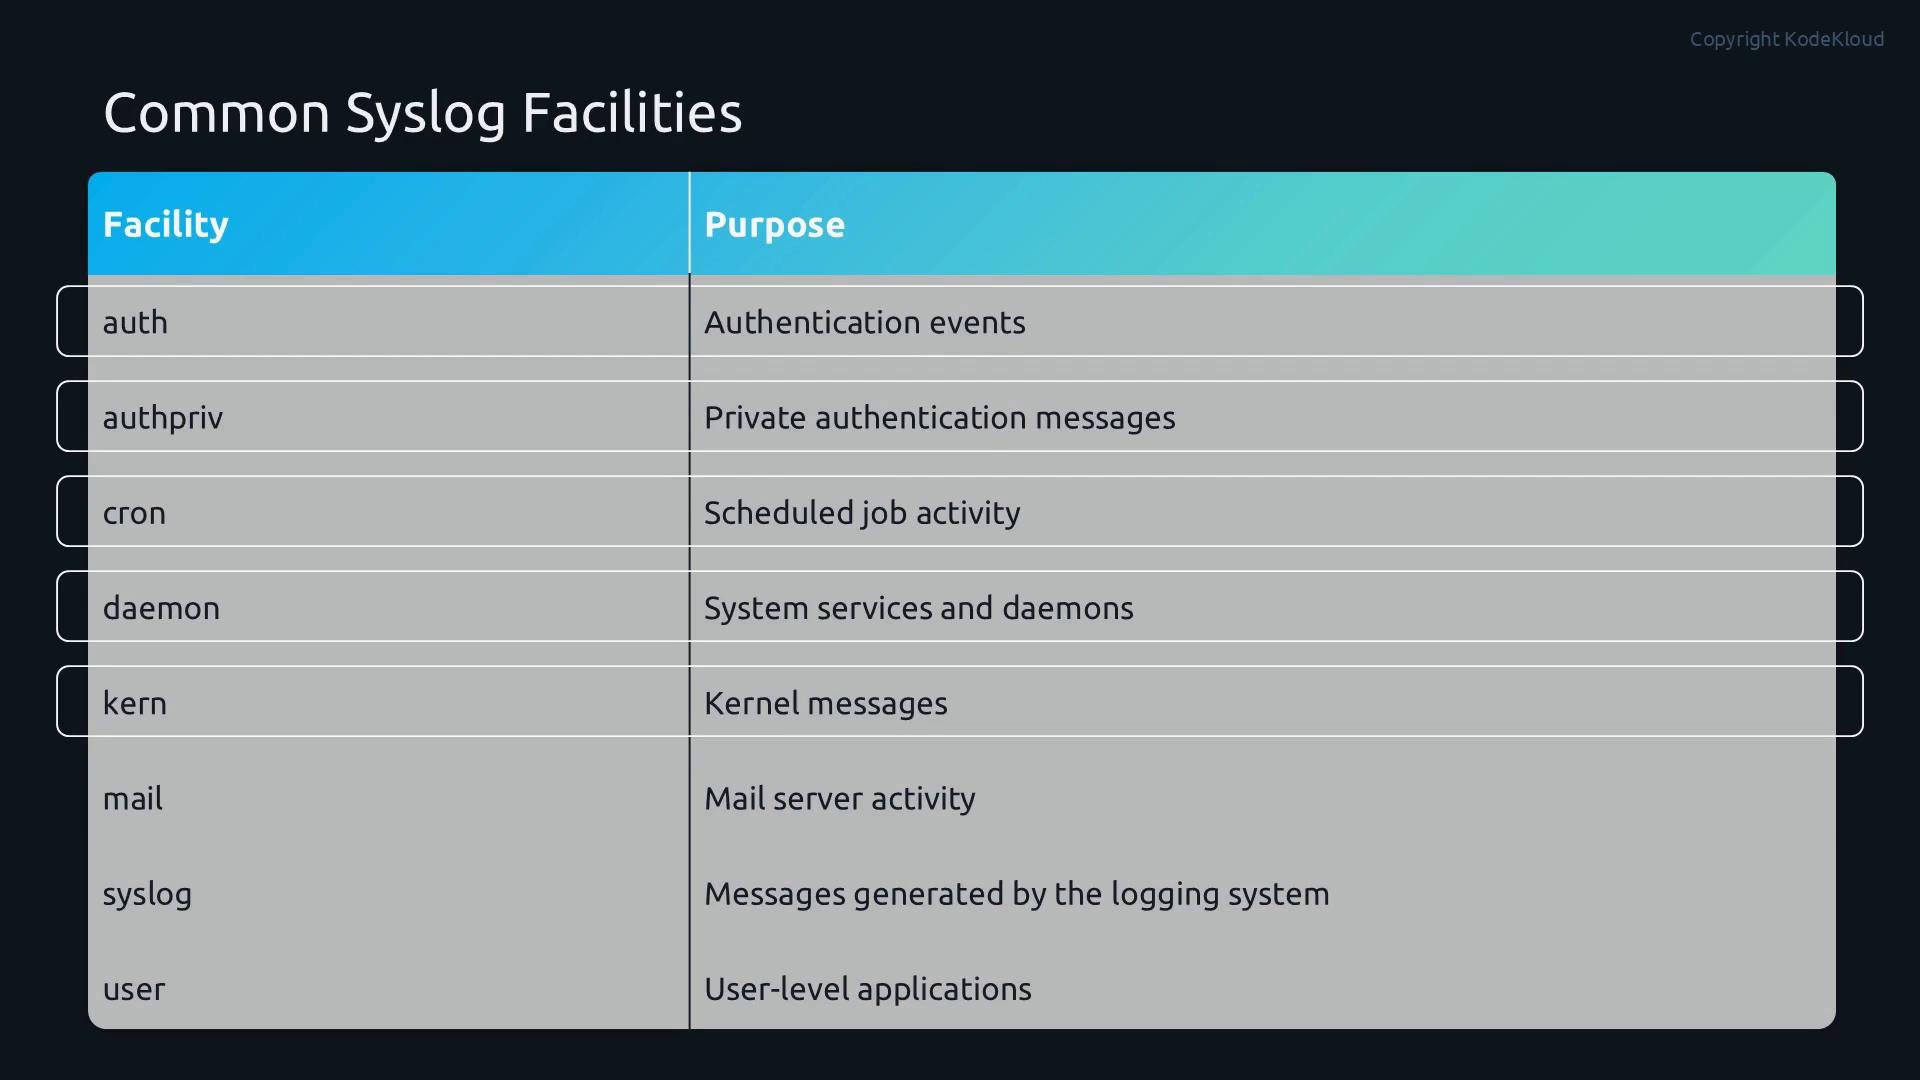
Using facility + priority you can create granular rules, for example sending
authpriv.* to /var/log/secure and mail.* to /var/log/maillog.
Retention, persistence, and best practices
- The systemd journal is a binary store queried with
journalctl. By default some distributions write journal data to volatile storage (/run/log/journal), so ensureStorage=persistentin/etc/systemd/journald.confif you need on-disk persistence. - For long-term retention, archival, compliance, or centralized analysis, forward logs from
journald/rsyslogto a remote log server or log aggregation pipeline (e.g., ELK/EFK, Splunk, or a cloud log service). - Rotate and compress
/var/logfiles withlogrotateto prevent disk exhaustion. - Correlate events between systems using consistent time: synchronize clocks with NTP or
chrony.
By default the journal may be stored in volatile memory. Verify
journald storage settings (/etc/systemd/journald.conf) and configure persistent storage or forwarding to avoid losing logs after reboot. Also limit journal size and configure rotation to prevent disk space issues.- systemd journalctl documentation: https://www.freedesktop.org/software/systemd/man/journalctl.html
- systemd-journald: https://www.freedesktop.org/software/systemd/man/systemd-journald.service.html
- rsyslog: https://www.rsyslog.com/
- NTP: https://www.ntp.org/
- chrony: https://chrony.tuxfamily.org/
- logrotate: https://linux.die.net/man/8/logrotate