This guide shows how to use the gh actions-importer forecast command to estimate potential GitHub Actions usage from historical CI pipeline runs (example uses Jenkins). The forecast analyzes historical builds and computes metrics — such as total execution minutes, queue times, and concurrency — useful for planning runner capacity or estimating GitHub-hosted runner costs. The Jenkins server must have the Paginated Builds plugin installed so the importer can retrieve large volumes of build history without timing out. Example command:
gh actions-importer forecast jenkins --output-dir tmp/forecast
Install the Jenkins “Paginated Builds” plugin on the target Jenkins server before running gh actions-importer forecast jenkins. For Jenkins instances with a lot of historical builds, paginated access prevents request timeouts and ensures the importer can retrieve the full run history.

What the forecast command does

  • Extracts historical build records from your CI provider (Jenkins in this example).
  • Computes execution-time statistics, queue-time summaries, and concurrent-job distributions.
  • Produces:
    • A jobs JSON file containing one object per build (raw extracted records).
    • A human-readable forecast_report.md summarizing the computed metrics for capacity planning.
Useful links

Initial run (example failure when plugin is missing)

If the Paginated Builds plugin is not installed, the forecast command will fail and log a message instructing you to install the plugin. Example failing run and trimmed logs:
root@jenkins in /home
 gh actions-importer forecast jenkins --output-dir tmp/forecast
[2025-05-22 09:33:36] Logs: 'tmp/forecast/log/valet-20250522-093336.log'
[2025-05-22 09:33:36] Forecasting 'http://139.84.149.83:8080/'
[2025-05-22 09:33:37] The 'Paginated Builds' plugin (https://plugins.jenkins.io/paginated-builds) must be installed on your Jenkins server prior to running the `forecast` command. Please view https://github.com/actions-importer/preview/tree/main/jenkins#paginated-builds-plugin for more details

Extracting jobs: |=--=--=--=------------=---------------------=|

root@jenkins in /home took 18s

The detailed logfile shows the same error and includes a stack trace from the importer:
# Logfile created on 2025-05-22 09:33:36 +0000 by logger.rb/v1.6.0
I, [2025-05-22T09:33:36.761835 #1]  INFO -- : Using GitHub Features: Defaults
I, [2025-05-22T09:33:36.761882 #1]  INFO -- : Forecasting 'http://139.84.149.83:8080/'
I, [2025-05-22T09:33:36.844907 #1]  INFO -- : request: GET http://139.84.149.83:8080/pluginManager/api/json?depth=1&tree=plugins%5BshortName%5D
I, [2025-05-22T09:33:37.046147 #1]  INFO -- : response: Status 200
E, [2025-05-22T09:33:37.048371 #1] ERROR -- : The 'Paginated Builds' plugin (https://plugins.jenkins.io/paginated-builds) must be installed on
/usr/local/bundle/gems/actions_importer-1.3.22397/lib/valet/services/jenkins/extract_jobs.rb:12:in `call'
... (stack trace truncated) ...

Install the Paginated Builds plugin in Jenkins

  1. Open Jenkins → Manage Jenkins → Manage Plugins.
  2. Search for “Paginated Builds” in the Available plugins tab.
  3. Install the plugin and restart Jenkins when prompted.
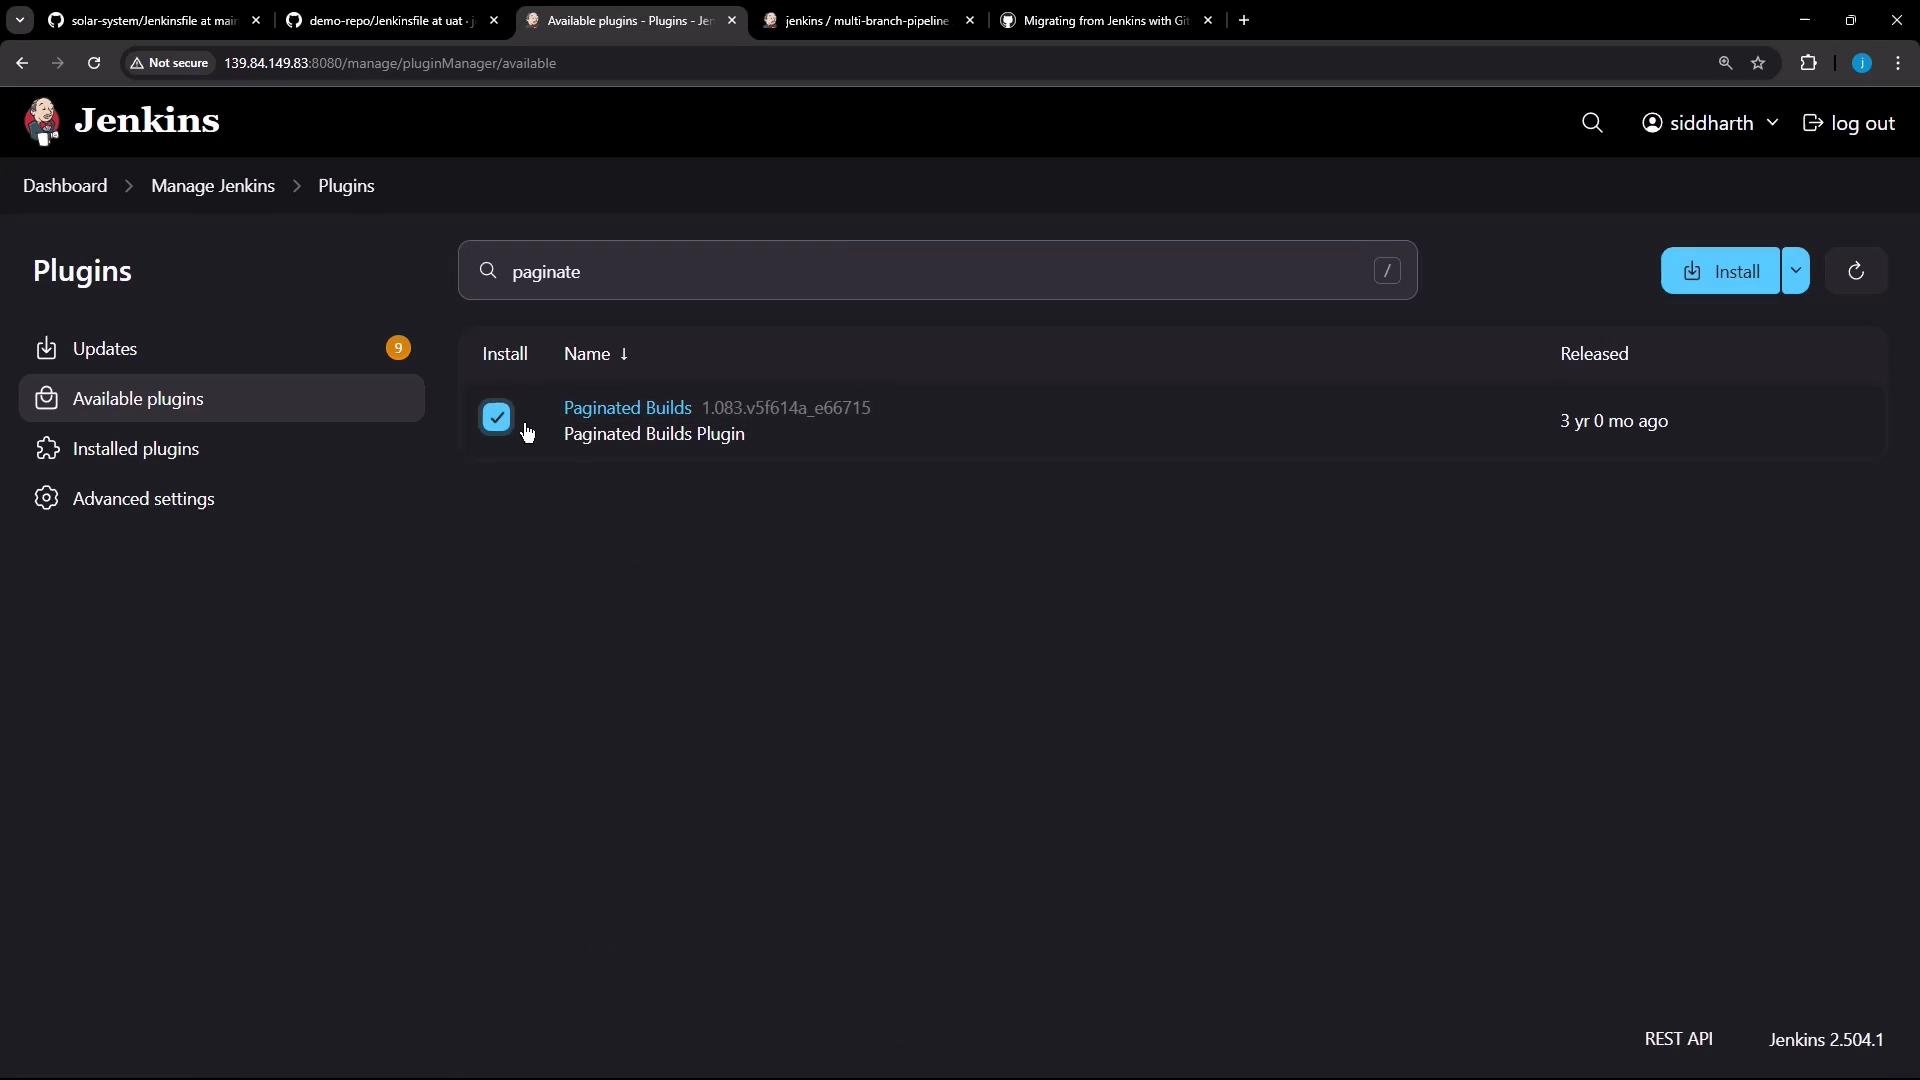
Screenshot of the Jenkins "Available plugins" page in dark mode showing the search for "paginate" and the "Paginated Builds" plugin selected. A blue "Install" button is visible at the top-right.
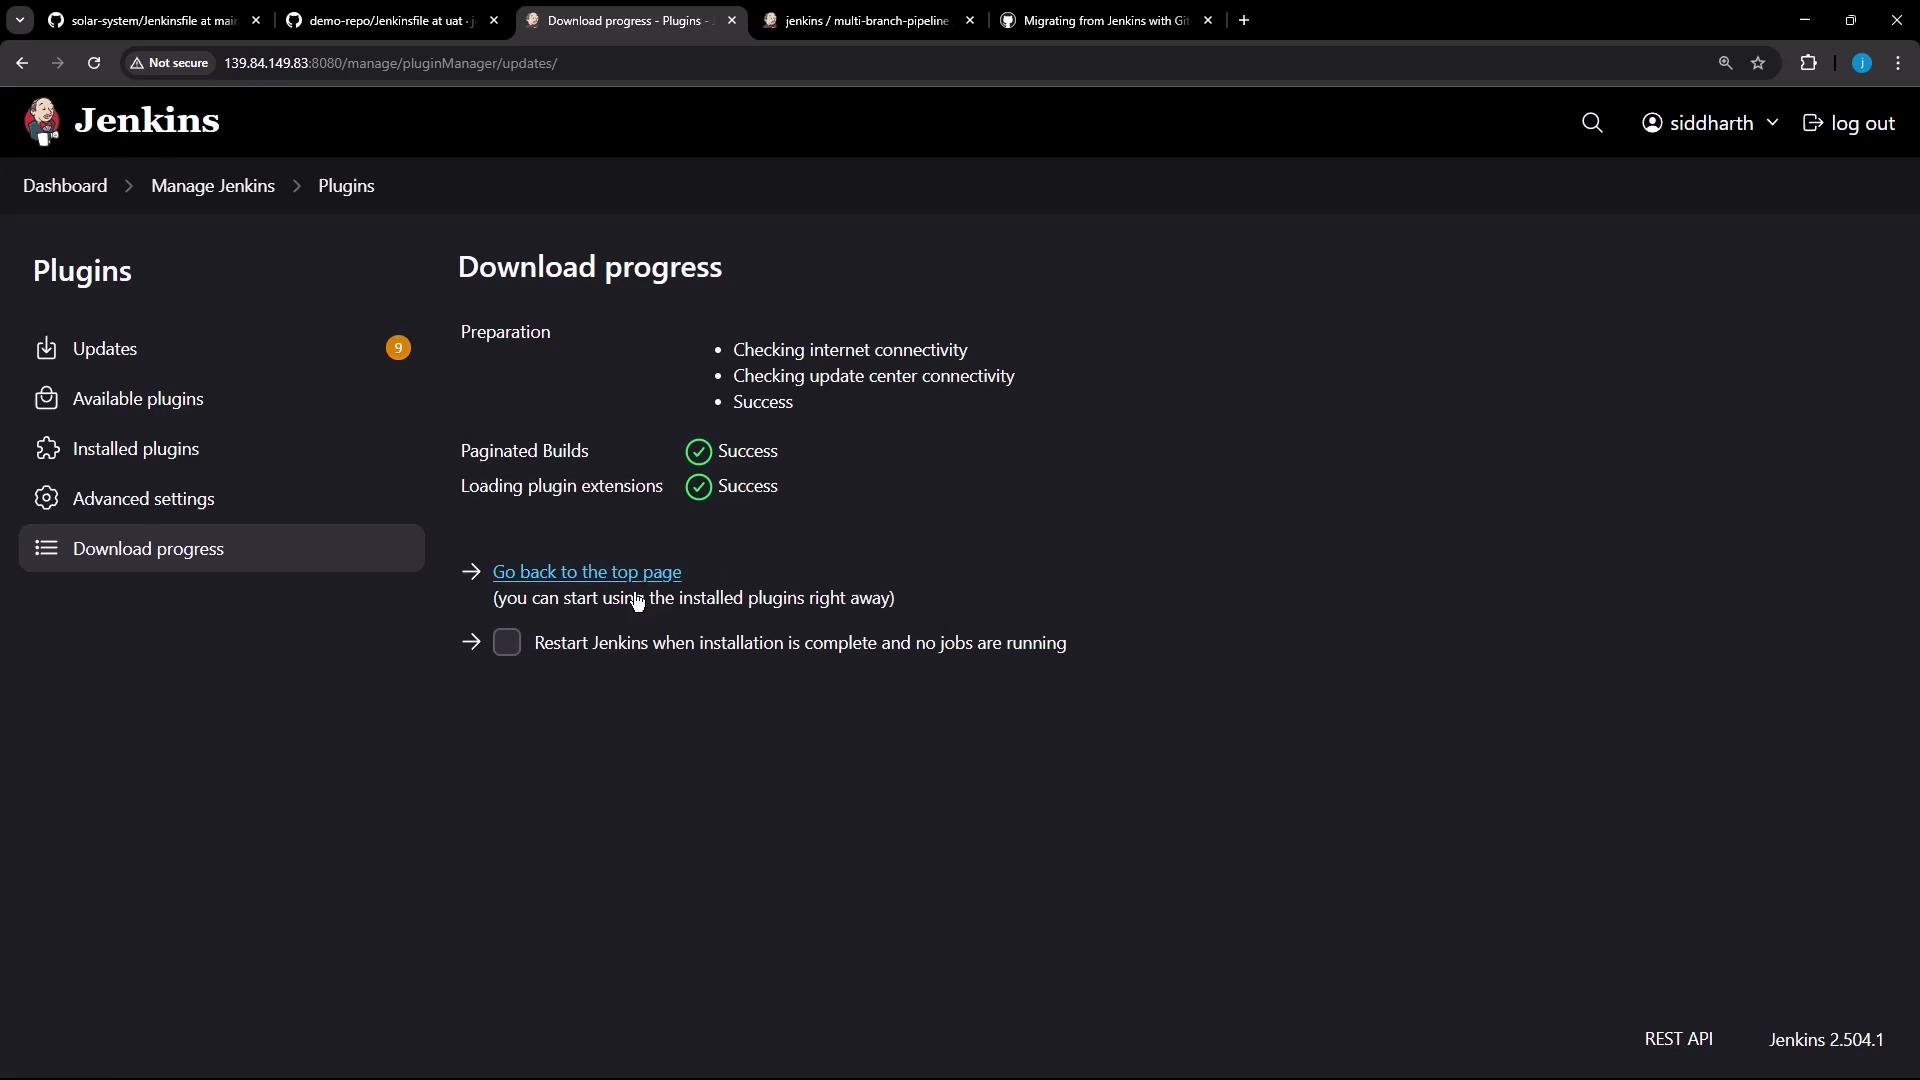
The installer shows download and installation progress.
A screenshot of the Jenkins "Download progress" page showing preparation steps and green success indicators for Paginated Builds and loading plugin extensions. The left sidebar shows the Plugins menu (Updates, Available plugins, Installed plugins, etc.).
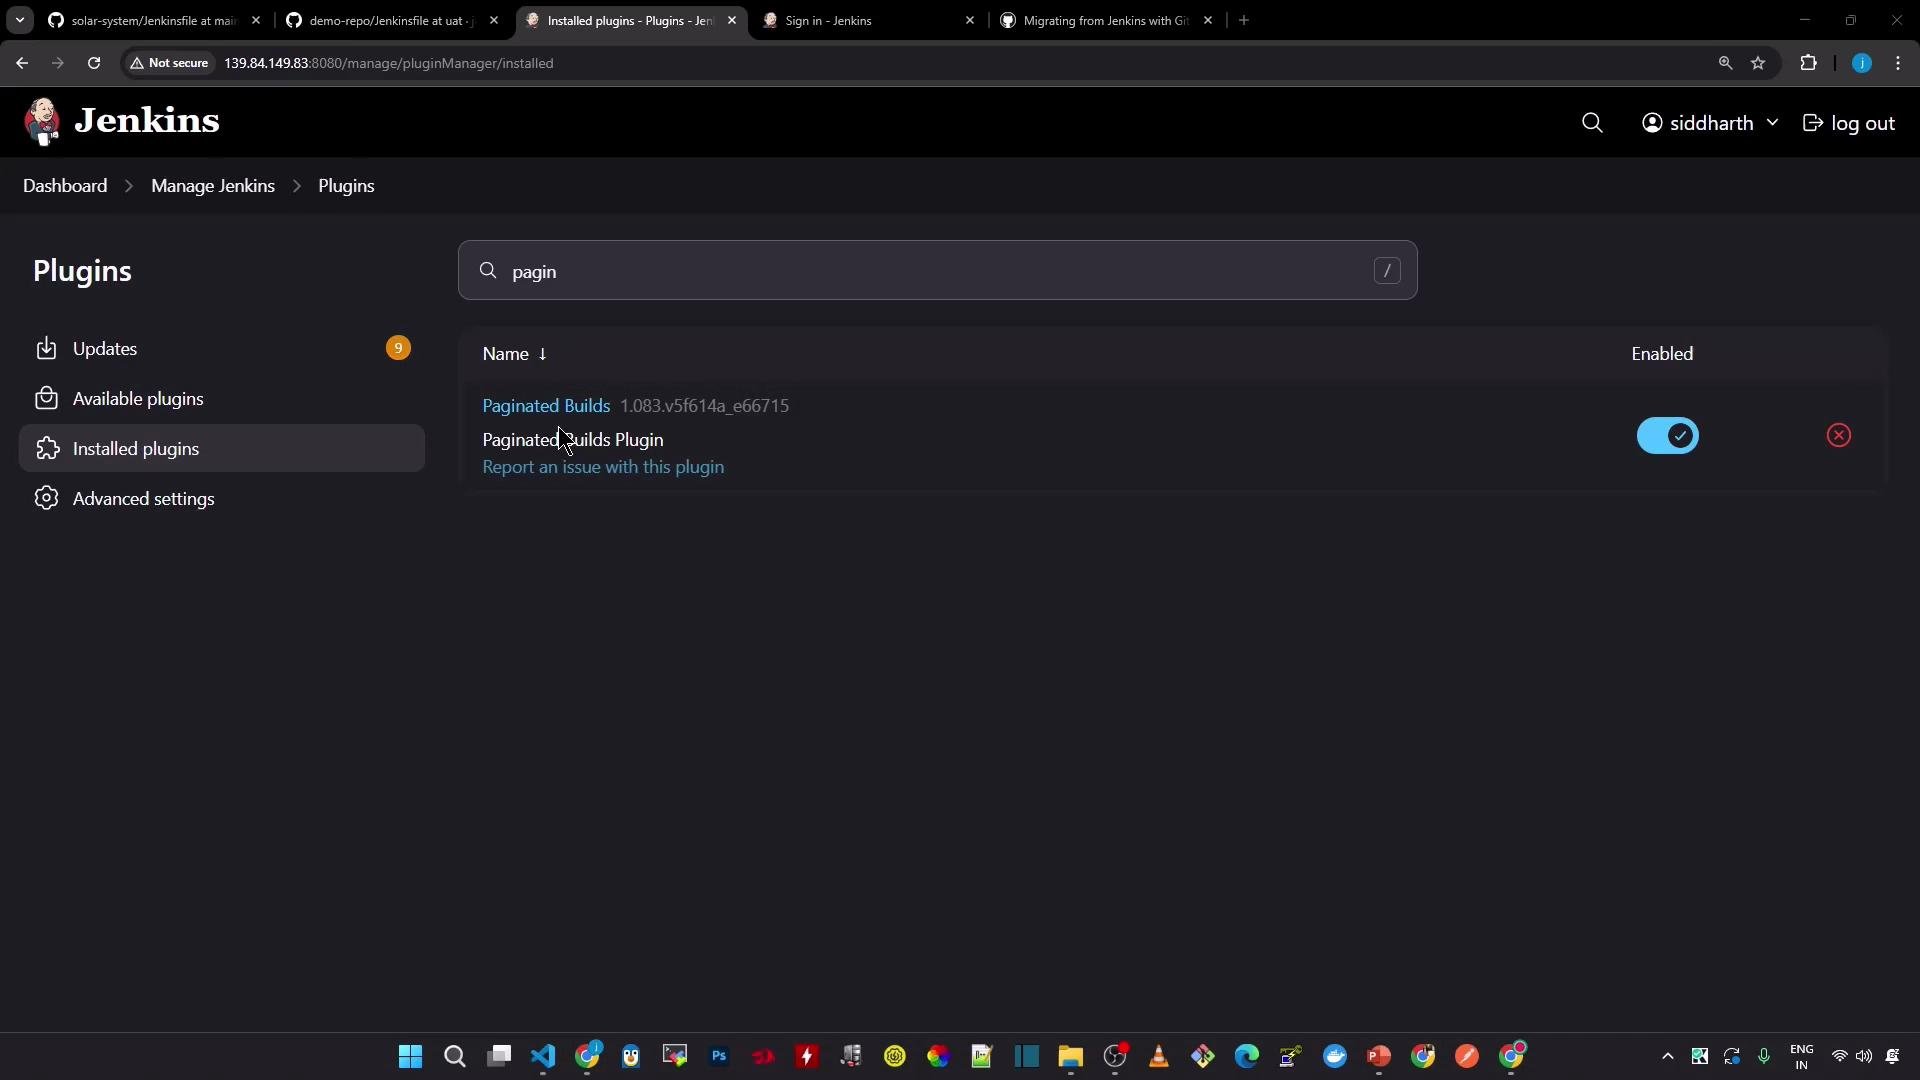
After restarting Jenkins, confirm the plugin is enabled in Installed plugins.
A screenshot of the Jenkins Plugins management page (dark theme) showing the "Paginated Builds" plugin listed. The plugin is enabled with a blue toggle and the sidebar shows Installed plugins and other settings.

Rerun the forecast — handle HTTP caching issues

Even after installing the plugin, you may still see the same error if the importer is using previously cached HTTP responses that predate the plugin installation. To force fresh requests, re-run the forecast with the --no-http-cache flag. You can check the forecast command options:
root@jenkins in /home
 gh actions-importer forecast --help
Description:
  Forecast GitHub Actions usage from historical pipeline utilization.

Options:
  --source-file-path <source-file-path> (REQUIRED)  The file path(s) to existing jobs data.
  -o, --output-dir <output-dir> (REQUIRED)          The location for any output files.
  --start-date <start-date>                         The start date of the forecast analysis in YYYY-MM-DD format.
  --time-slice <time-slice>                         The time slice in seconds to use for computing concurrency metrics. [default: 60]
  --credentials-file <credentials-file>             The file containing the credentials to use.
  --no-telemetry                                    Boolean value to disallow telemetry.
  --no-ssl-verify                                   Disable SSL certificate verification.
  --no-http-cache                                   Disable caching of HTTP responses.
  --prerelease                                      Use prerelease image for GitHub Actions Importer.
  --no-host-network                                 Use docker's default bridge network instead of the host machine's network.
  -?, -h, --help                                    Show help and usage information

Commands:
  azure-devops  Forecasts GitHub Actions usage from historical Azure DevOps pipeline utilization.
  jenkins       Forecasts GitHub Actions usage from historical Jenkins pipeline utilization.
  gitlab        Forecasts GitHub Actions usage from historical GitLab pipeline utilization.
  circle-ci     Forecasts GitHub Actions usage from historical CircleCI pipeline utilization.
  travis-ci     Forecasts GitHub Actions usage from historical Travis CI pipeline utilization.
  github        Forecasts GitHub Actions usage from historical Github pipeline utilization.
  bamboo        Forecasts GitHub Actions usage from historical Bamboo pipeline utilization.
  bitbucket     Forecasts GitHub Actions usage from historical Bitbucket pipeline utilization.
If you still see the plugin-related error after installing Paginated Builds, add --no-http-cache to the forecast command to ensure the importer queries Jenkins live instead of using cached plugin lists.
Example successful run using --no-http-cache:
root@jenkins in /home
 gh actions-importer forecast jenkins --output-dir tmp/forecast --no-http-cache
[2025-05-22 09:40:18] Logs: 'tmp/forecast/log/valet-20250522-094018.log'
[2025-05-22 09:40:18] Forecasting 'http://139.84.149.83:8080/'
[2025-05-22 09:40:21] Output file(s):
    tmp/forecast/jobs/05-22-2025-09-40_jobs_0.json
    tmp/forecast/forecast_report.md

root@jenkins in /home took 23s

Output artifacts

The forecast run produces two primary outputs:
ArtifactPurposeExample path
Jobs JSONRaw list of extracted builds; one object per build with timestamps and result detailstmp/forecast/jobs/05-22-2025-09-40_jobs_0.json
Forecast report (Markdown)Human-readable summary of totals, execution-time stats, queue times, and concurrencytmp/forecast/forecast_report.md

Example: jobs JSON snippet

The jobs JSON file contains one object per build record. Each object includes fields such as id, result, queue_time, start_time, finish_time, and definition_id.
[
  {
    "id": "28",
    "build_number": null,
    "result": "ABORTED",
    "runner_group": "",
    "queue_time": "2025-05-22T00:00:11+00:00",
    "start_time": "2025-05-22T00:00:11+00:00",
    "finish_time": "2025-05-22T09:20:42+00:00",
    "definition_id": "ci-pipeline-poll-scm",
    "runner_name": "",
    "os_description": null
  },
  {
    "id": "27",
    "build_number": null,
    "result": "SUCCESS",
    "runner_group": "",
    "queue_time": "2025-05-21T07:48:59+00:00",
    "start_time": "2025-05-21T07:48:59+00:00",
    "finish_time": "2025-05-21T07:50:53+00:00",
    "definition_id": "ci-pipeline-poll-scm",
    "runner_name": "",
    "os_description": null
  }
  /* ... additional build objects ... */
]

Example: forecast_report.md (trimmed)

The generated forecast_report.md summarizes totals and statistical metrics that aid capacity planning — such as total execution minutes, median and percentile values, and concurrency distributions.
- GitHub Actions Importer version: **1.3.22397(b4d19e0745a2d2c3db575188f98101dd1f9b4a53)**
- Performed at: **5/22/25 at 09:40**
- Date range: **5/15/25 - 5/22/25**

## Total

- Job count: **32**
- Pipeline count: **5**

- Execution time
  - Total: **9,455 minutes**
  - Median: **1 minute**
  - P90: **1,589 minutes**
  - Min: **0 minutes**
  - Max: **3,499 minutes**

- Queue time
  - Median: **0 minutes**
  - P90: **0 minutes**
  - Min: **0 minutes**
  - Max: **0 minutes**

- Concurrent jobs
  - Median: **1**
These metrics are useful for estimating:
  • GitHub-hosted runner minute consumption.
  • The number of concurrent self-hosted runners required to achieve desired throughput.
  • Cost planning and migration strategy when moving pipelines to GitHub Actions.

Recap and troubleshooting checklist

  • Purpose: gh actions-importer forecast jenkins computes GitHub Actions usage estimates from historical Jenkins builds.
  • Precondition: Install the Jenkins Paginated Builds plugin and restart Jenkins.
  • If you see the plugin error after installation:
    • Re-run the command with --no-http-cache to bypass stale HTTP responses.
  • Outputs:
    • Jobs JSON file (raw build records).
    • forecast_report.md (human-readable usage summary).
If you need to review the installer or plugin details, refer to the Jenkins plugin page (https://plugins.jenkins.io/paginated-builds) and the importer docs (https://github.com/actions-importer/preview/tree/main/jenkins#paginated-builds-plugin).

Watch Video