Hello, and welcome back. In this lesson we’ll set up alerting and monitoring for an Amazon Aurora (RDS) database using Amazon CloudWatch alarms. If you want to follow along, I already have an Aurora cluster available — you can create one in your account and use that cluster’s identifier throughout the steps below. Key topics covered:
  • Inspecting database behavior with Performance Insights and the RDS console
  • Creating a CloudWatch alarm for DatabaseConnections
  • Configuring SNS notifications for alarm actions
  • Simulating load with a Python script to trigger the alarm

Inspect the database with Performance Insights and RDS monitoring

Performance Insights provides detailed, database-level telemetry for Aurora and other RDS engines. You can also use the Monitoring tab in the RDS console for a quick overview of common metrics.
A screenshot of the AWS RDS console showing the "performance-insight-db-prod" Aurora PostgreSQL cluster with its instances, CPU/activity indicators, and endpoints. The Writer and Reader endpoints are listed as Available and there's a section for managing IAM roles.
Use Performance Insights to understand query load, waits, and top-consuming SQL statements. When you need proactive notifications (for example, when active connections spike) use CloudWatch alarms.

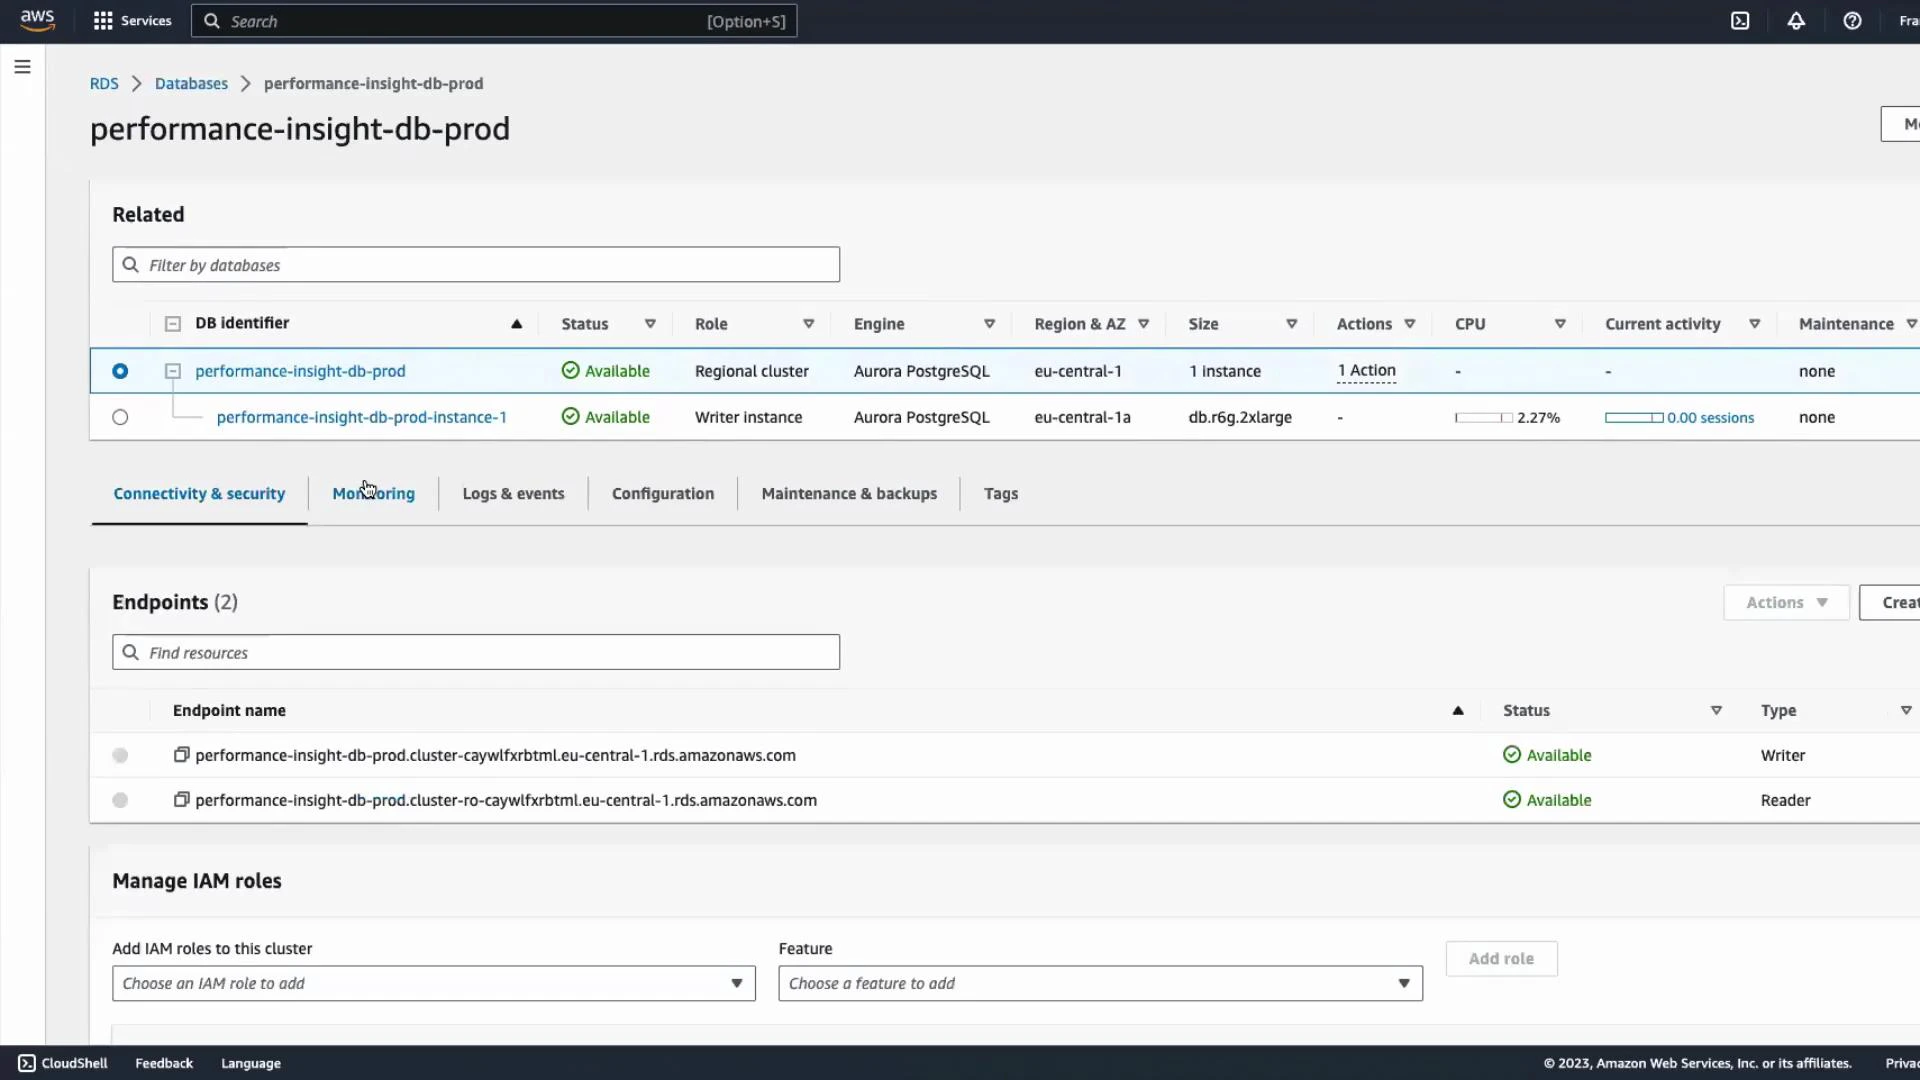
Create a CloudWatch alarm for DatabaseConnections (step-by-step)

  1. Open the CloudWatch console and go to Alarms → Create alarm.
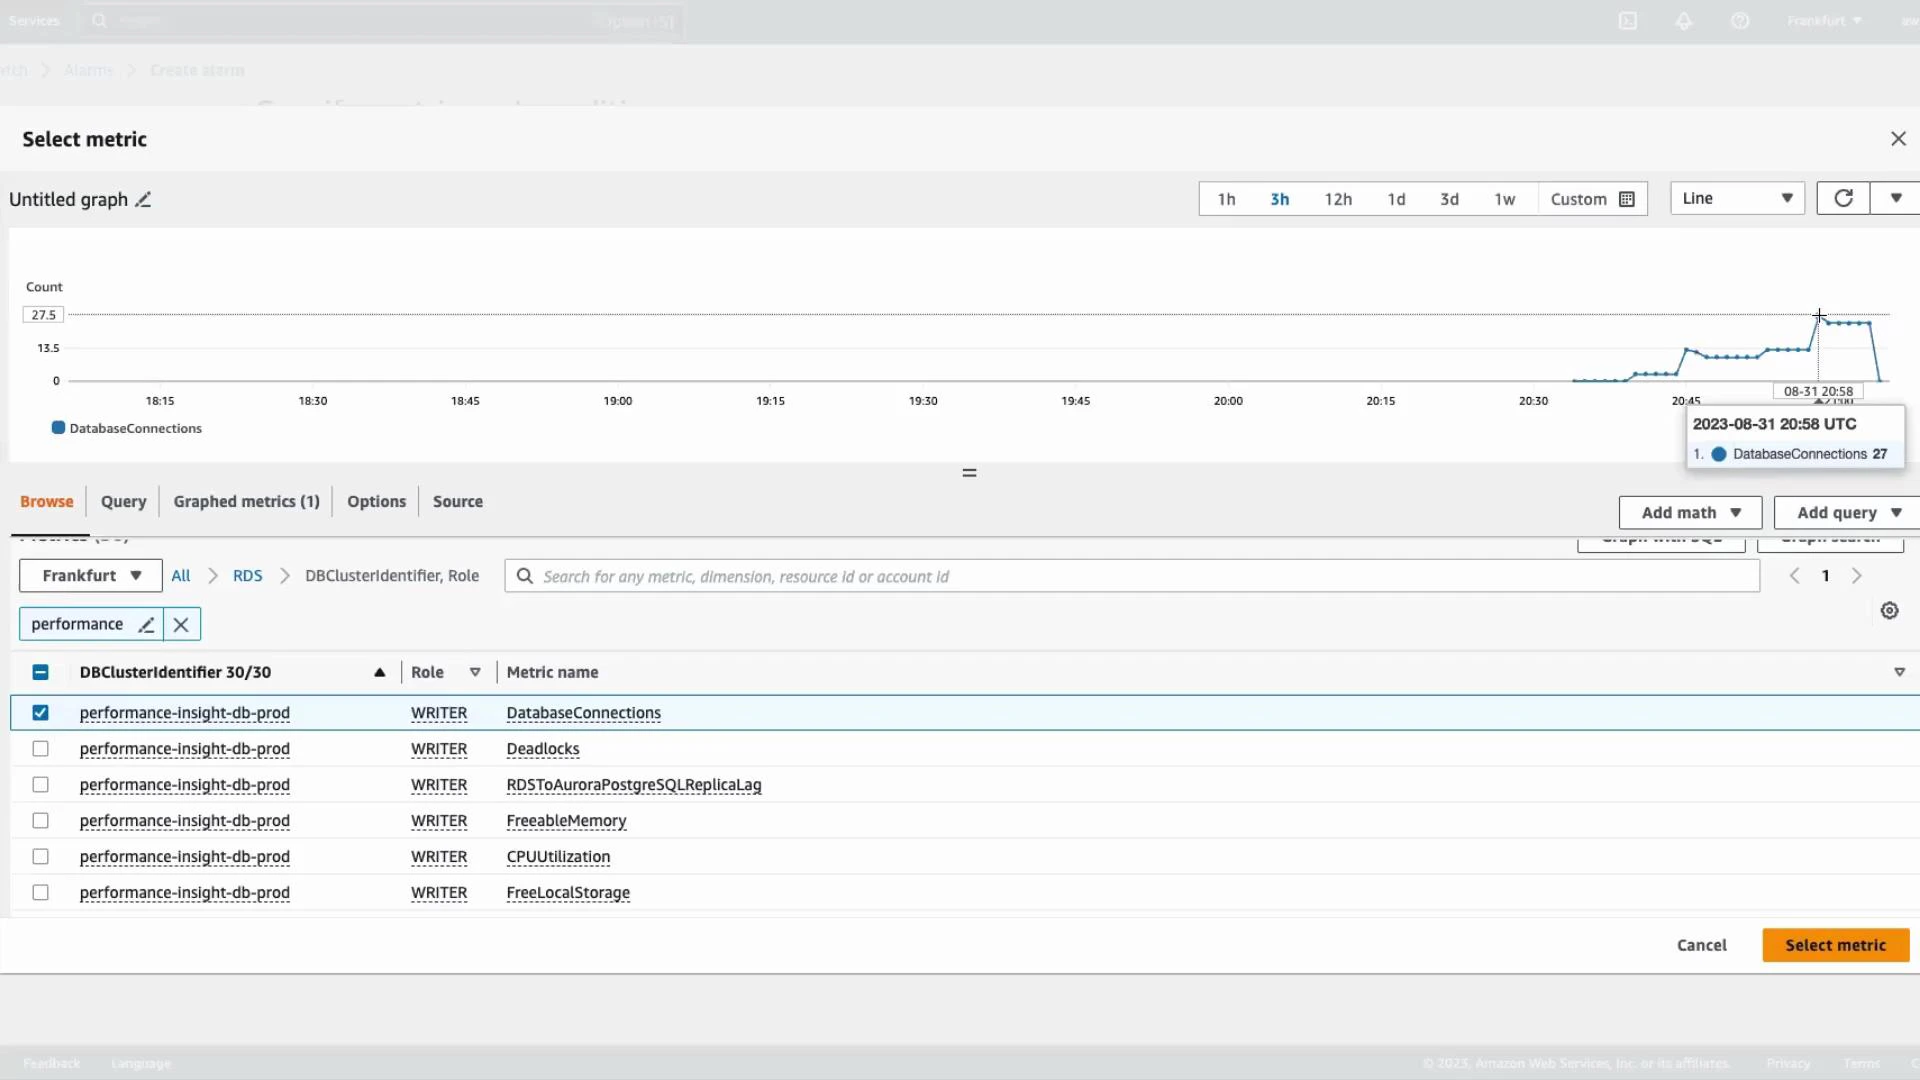
  2. Select a metric source: choose RDS and filter by your DB identifier/role (WRITER/READER). For this guide we’ll use the DatabaseConnections metric.
  3. Preview the time series to confirm you’re selecting the intended resource and timeframe.
A screenshot of an AWS CloudWatch/RDS metric selection screen showing a time-series graph of DatabaseConnections that rises to about 27. Below the graph is a selectable list of RDS metrics (DatabaseConnections, Deadlocks, FreeableMemory, CPUUtilization, etc.) for the performance-insight-db-prod cluster.
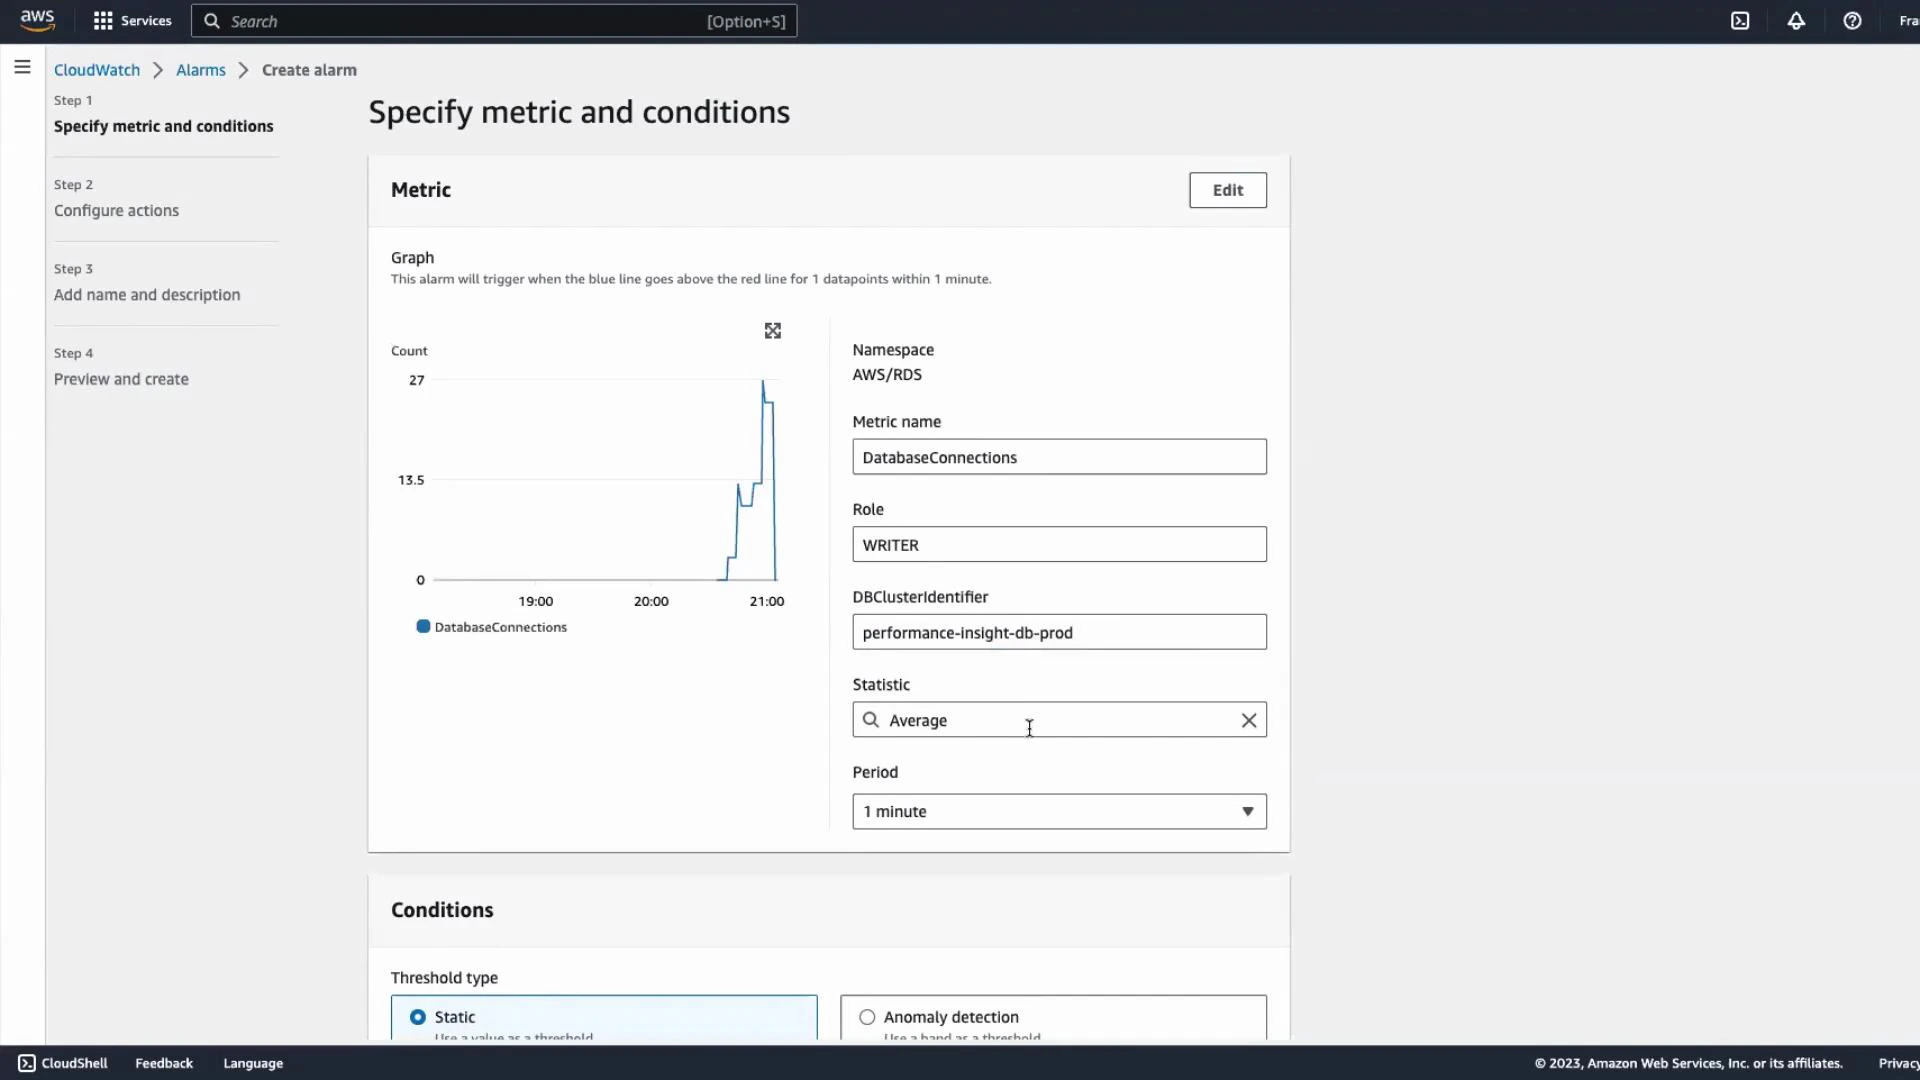
  1. Configure the metric evaluation:
    • Choose Statistic (e.g., Average) and Period (e.g., 1 minute) that match your desired sensitivity.
    • Set the evaluation period and datapoints to alarm according to how quickly you want alerts.
A screenshot of the AWS CloudWatch "Create alarm" screen configuring an RDS metric. It shows a rising DatabaseConnections graph on the left and form fields on the right for Namespace, Role, DBClusterIdentifier, Statistic, and Period.
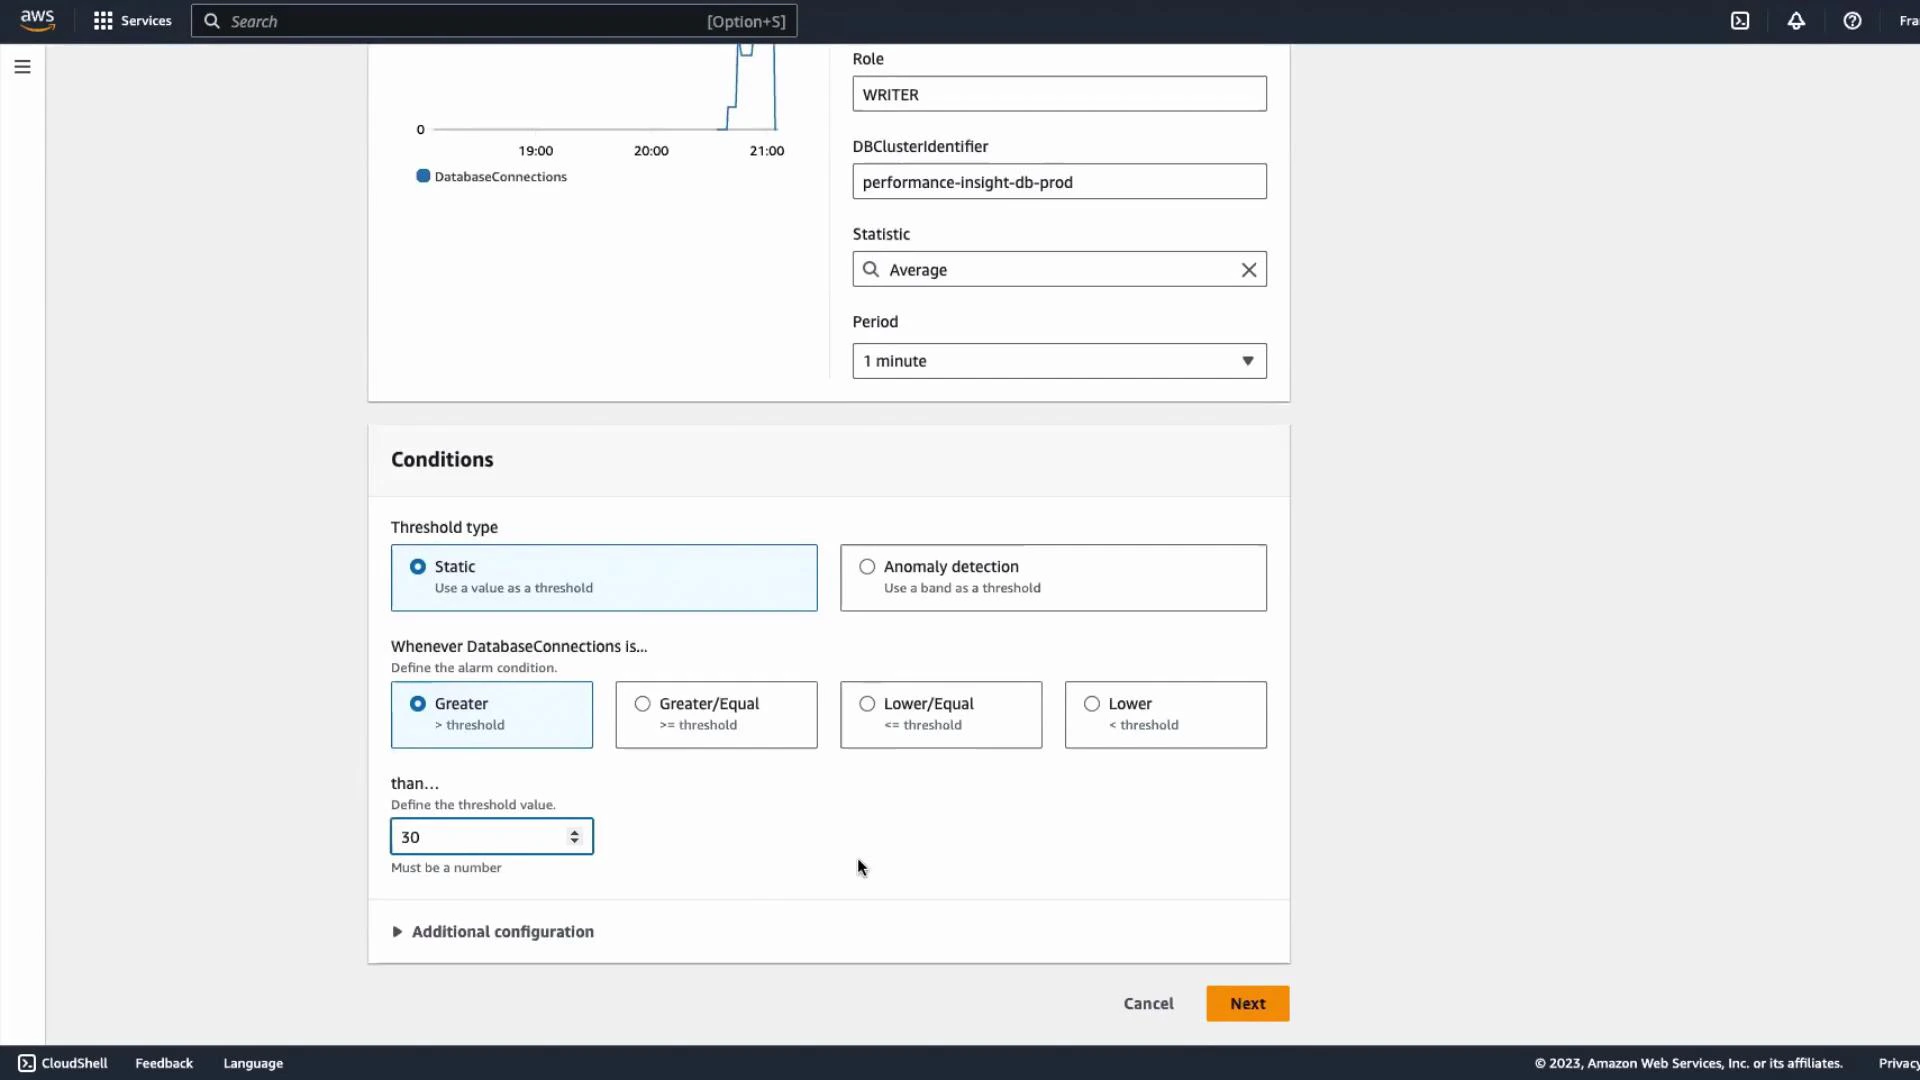
  1. Define the threshold. For this demo, use a static threshold:
    • Trigger when DatabaseConnections > 30.
    • Adjust threshold and evaluation windows for your production needs.
A screenshot of the AWS CloudWatch alarm configuration page showing the "Conditions" section with a Static threshold and the "Greater" comparison selected, set to a threshold value of 30 for DatabaseConnections. The top of the screen shows metric settings (Role: WRITER, DBClusterIdentifier, and Statistic: Average).
  1. Configure alarm actions:
    • Create or choose an existing SNS topic to send notifications (email, SMS, Lambda, HTTP endpoints).
    • Add subscribers (for example, an email address). You can create a new SNS topic as part of the alarm workflow.
Screenshot of the AWS CloudWatch alarm action setup showing options for alarm state triggers and creating an SNS topic. The form shows a topic name "Default_CloudWatch_Alarms_Topic" and an email endpoint field (user@example.com) for notifications.
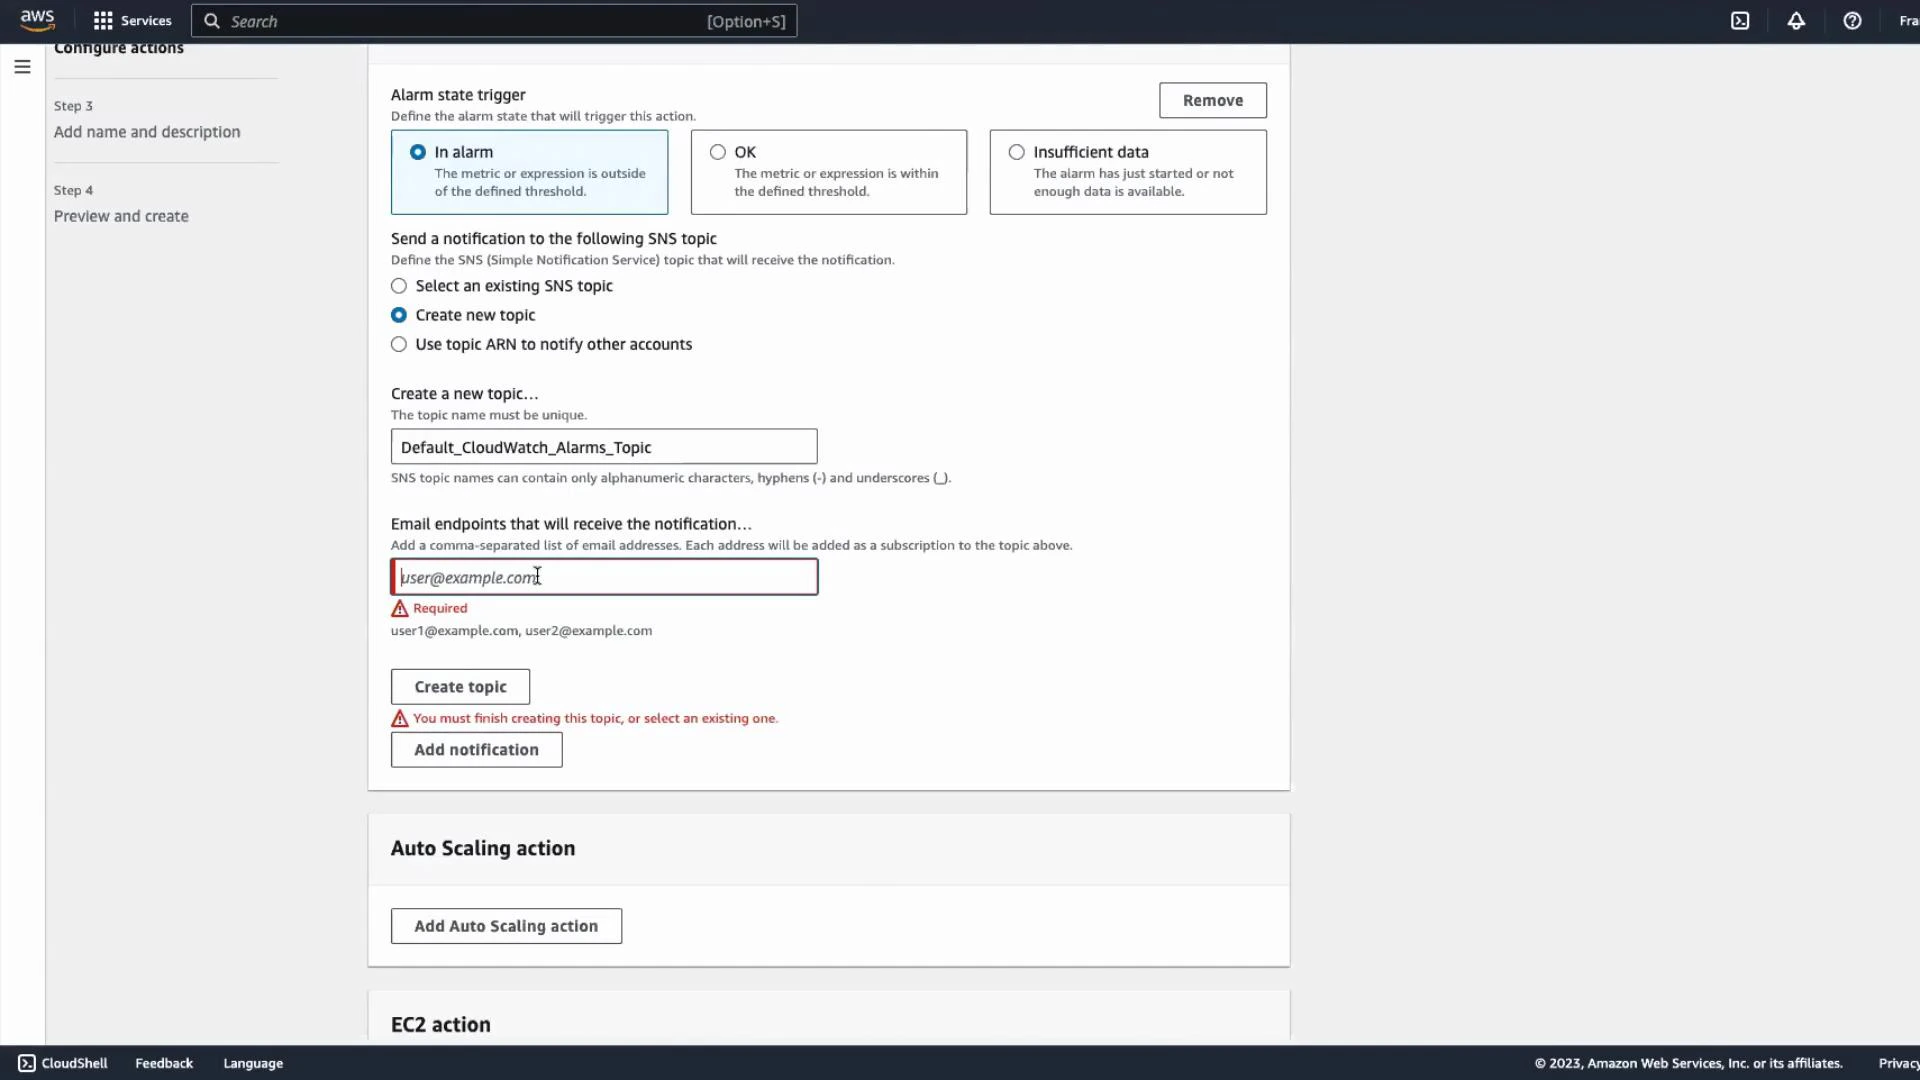
After creating an SNS topic and adding an email endpoint, you must confirm the subscription from the email inbox. Until the subscription is confirmed you will not receive alarm notifications.
  1. Name the alarm (for example, “High DB connections”) and create it. CloudWatch will evaluate the metric and change the alarm state to ALARM when conditions are met.

Simulate load to trigger the alarm

To demonstrate the alarm firing, you can run a short Python script that opens many concurrent connections to the DB. Replace the connection parameters with your own host, database, username, and password.
import threading
import psycopg2

def run_query(thread_id):
    try:
        conn = psycopg2.connect(
            host="your-db-host",
            port=5432,
            database="your_db",
            user="your_user",
            password="your_password"
        )
        cur = conn.cursor()
        print(f"Thread-{thread_id} connected to the database.")

        # Simple query
        cur.execute("SELECT 1;")
        cur.fetchone()
        print(f"Thread-{thread_id} fetched 1 record from Simple Query.")

        # Example "complex" query
        cur.execute("SELECT COUNT(*) FROM information_schema.tables;")
        cur.fetchone()
        print(f"Thread-{thread_id} fetched 1 record from Complex Query.")

    except Exception as e:
        print(f"Thread-{thread_id} error: {e}")
    finally:
        try:
            cur.close()
            conn.close()
            print(f"Thread-{thread_id} closed the database connection.")
        except Exception:
            pass

# Create 40 threads to simulate 40 concurrent sessions
threads = []
for i in range(1, 41):
    t = threading.Thread(target=run_query, args=(i,))
    threads.append(t)
    t.start()

for t in threads:
    t.join()
Sample console output (truncated):
Thread-3 connected to the database.
Thread-20 connected to the database.
Thread-29 connected to the database.
Thread-13 connected to the database.
Thread-6 connected to the database.
Thread-28 connected to the database.
Thread-37 connected to the database.
Thread-4 connected to the database.
Thread-26 connected to the database.
Thread-11 connected to the database.
Thread-14 connected to the database.
Thread-38 connected to the database.
Thread-31 connected to the database.
Thread-5 connected to the database.
Thread-16 connected to the database.
Thread-25 connected to the database.
Thread-9 connected to the database.
Thread-12 connected to the database.
Thread-17 fetched 1 record from Simple Query.
Thread-38 fetched 1 record from Complex Query.
Thread-33 fetched 1 record from Simple Query.
...
Thread-17 closed the database connection.
Thread-38 closed the database connection.
With enough concurrent connections, DatabaseConnections will exceed the threshold and the alarm will enter the ALARM state. When that happens, the configured SNS topic will notify subscribed endpoints (email, Lambda, webhook, etc.).
A screenshot of the AWS CloudWatch Alarms page showing a "High DB connection" metric alarm marked "In alarm." The graph displays DatabaseConnections spiking above the threshold line.
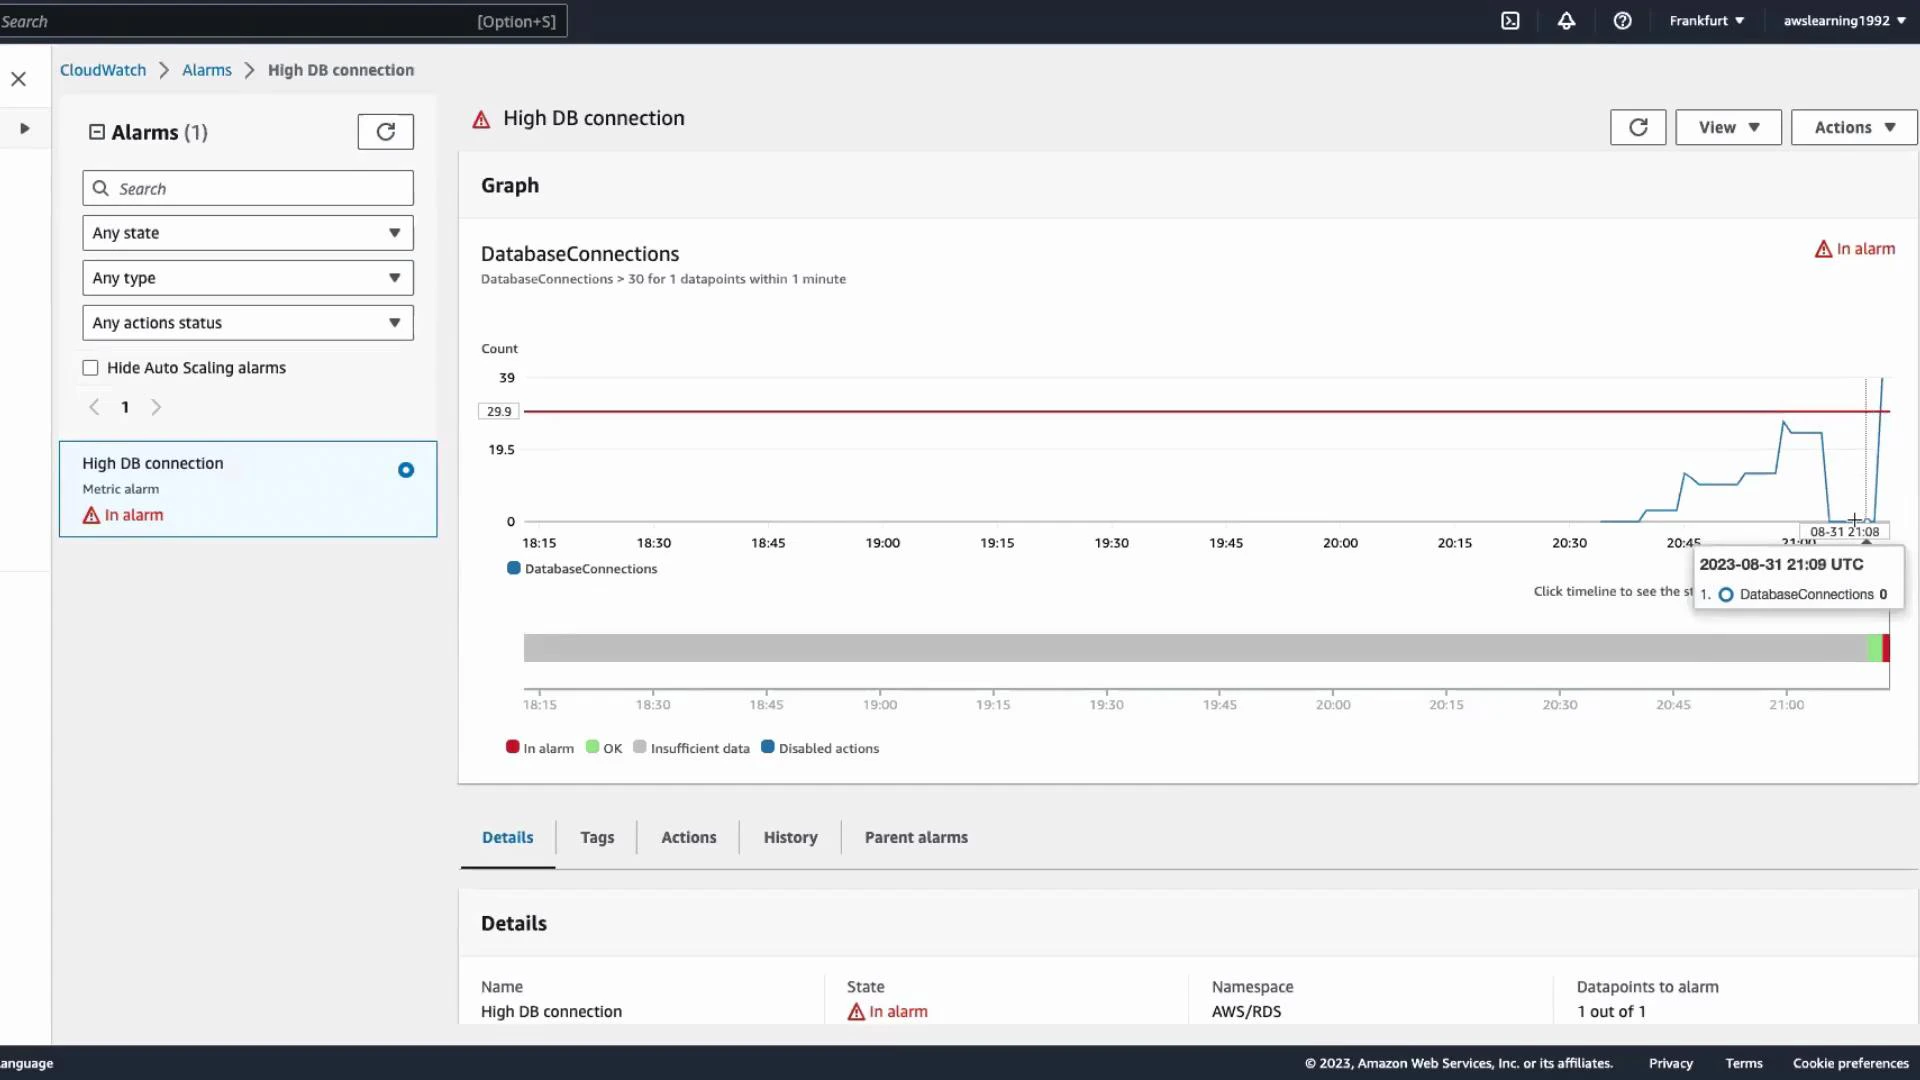
Do not run aggressive connection or load tests against production databases. Simulate load only against non-production environments or during controlled maintenance windows to avoid impacting users.

Common RDS metrics to monitor

MetricUse caseExample alert
DatabaseConnectionsTrack concurrent client sessionsAlert when > 30 connections (as demo)
CPUUtilizationDetect CPU saturationAlert when > 80% for 5 minutes
FreeableMemoryIdentify memory pressureAlert when < 200 MB
DeadlocksDetect locking problemsAlert when > 0 over 1 minute

Next steps and references

  • If you need automated remediation, subscribe a Lambda function to the SNS topic to run scripts or scaling actions.
  • Consider using dynamic thresholds or anomaly detection in CloudWatch for more adaptive alerting.
  • Combine Performance Insights with CloudWatch metrics to correlate query load and infrastructure signals.
Links and references: That is it for this lesson — speak with you in the next lesson.

Watch Video