Why monitor a cloud database?
- Proactive issue detection: surface small problems before they become outages with alerts and anomaly detection.
- Performance optimization: identify slow SQL, missing indexes, and resource bottlenecks to improve latency and throughput.
- Availability and reliability: track failover events, replica lag, and health checks to maintain SLAs.
- Capacity planning and cost control: use trends (CPU, memory, connections, I/O) to scale appropriately and reduce waste.
- If the DB CPU utilization consistently hovers around 80% on a general-purpose instance, monitoring shows evidence to move to a compute-optimized instance or scale read replicas. Trends and correlated query data make these decisions measurable rather than speculative.
Enable Performance Insights and relevant query logging (slow query logs, pg_stat_statements) to gain SQL-level context. These features improve troubleshooting but can add cost and storage overhead depending on retention.
What to monitor
Track a mix of infrastructure and database-specific metrics, plus logs and query diagnostics.AWS tools for monitoring RDS
-
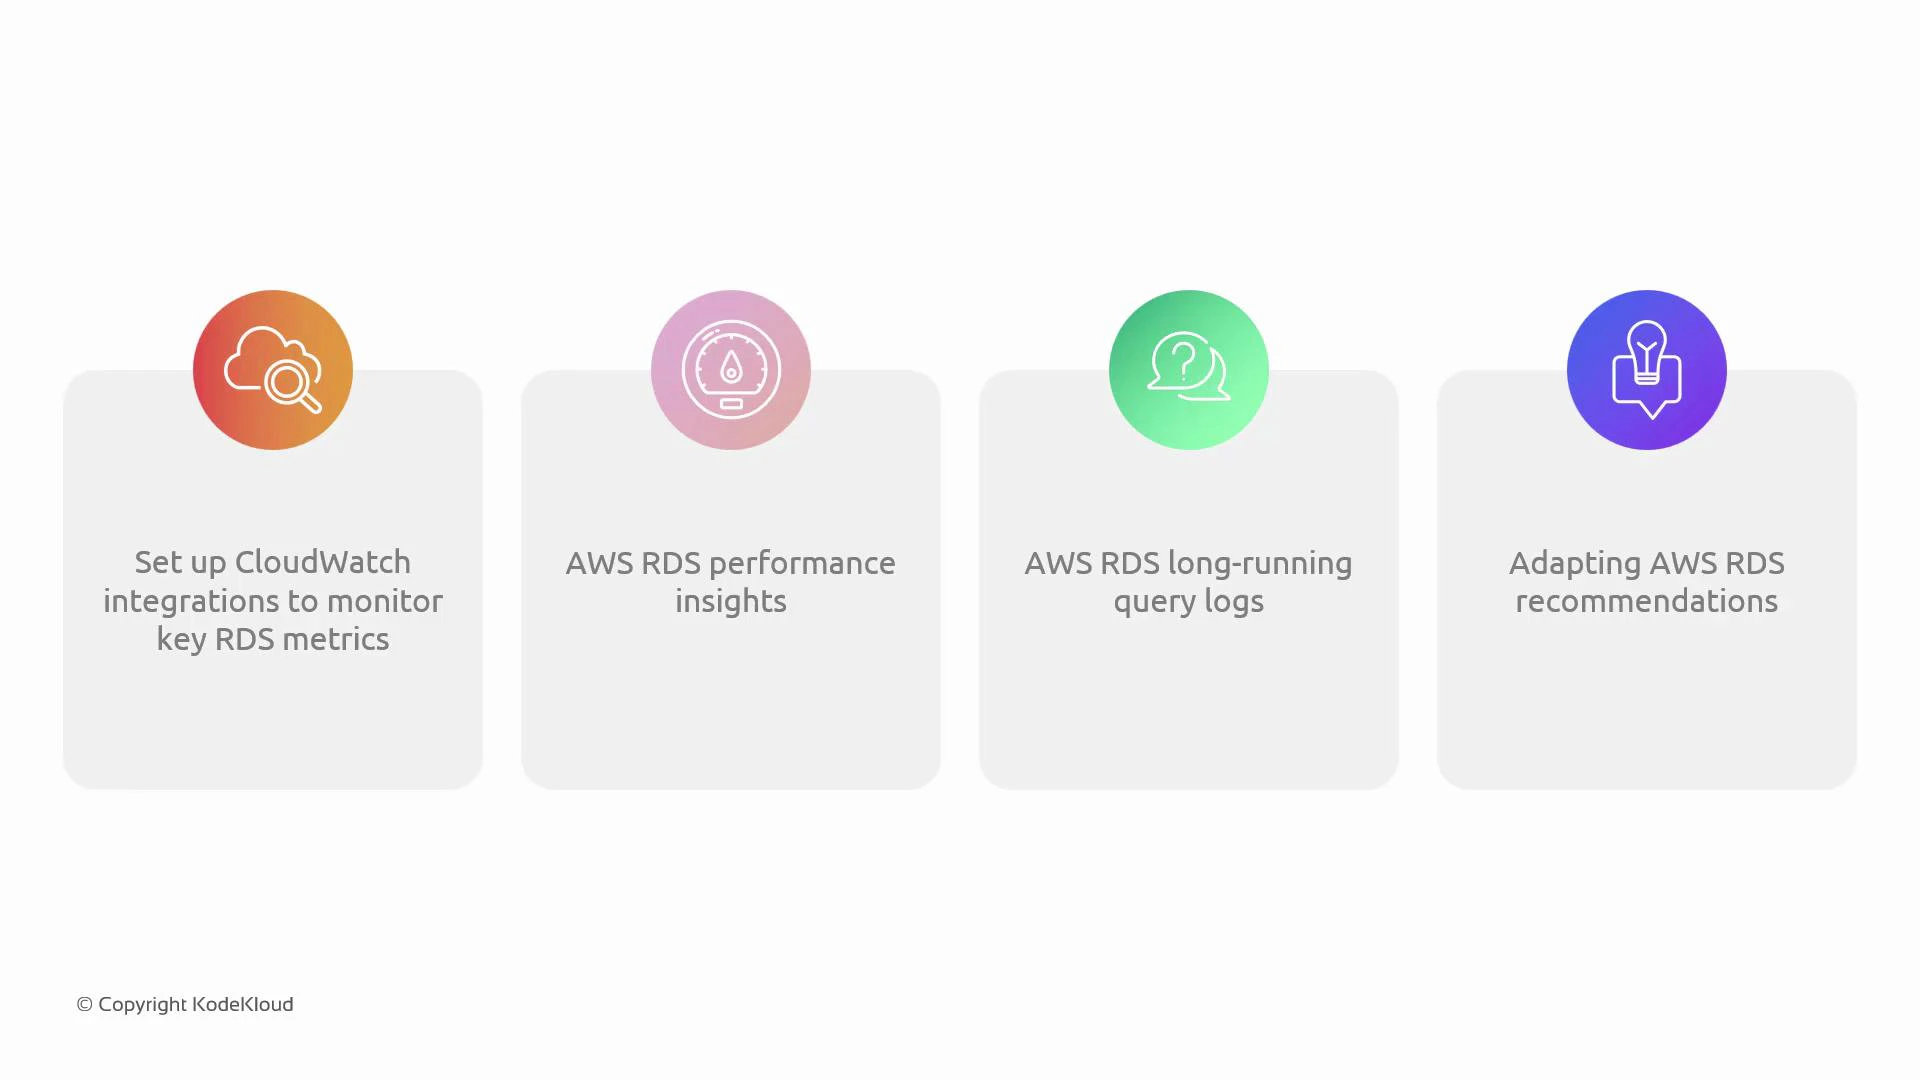
Amazon CloudWatch
Collects core RDS metrics (CPU, IOPS, latency, free storage, DB connections). Use CloudWatch Alarms and Dashboards for alerting and visual summaries. See CloudWatch metrics for Amazon RDS: https://docs.aws.amazon.com/AmazonRDS/latest/UserGuide/monitoring-cloudwatch.html -
RDS Enhanced Monitoring
Provides host-level (OS) metrics such as memory and swap. These metrics are published to CloudWatch Logs and are useful for diagnosing memory pressure and OS-level signals. More: https://docs.aws.amazon.com/AmazonRDS/latest/UserGuide/USER_Monitoring.OS.html -
RDS Performance Insights
Offers a DB-optimized dashboard showing load, top SQL, waits, and historical patterns. Enable per instance for deep SQL-level visibility. More: https://docs.aws.amazon.com/AmazonRDS/latest/UserGuide/USER_PerfInsights.html -
Database engine logs and query instrumentation
- MySQL: general and slow query logs
- PostgreSQL: pg_stat_statements, log_min_duration_statement
Export logs to CloudWatch Logs or S3 for retention, searching, and integration with alerting.
-
RDS Recommendations & Trusted Advisor
RDS console may surface sizing or configuration recommendations; review these to improve cost and performance.
Quick examples (AWS CLI)
Create a CloudWatch alarm for CPU utilization:Output:
CLI
Alerts and playbooks
Design alerts to be actionable and reduce noise:- Prefer multi-period or anomaly-based alerts to avoid false positives (e.g., sustained 5–15 minutes).
- Correlate alerts across metrics (CPU + I/O + slow queries) to prioritize root cause.
- Create runbooks for common alerts: slow queries, replica lag, full storage, connection storms, and failover events.
- Channel alerts to the right teams (DBA, platform, on-call) and include recovery steps.
Enabling Performance Insights, increased log retention, or high-frequency monitoring can increase costs. Review retention settings and retention policies to balance visibility and expense.
Monitoring goals (summary)
- Detect anomalies before users are impacted.
- Reduce mean time to resolution (MTTR) using correlated metrics and query-level data.
- Maintain availability through automated failover monitoring and replica health checks.
- Optimize capacity and costs with trend-driven scaling decisions.
- Enable Enhanced Monitoring and Performance Insights on an RDS instance.
- Configure CloudWatch Alarms and Dashboards.
- Capture slow query logs and analyze top offenders.
- Execute an incident runbook for a simulated replication lag or CPU spike.
Links and references
- Amazon RDS Monitoring with Amazon CloudWatch: https://docs.aws.amazon.com/AmazonRDS/latest/UserGuide/monitoring-cloudwatch.html
- RDS Enhanced Monitoring: https://docs.aws.amazon.com/AmazonRDS/latest/UserGuide/USER_Monitoring.OS.html
- RDS Performance Insights: https://docs.aws.amazon.com/AmazonRDS/latest/UserGuide/USER_PerfInsights.html
- CloudWatch Logs: https://docs.aws.amazon.com/AmazonCloudWatch/latest/logs/WhatIsCloudWatchLogs.html