In this tutorial, we’ll use Trivy—the open-source vulnerability scanner from Aqua Security—to analyze a base image defined in your Dockerfile. Trivy can operate in standalone or client-server mode and supports three artifact types:
  • Container images
  • File systems
  • Git repositories
Throughout this guide, we’ll focus on scanning container images with Trivy’s Docker image.
Refer to the official Trivy Documentation for detailed information on supported targets and scanning modes.
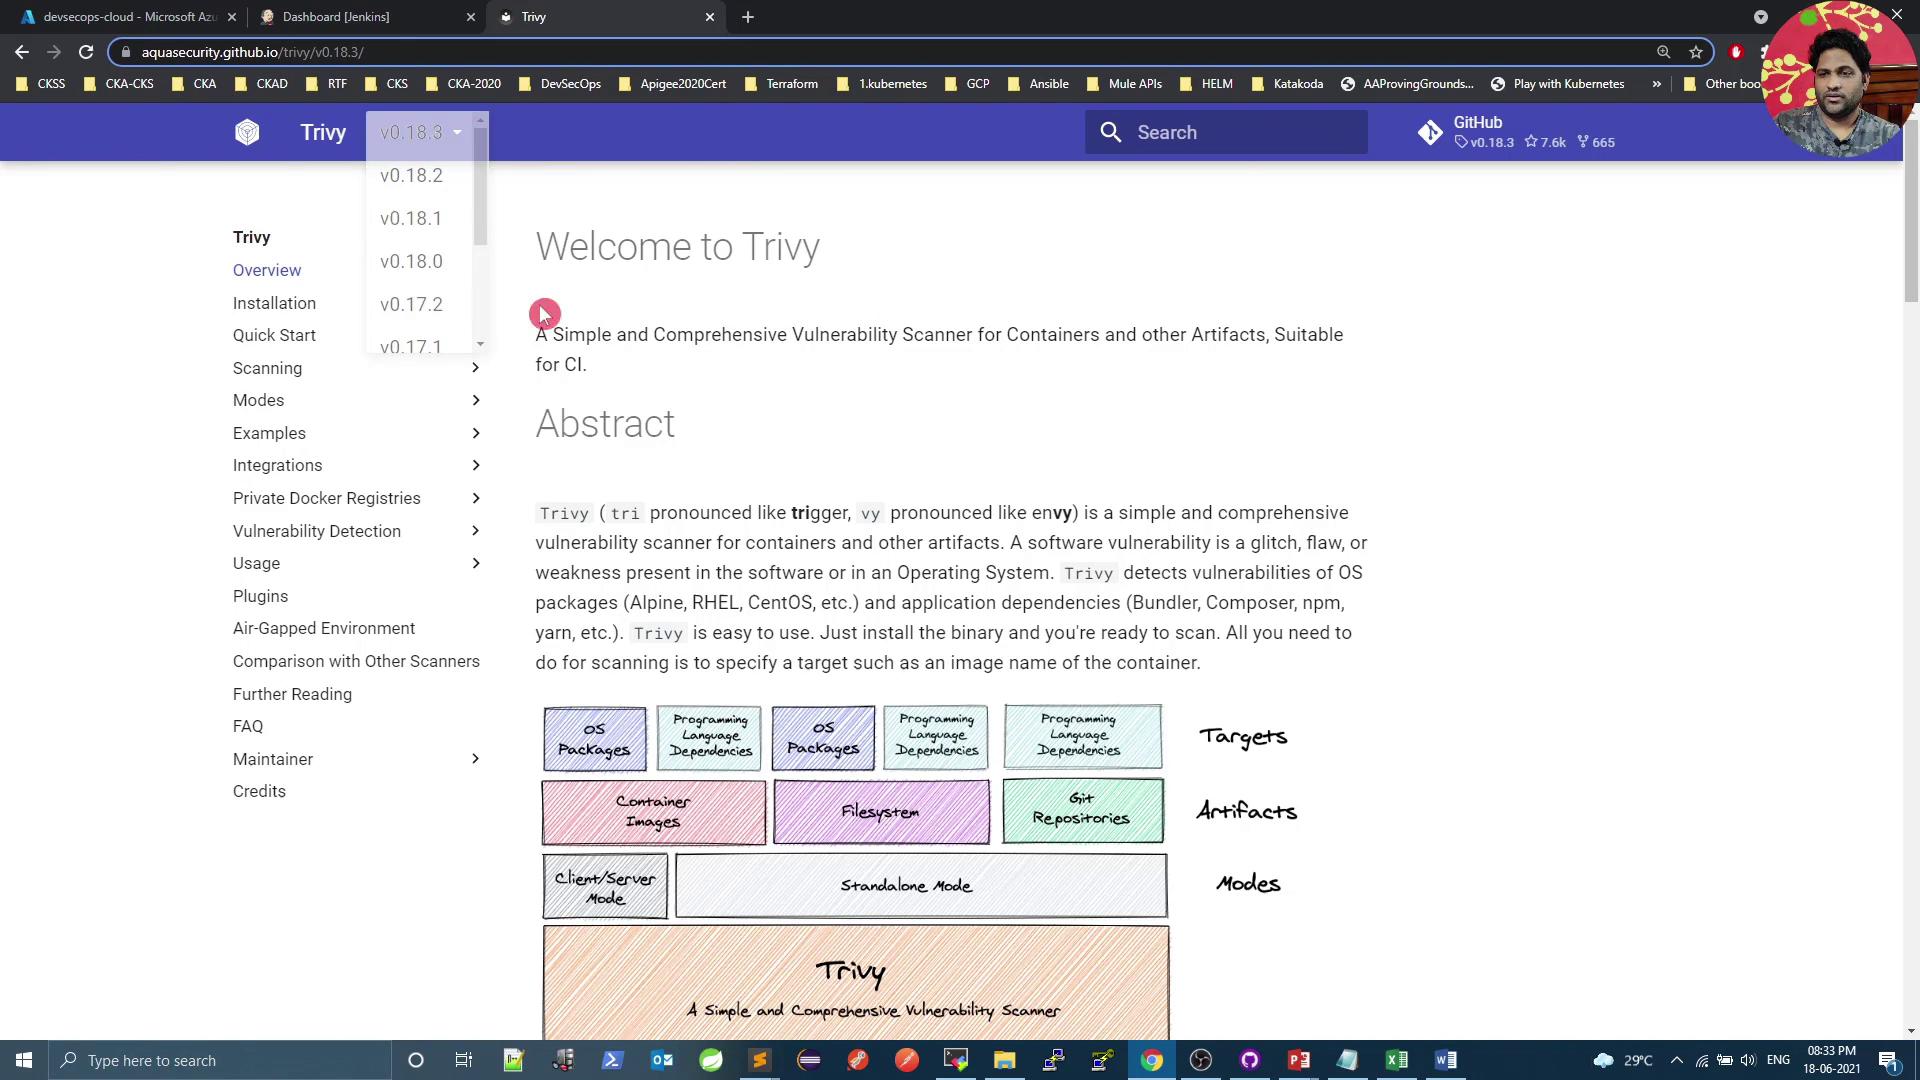
The image shows a webpage for Trivy, a vulnerability scanner for containers and other artifacts, with a menu on the left and an abstract section describing its features. There is also a diagram illustrating different targets, artifacts, and modes.

Installation

You can install Trivy as a native binary or pull the official Docker image.

RPM-based Systems

Debian-based Systems

Docker Image


Trivy Scanning Targets & Modes


Quick Scan with Trivy Docker Image

Scan the python:3.4-alpine image and cache the vulnerability database locally:
Sample output:
Mounting a cache directory speeds up repeated scans by storing the vulnerability database locally.

Filtering by Severity

To report only CRITICAL vulnerabilities:
Sample output:
By default, Trivy exits with code 0 even if vulnerabilities are found. Use --exit-code to enforce build failures in CI/CD.

Using Custom Exit Codes

Fail CI pipelines on CRITICAL issues:
Ignore LOW severity issues while still failing on HIGH+:

Integrating Trivy in a Jenkins Pipeline

Scan the base image before building and pushing Docker artifacts. Below is a sample declarative Jenkinsfile:

Creating the Trivy Scan Script

Add a file named trivy-docker-image-scan.sh at the repository root:
Make the script executable:

Verifying in Jenkins

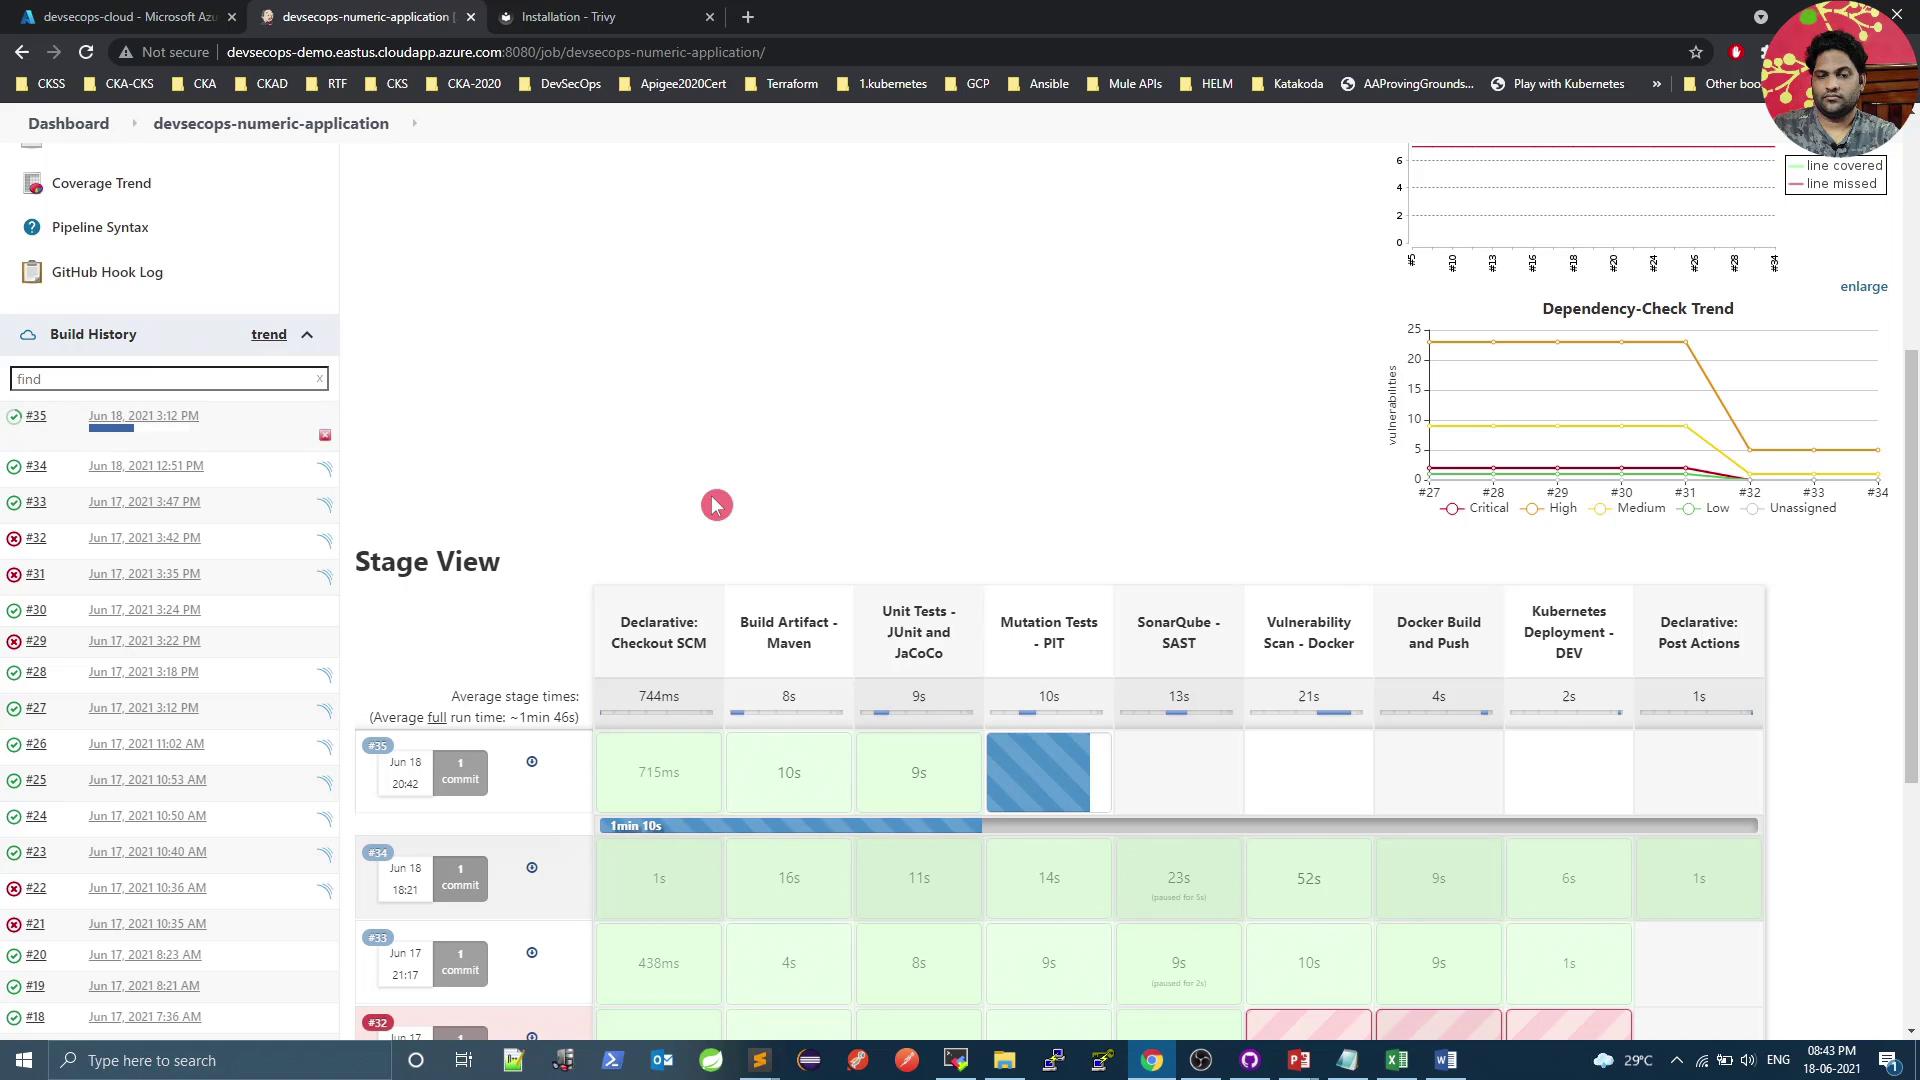
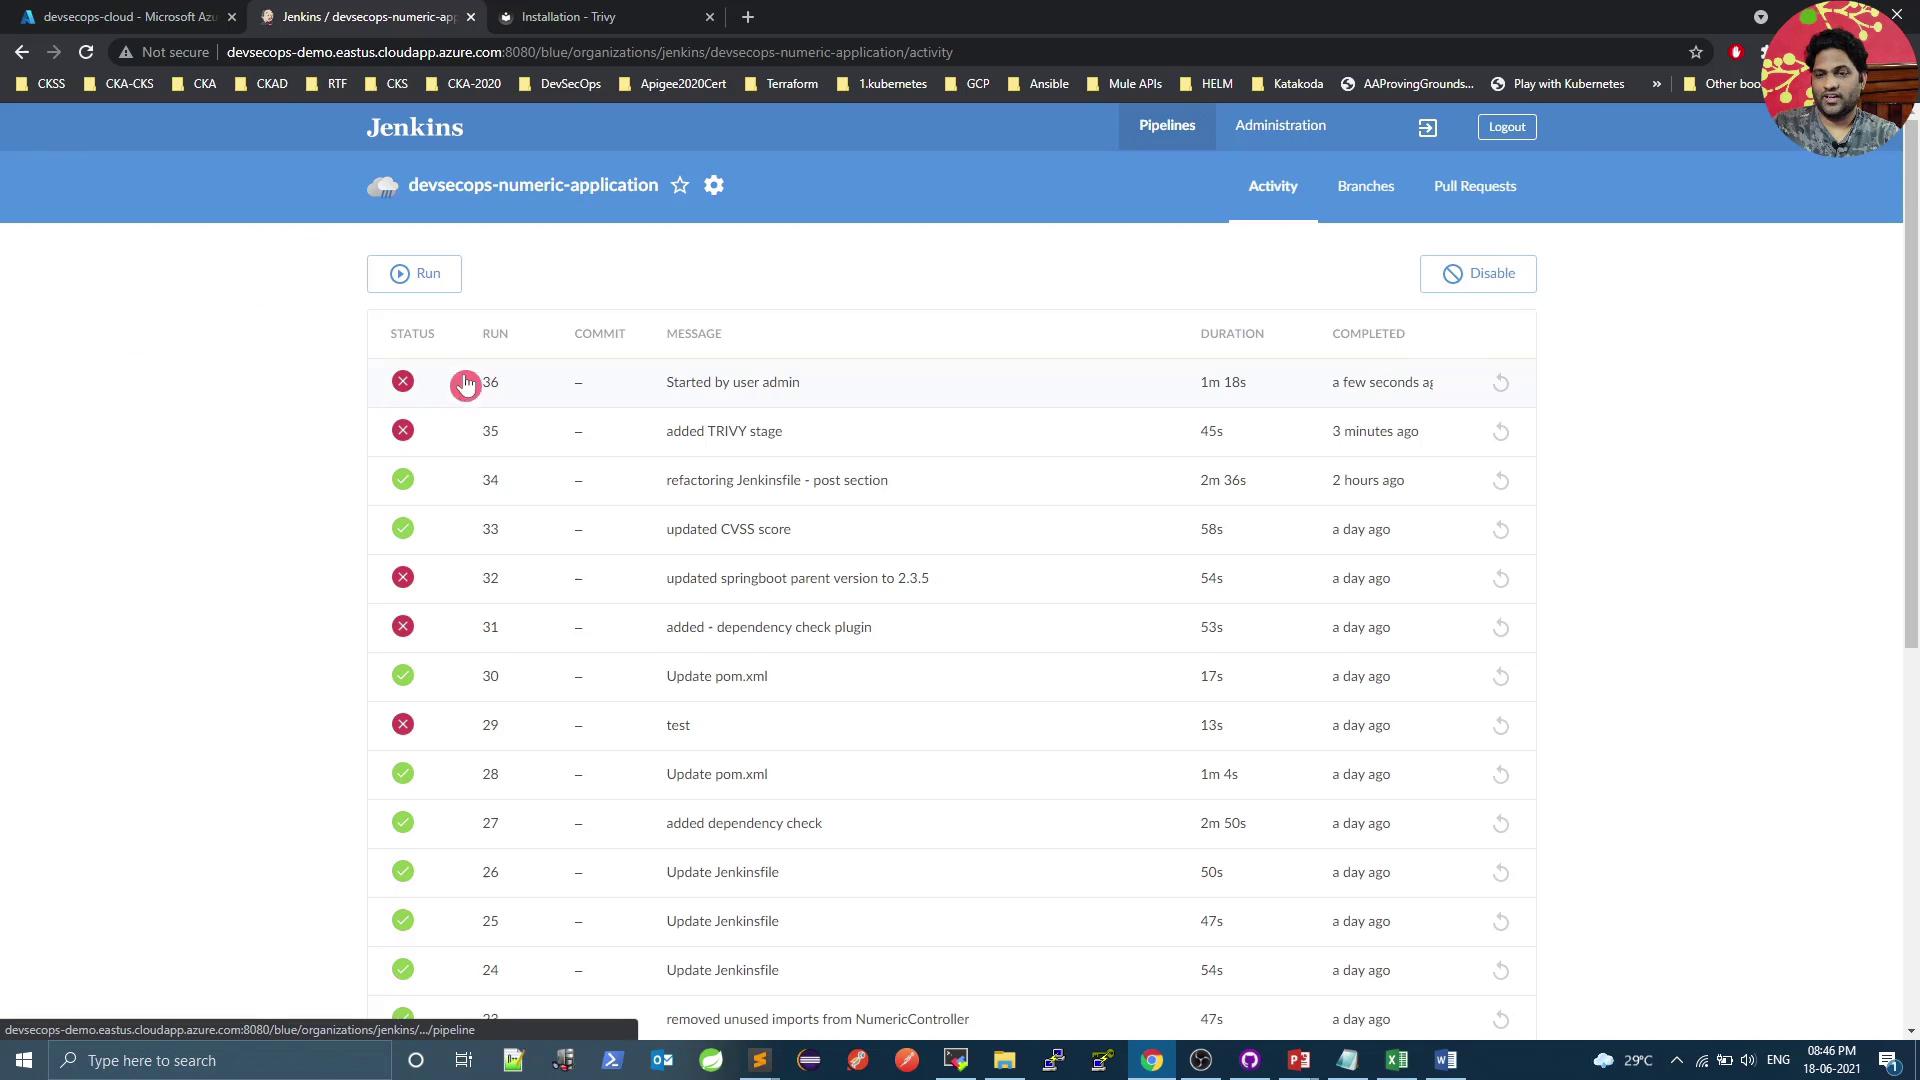
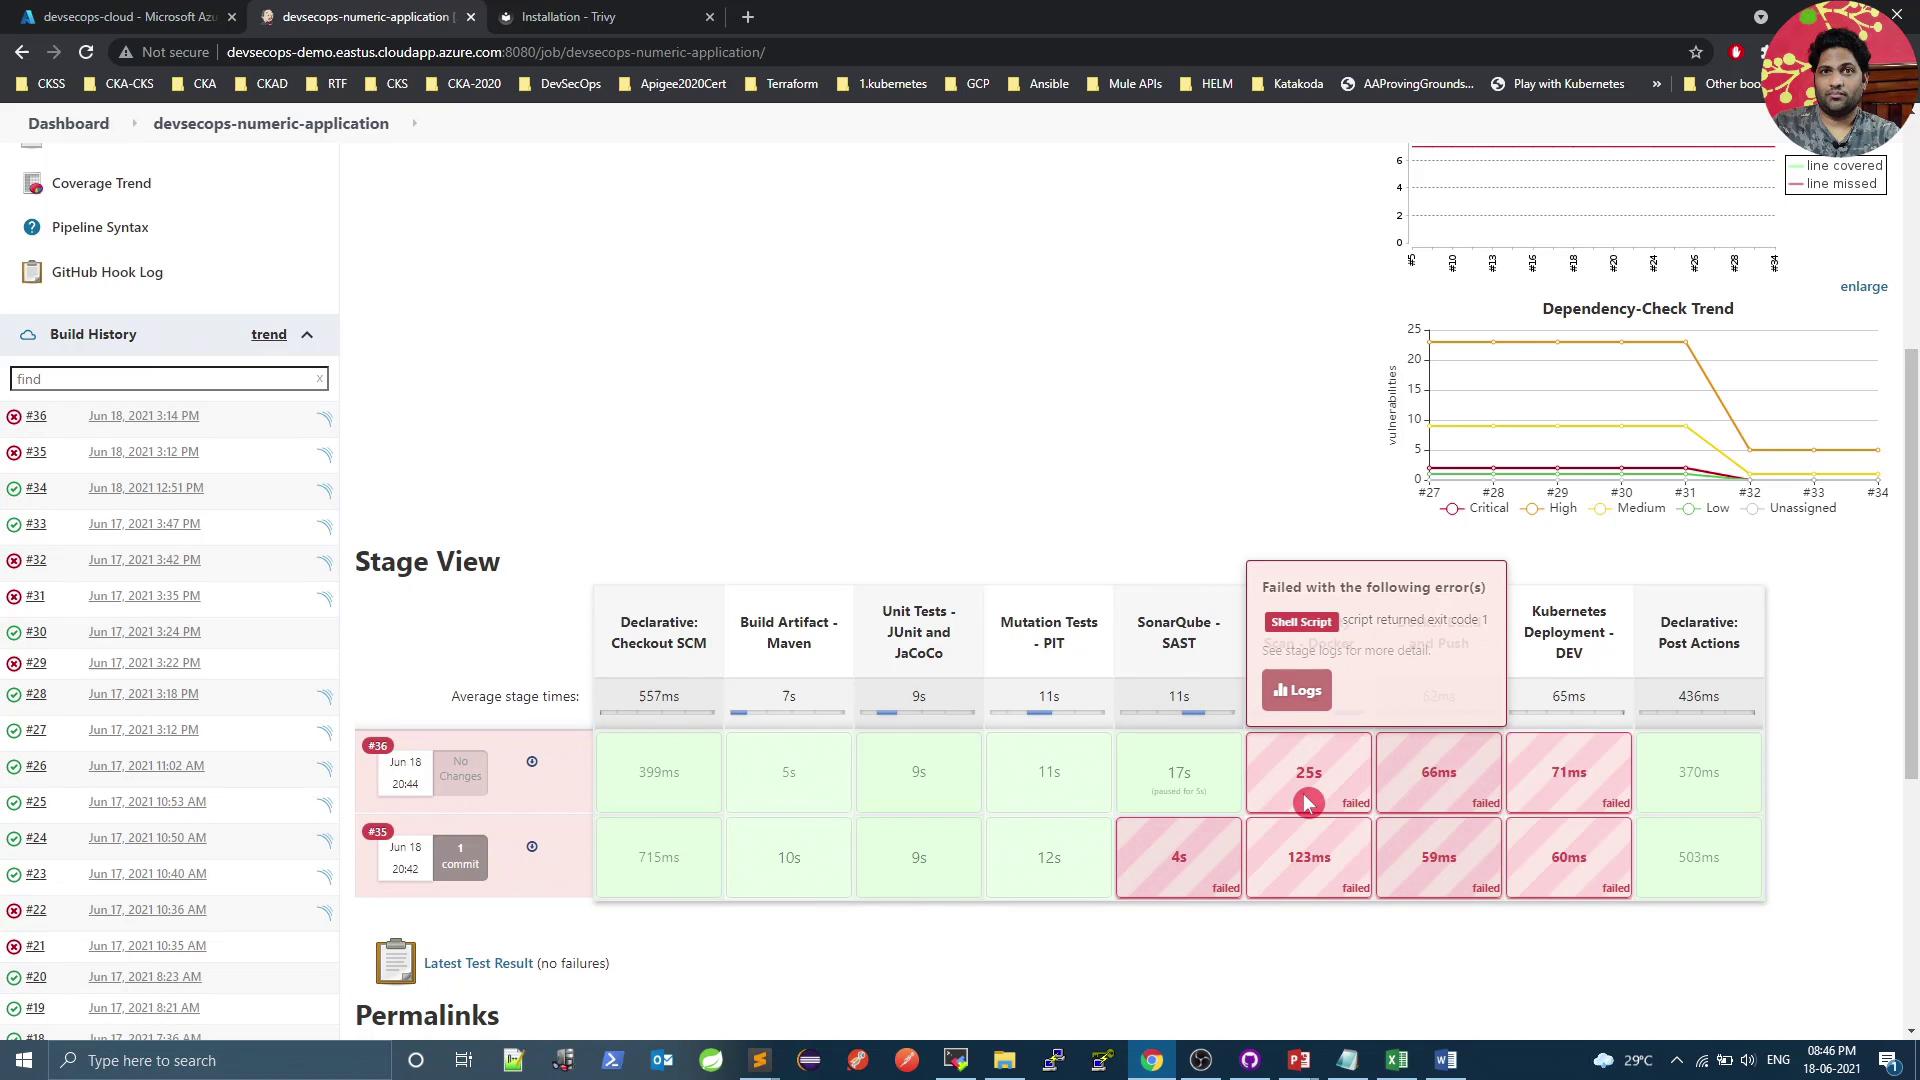
Commit and push your changes. Trigger a Jenkins build to see two parallel steps under the Vulnerability Scan – Docker stage:
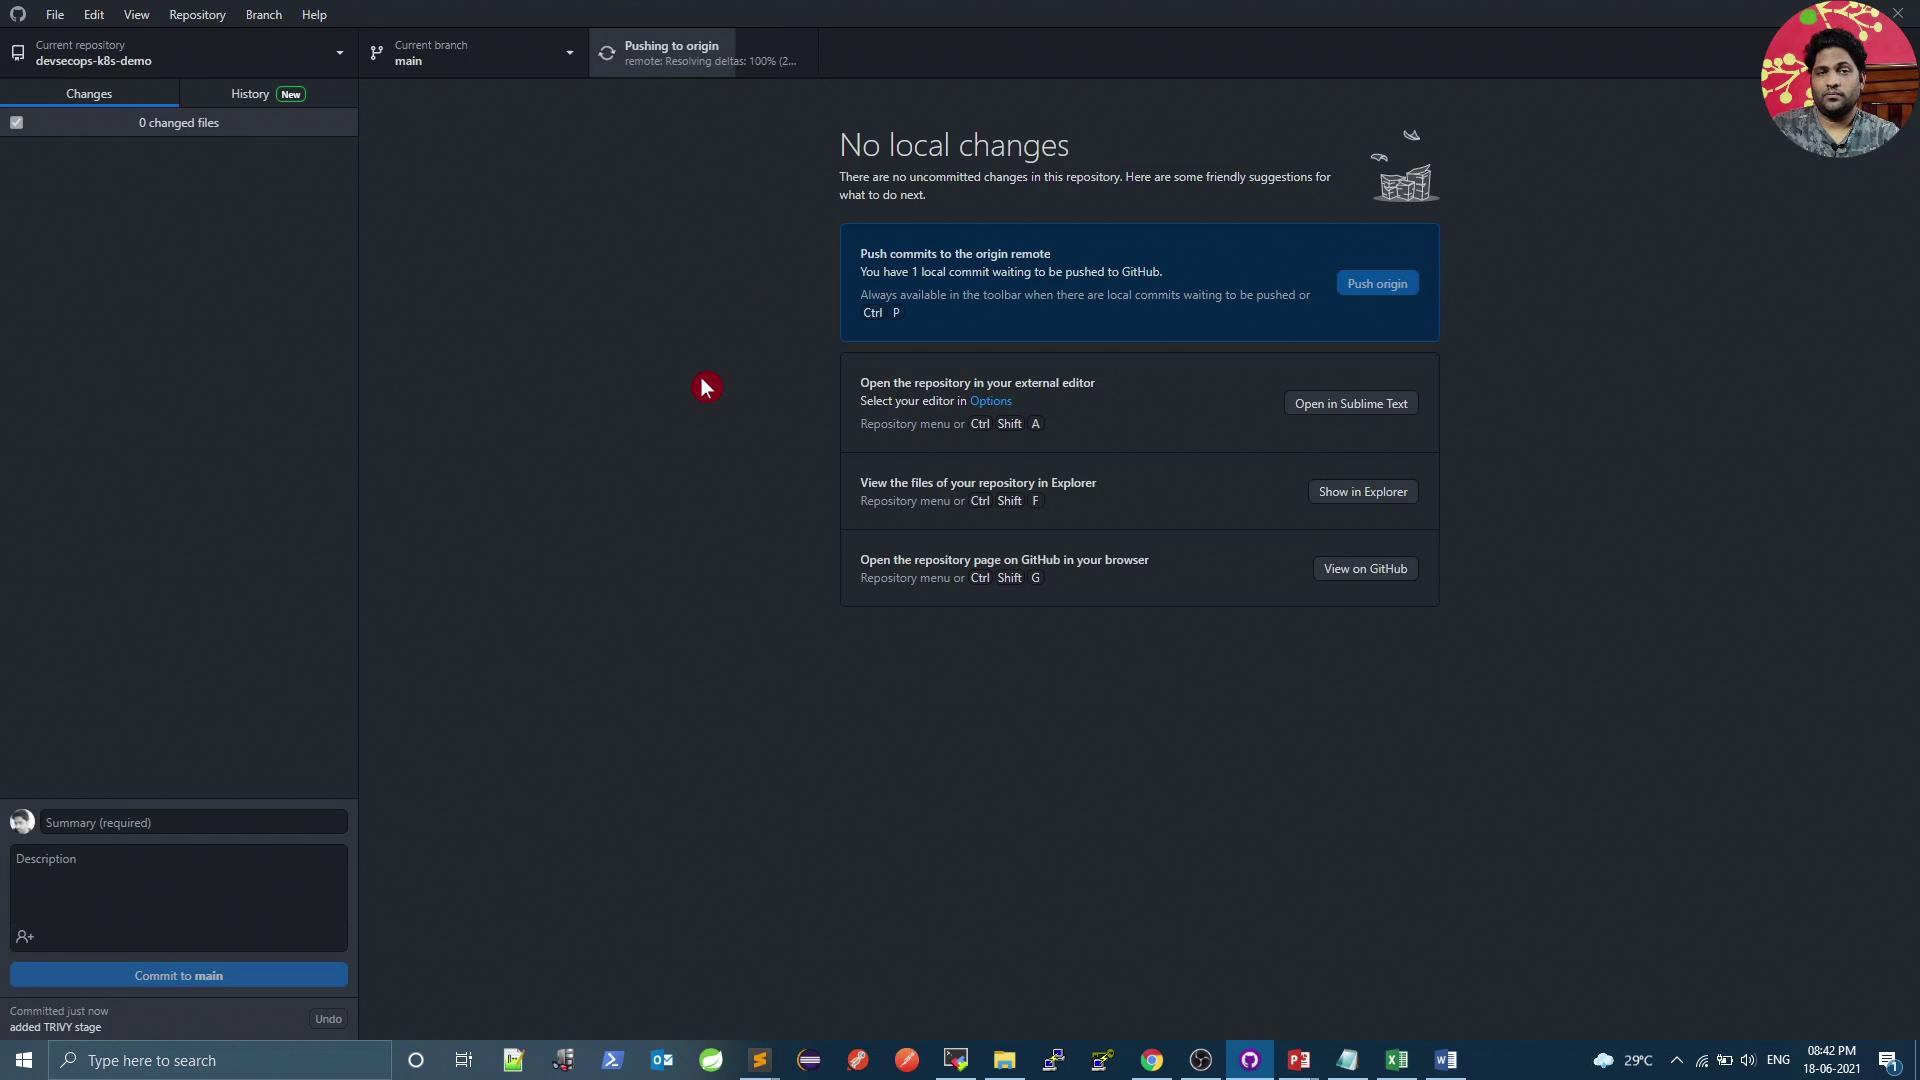
The image shows a GitHub Desktop interface with no local changes and options to push commits, open the repository in an editor, view files in Explorer, or open the repository on GitHub. A profile picture is visible in the top right corner.
The image shows a Jenkins dashboard with a list of projects, including "checking-versions" and "devsecops-numeric-application," displaying their last success, last failure, and duration. The interface includes navigation options on the left and a user profile icon on the top right.
The image shows a Jenkins pipeline dashboard with a stage view of a build process, including stages like SCM checkout, Maven build, unit tests, and vulnerability scans. It also features graphs for coverage and dependency-check trends.
The image shows a Jenkins dashboard displaying a list of pipeline builds for a project named "devsecops-numeric-application," with their statuses, run numbers, commit messages, durations, and completion times.
The image shows a Jenkins dashboard with a pipeline stage view, including build history and error logs. It displays various stages of a build process, some of which have failed, indicated by red highlights.

Watch Video