

Kubernetes Monitoring Overview
To maintain reliability and performance, monitor:- Cluster & Node Metrics: CPU, memory usage, availability, capacity
- Deployment & Pod Status: Desired vs. running replicas, CrashLoopBackOff errors
- Pod Resource Consumption: Requests and limits for CPU/memory
- Application-Level Health: Latency, throughput, error rates
Without persistent storage, short-lived metrics are lost and you miss critical events that could help diagnose incidents.
Built-in Monitoring Tools
Kubernetes includes several basic monitoring components:For production environments requiring SLA guarantees, these out-of-the-box tools are insufficient. Plan for a full monitoring stack.
Advanced Open-Source Monitoring with Prometheus and Grafana
For comprehensive observability, combine Prometheus for metrics scraping/storage with Grafana for visualization and alerting.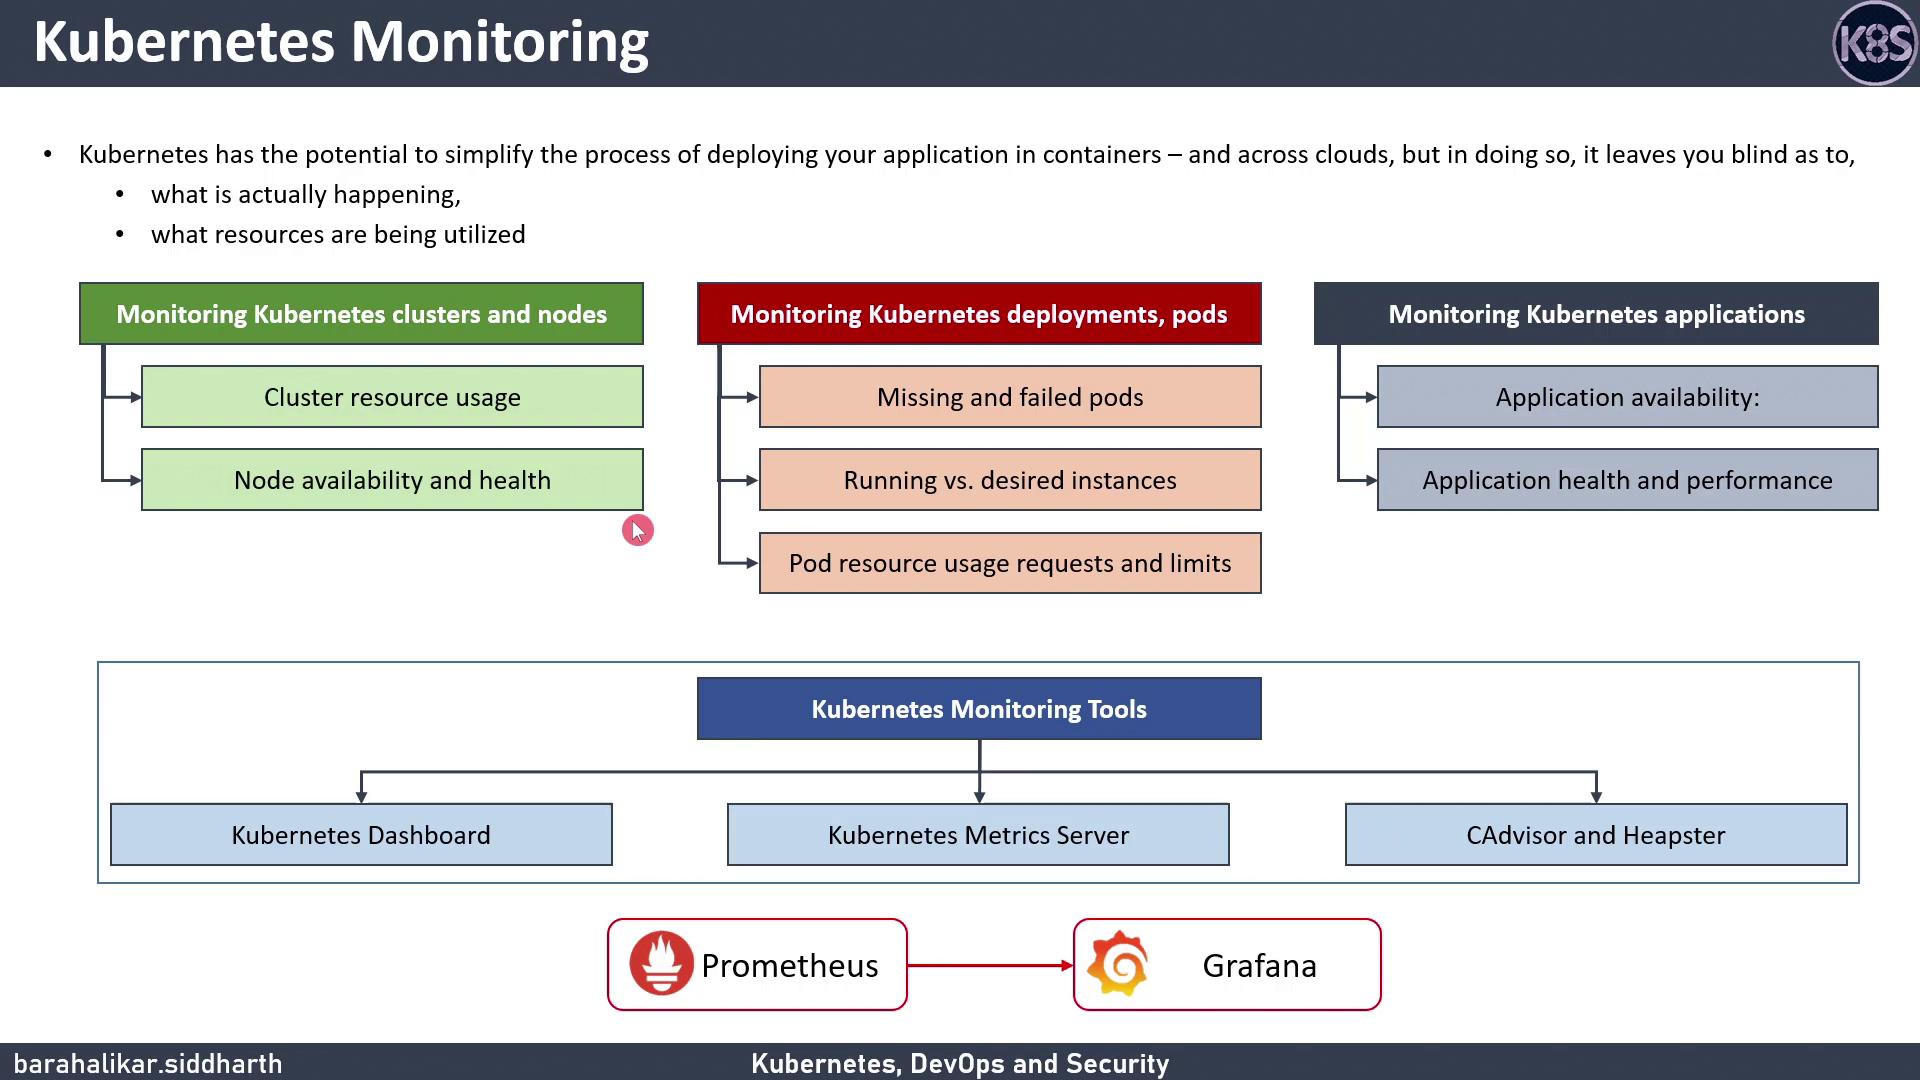
-
Add and update Helm repos:
-
Install Prometheus:
-
Install Grafana:
-
Forward ports to access UIs:
After first login to Grafana (default credentials
admin/admin), immediately update the password and configure your data source.- Persist historical metrics for capacity planning
- Build custom dashboards to visualize CPU, memory, and application metrics
- Configure alerts in Prometheus Alertmanager to detect anomalies