

Prerequisites
- A running Kubernetes cluster (version compatible with Istio 1.9.0)
kubectlconfigured to interact with your cluster
Step 1: Download and Install Istio
1.1 Download Istio 1.9.0
Fetch the installer script and extract the release:1.2 Install the Demo Profile
The demo profile is preconfigured with observability add-ons for testing and learning. It is not recommended for production environments.
1.3 Verify Installation Output
After installation, you should see messages similar to:Step 2: Istio Components Overview
Once installed, Istio deploys core control-plane components and add-ons. Here’s what you get: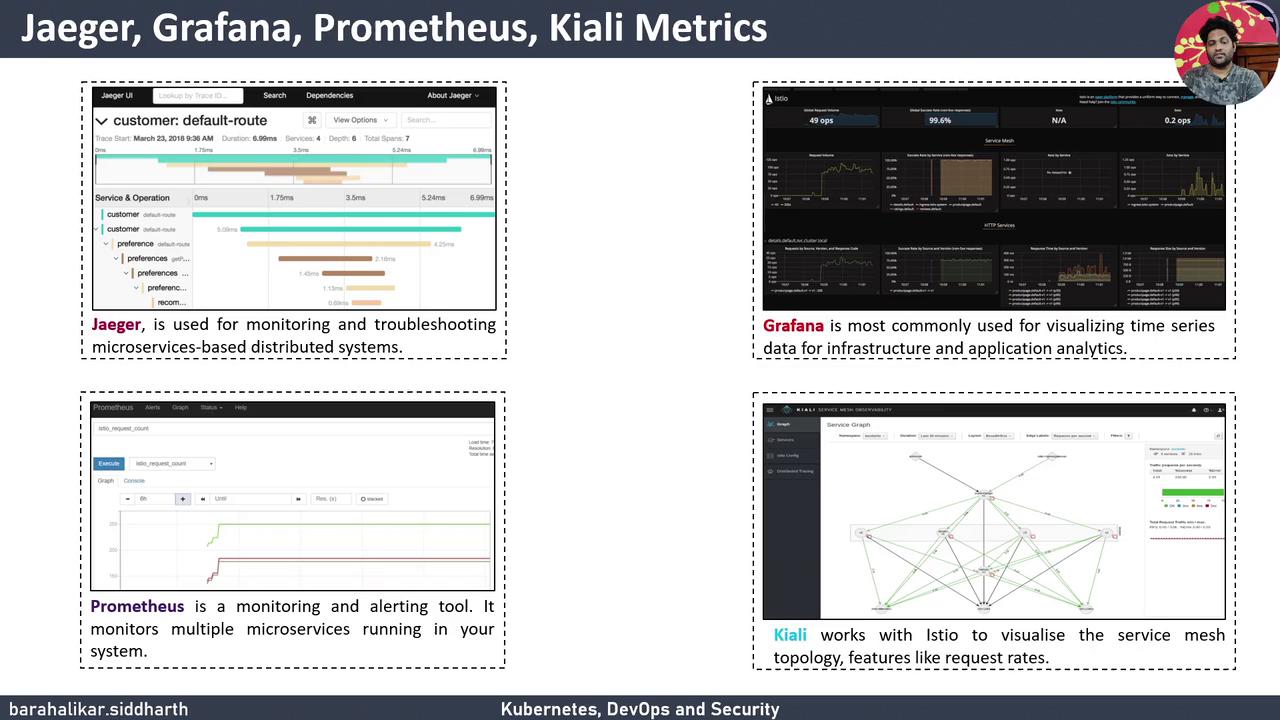
Step 3: Verify the Control Plane and Add-ons
3.1 List All Istio Resources
Run:Step 4: Enable Automatic Sidecar Injection
Label your application namespace to inject Envoy sidecars automatically:Enabling sidecar injection will add an Envoy proxy to every pod in the
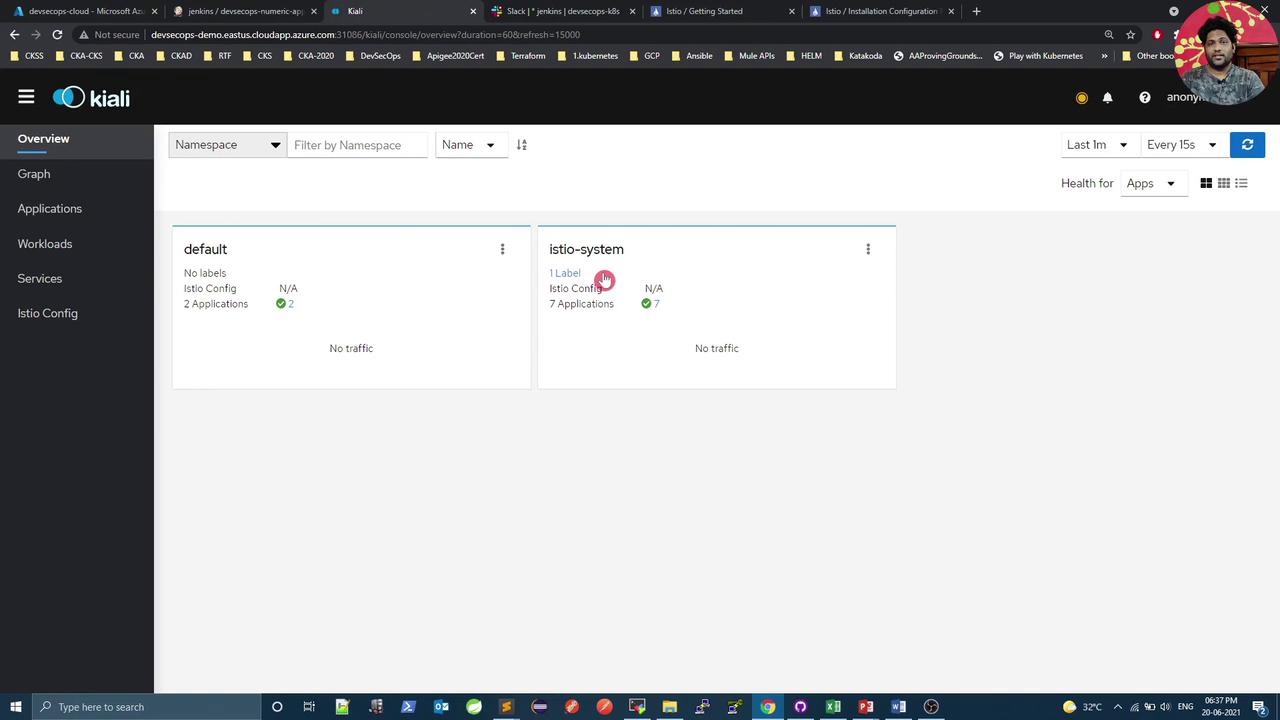
default namespace. Ensure your workloads are compatible.Step 5: Access the Kiali Dashboard
By default, Kiali’s service isClusterIP. To expose it on a NodePort:
5.1 Change Service Type
5.2 Retrieve and Use the NodePort
Links and References
- Istio Documentation
- Kubernetes Basics
- Kiali Project
- Prometheus Documentation
- Grafana Documentation
- Jaeger Documentation