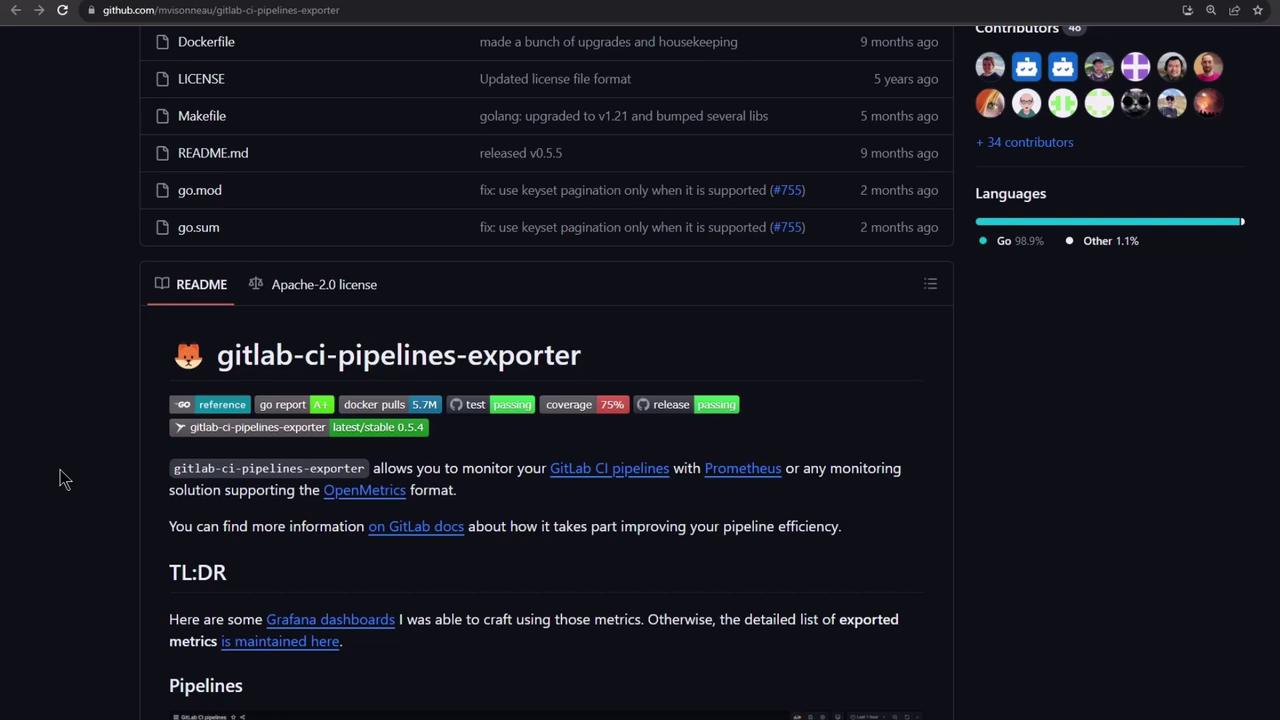
In this guide, we’ll architect a centralized monitoring solution for all your GitLab CI/CD pipelines using the GitLab CI Pipelines Exporter , Prometheus, and Grafana. Collect metrics across multiple projects and visualize them in real time.
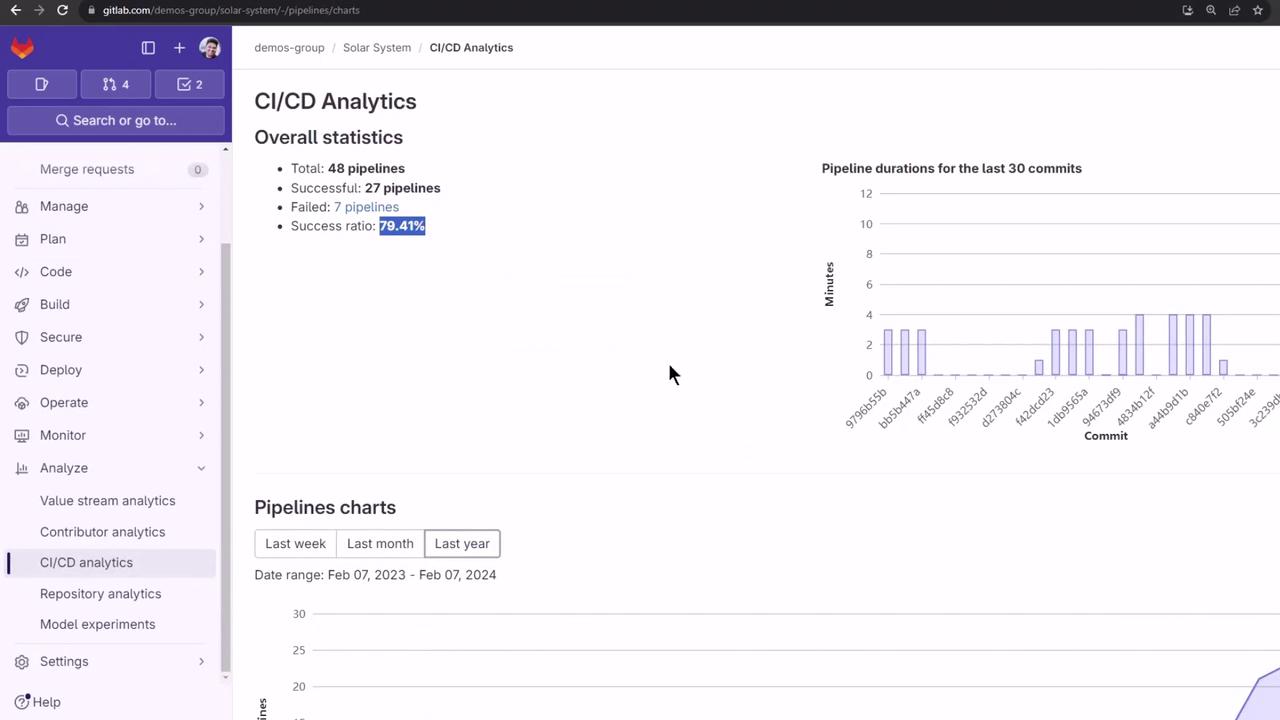
1. GitLab’s Built-in CI/CD Analytics GitLab offers a per-project CI/CD analytics dashboard that displays overall pipeline success rates and duration trends. While convenient for a handful of repositories, it doesn’t scale to dozens of projects:
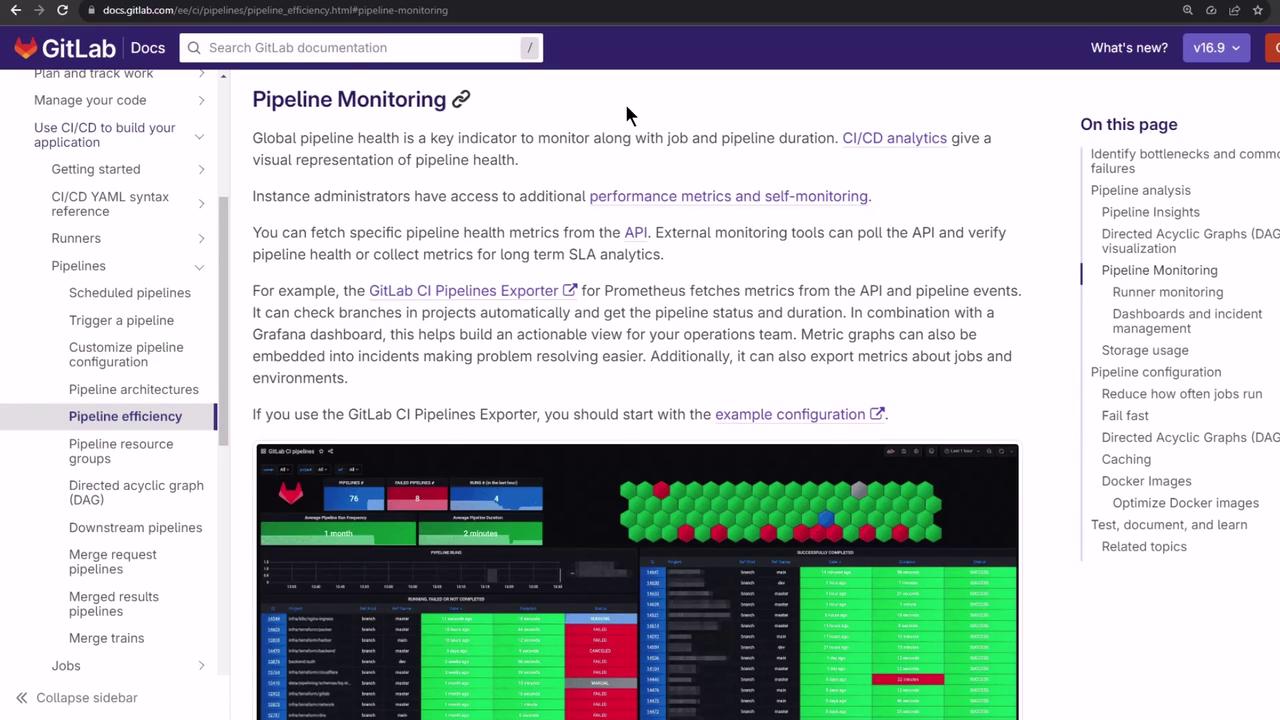
2. Centralized Pipeline Monitoring To obtain a global view, pair Prometheus with Grafana and the GitLab CI Pipelines Exporter:
The GitLab CI Pipelines Exporter polls GitLab’s API, translates pipelines, jobs, and environment metrics into Prometheus format, and ships three Grafana dashboards out of the box.
3. GitLab CI Pipelines Exporter 3.1 Installation Options Choose the installer that matches your environment:
Platform Install Command macOS (Homebrew) brew install mvisonneau/tap/gitlab-ci-pipelines-exporterDocker docker run -it --rm quay.io/mvisonneau/gitlab-ci-pipelines-exporter:latestWindows (Scoop) scoop bucket add gitlab-ci-pipelines-exporter https://github.com/mvisonneau/scoopsscoop install gitlab-ci-pipelines-exporterNix nix-env -iA nixos.prometheus-gitlab-ci-pipelines-exporter
3.2 Quickstart Example A Docker Compose quickstart brings up the exporter, Prometheus, and Grafana in one go:
git clone https://github.com/mvisonneau/gitlab-ci-pipelines-exporter.git
cd gitlab-ci-pipelines-exporter/examples/quickstart

# Replace <your_token> in config file
sed -i 's/<your_token>/YOUR_TOKEN/' gitlab-ci-pipelines-exporter.yml

docker-compose up -d
Once running, access the stack at:
3.3 Docker Compose Overview version : '3' services : gitlab-ci-pipelines-exporter : image : quay.io/mvisonneau/gitlab-ci-pipelines-exporter:latest ports : - '8080:8080' environment : GCPE_GITLAB_TOKEN : ${GCPE_GITLAB_TOKEN} GCPE_CONFIG : /etc/gitlab-ci-pipelines-exporter.yml volumes : - ./gitlab-ci-pipelines-exporter.yml:/etc/gitlab-ci-pipelines-exporter.yml prometheus : image : prom/prometheus:v2.44.0 ports : - '9090:9090' volumes : - ./prometheus/config.yml:/etc/prometheus/prometheus.yml grafana : image : grafana/grafana:9.5.2 ports : - '3000:3000' environment : GF_AUTH_ANONYMOUS_ENABLED : 'true' GF_INSTALL_PLUGINS : grafana-polystat-panel,yesoreyeram-boomtable-panel volumes : - ./grafana/dashboards.yml:/etc/grafana/provisioning/dashboards/default.yml - ./grafana/datasources.yml:/etc/grafana/provisioning/datasources/default.yml
3.4 Prometheus Scraping Config Configure Prometheus to scrape the exporter:
# prometheus/config.yml global : scrape_interval : 15s scrape_configs : - job_name : 'gitlab-ci-pipelines-exporter' scrape_interval : 10s static_configs : - targets : [ 'gitlab-ci-pipelines-exporter:8080' ]
3.5 Exporter Configuration A minimal gitlab-ci-pipelines-exporter.yml:
--- log : level : debug gitlab : url : https://gitlab.com token : <your_token> project_defaults : pull : pipeline : jobs : enabled : true projects : - name : gitlab-org/gitlab-runner pull : environments : enabled : true name_regexp : '^stable.*' - name : gitlab-org/charts/auto-deploy-app
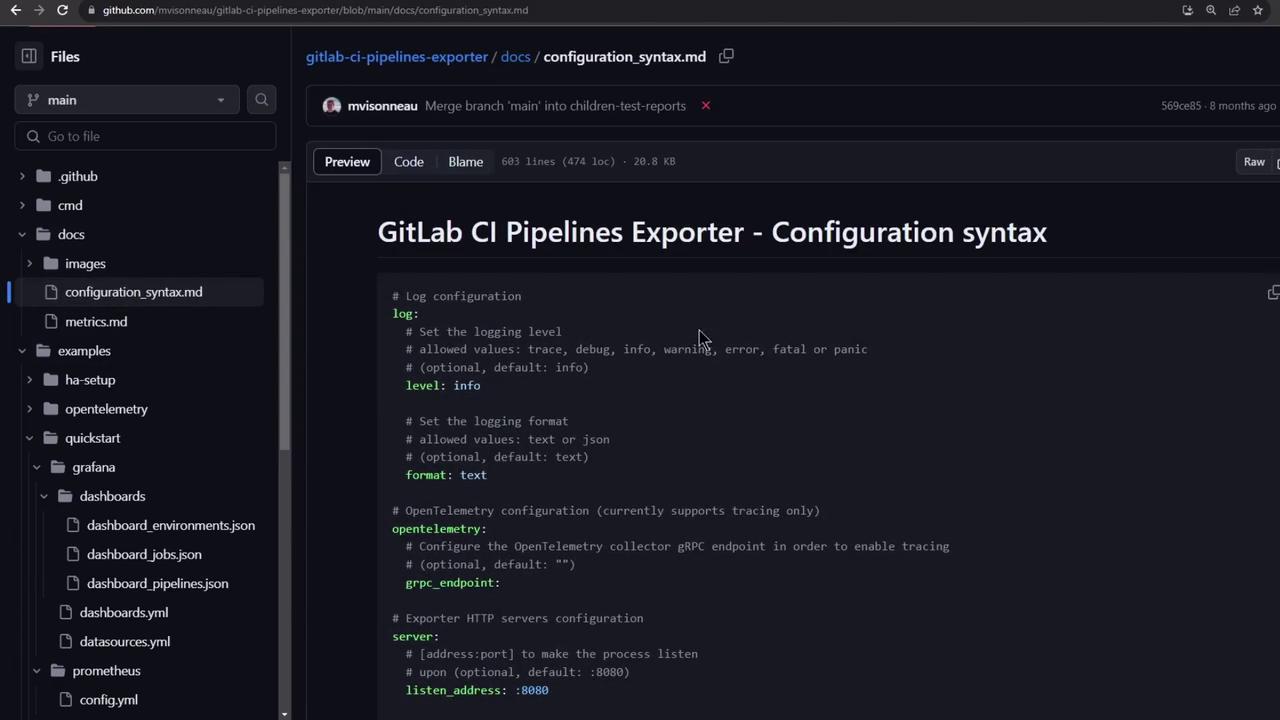
For the full configuration schema, refer to the exporter’s docs:
4. Creating a Personal Access Token Generate a token under User Settings → Access Tokens with at least read_api scope:
Keep your personal access token secure. Do not commit it to public repositories or share it in logs.
Paste this token into gitlab-ci-pipelines-exporter.yml before launching the stack.
5. Verifying the Exporter Ensure the exporter is up and exposing metrics:
docker-compose ps
docker logs -f quickstart_gitlab-ci-pipelines-exporter_1
# Check metrics output:
curl -s http://localhost:8080/metrics | grep gcpe_
A sample output might include:
gcpe_projects_count 47
gcpe_gitlab_api_requests_remaining 1997
gcpe_metrics_count 0
...
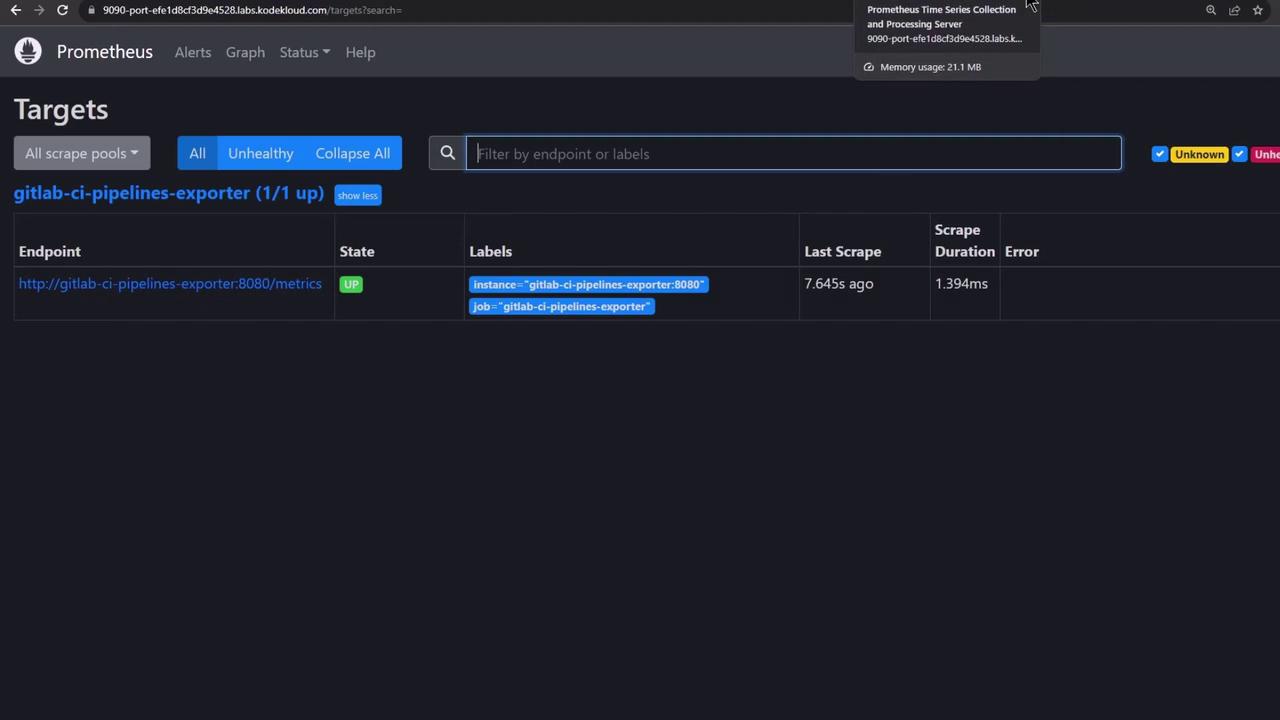
6. Exploring in Prometheus Visit Status → Targets in Prometheus (http://localhost:9090 ) to confirm the exporter is up:
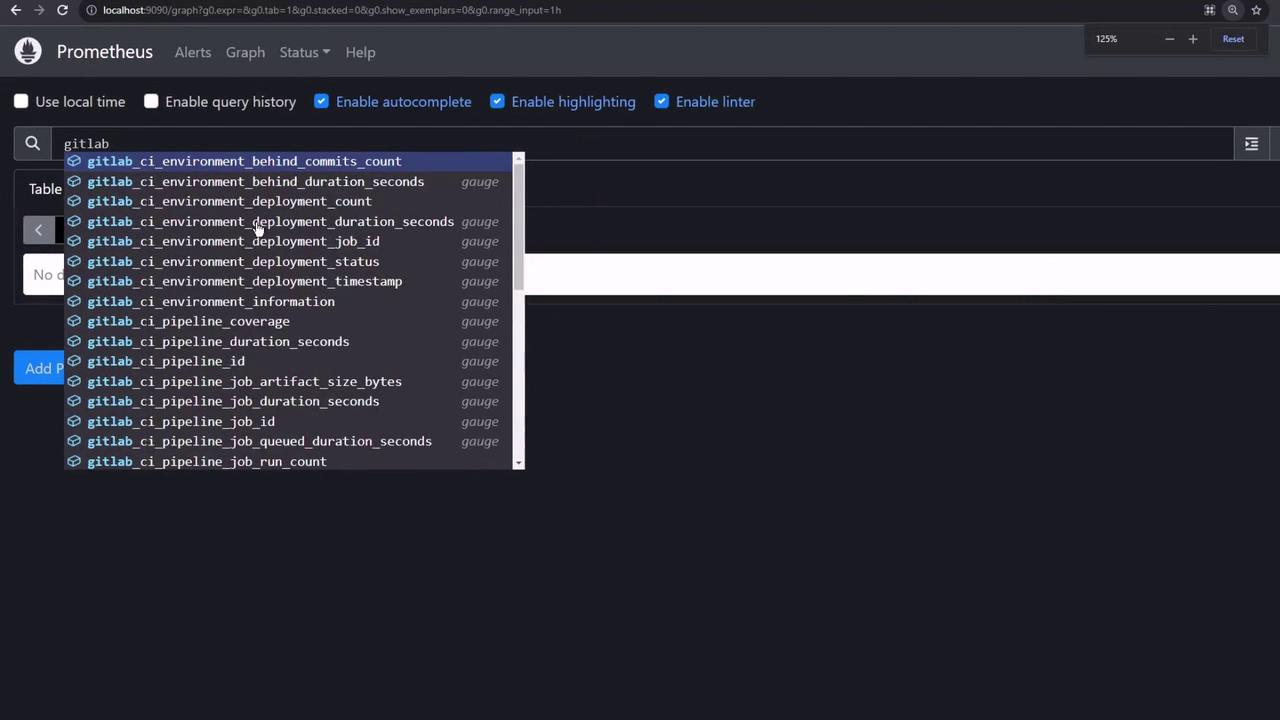
Query your GitLab metrics:
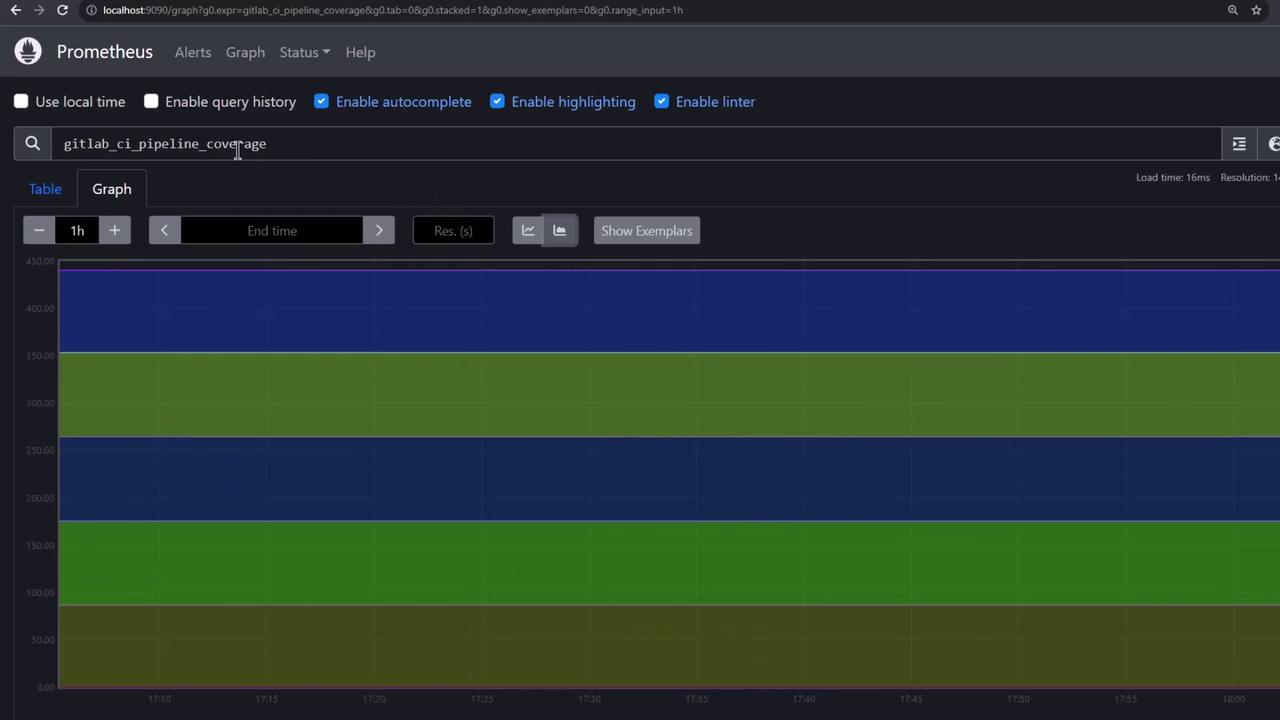
Render a time series graph:
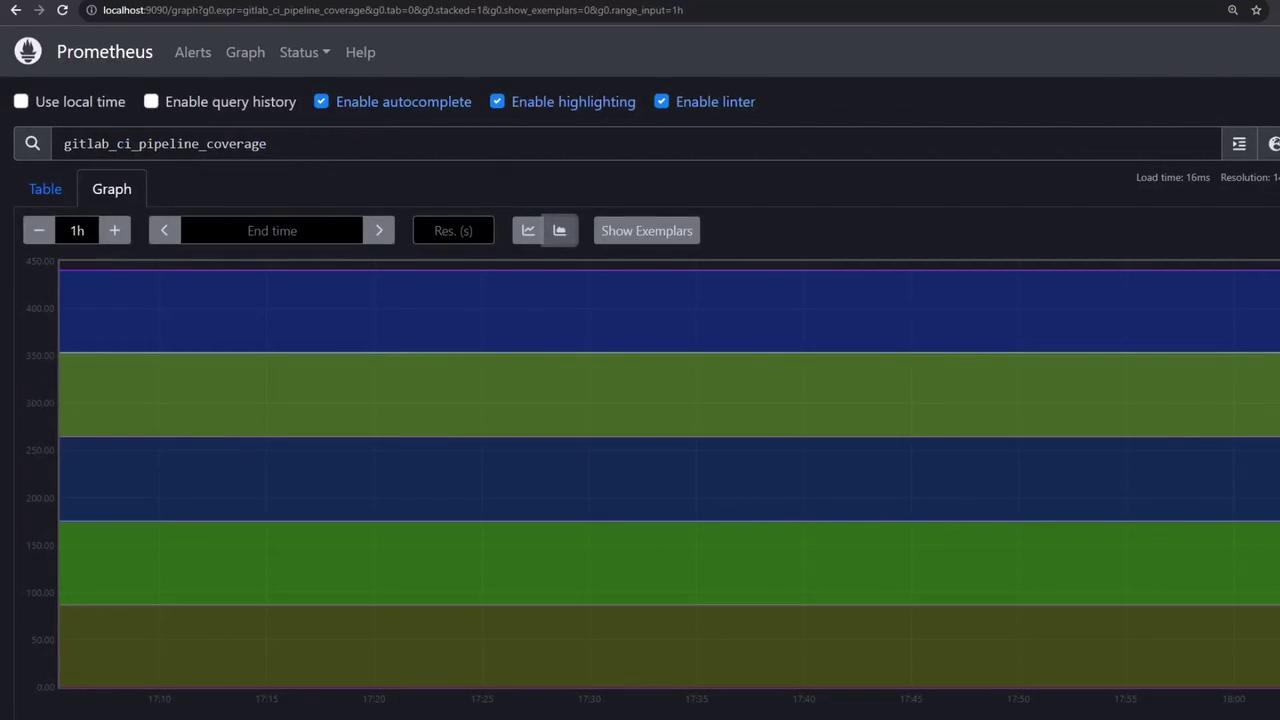
Adjust time ranges and resolution to dig into historical data:
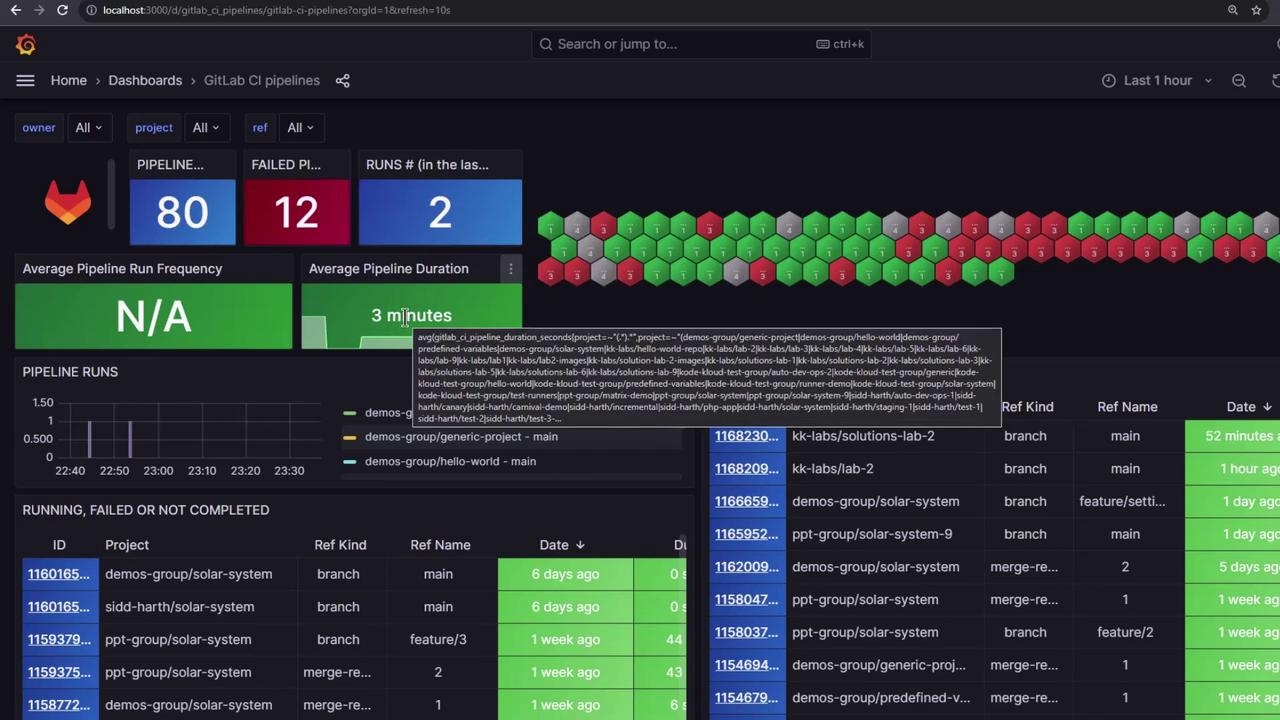
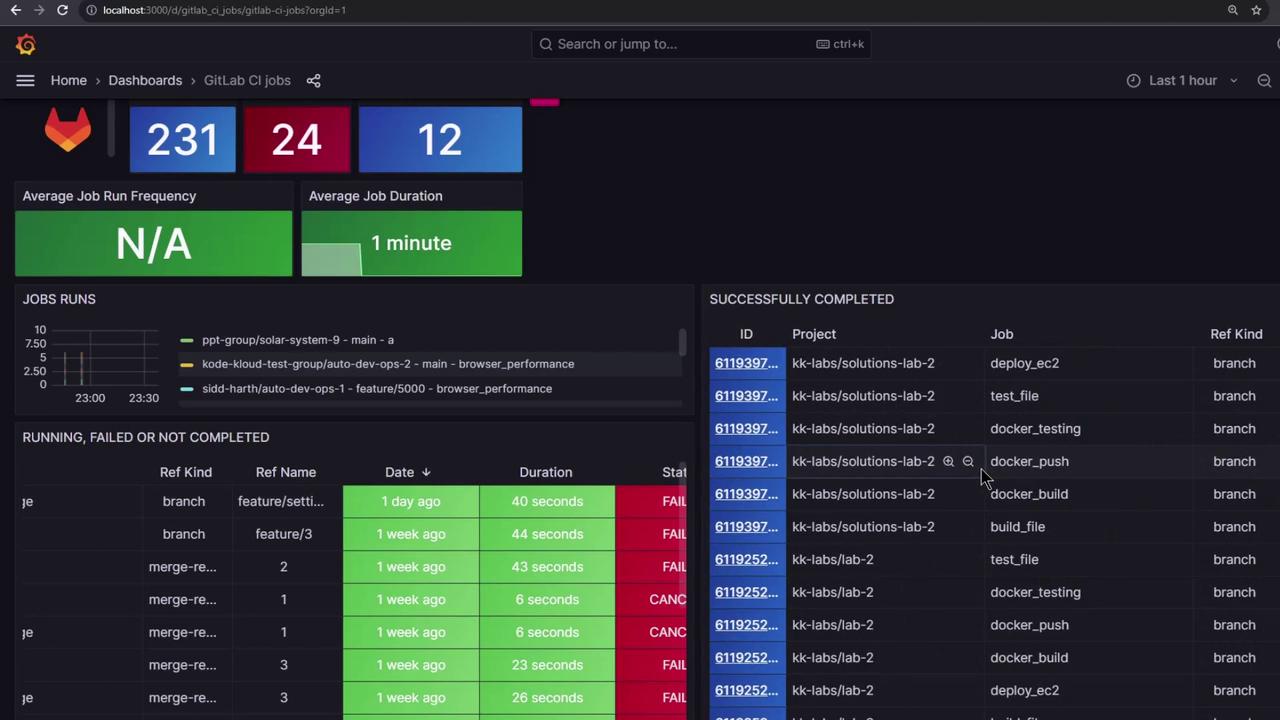
7. Grafana Dashboards Log in to Grafana (http://localhost:3000 , admin/admin). The exporter provides three ready-to-use dashboards:
Environments & Deployments Pipelines Overview Jobs Statistics Dive into any metric and click through to GitLab for full context.
For production environments, check out the HA setup example in the exporter repository. Links and References