

- Basic
artifactsconfiguration - Customizing retention and upload settings
- Enabling
artifacts:reportsfor JUnit - Available report types
- Viewing failures in a merge request
- Analyzing test summaries in the pipeline
Prerequisites
- A GitLab project with CI/CD enabled
- A Node.js test suite configured with mocha-junit-reporter
Install the JUnit reporter locally:Ensure your
package.json test script invokes the reporter.1. Basic CI/CD Job to Run Tests and Upload Artifacts
Start with a simple CI job that runs tests and uploads all generated files upon success:2. Always Upload & Customize Artifact Retention
To ensure test results are available even on failure, adjust theartifacts block:
- when: always – captures artifacts on success or failure
- expire_in: 3 days – limits storage time to 3 days
- name – assigns a meaningful archive name
- paths – points to the JUnit XML file
Generating the JUnit XML
Make sure your test command includes the JUnit reporter:test-results.xml:
3. Registering JUnit Reports with artifacts:reports
GitLab can parse JUnit XML and display it natively in merge requests and pipeline views. Extend your job:
4. Available Artifact Report Types
GitLab supports a variety of built-in report types that surface in Merge Request widgets and the pipeline UI: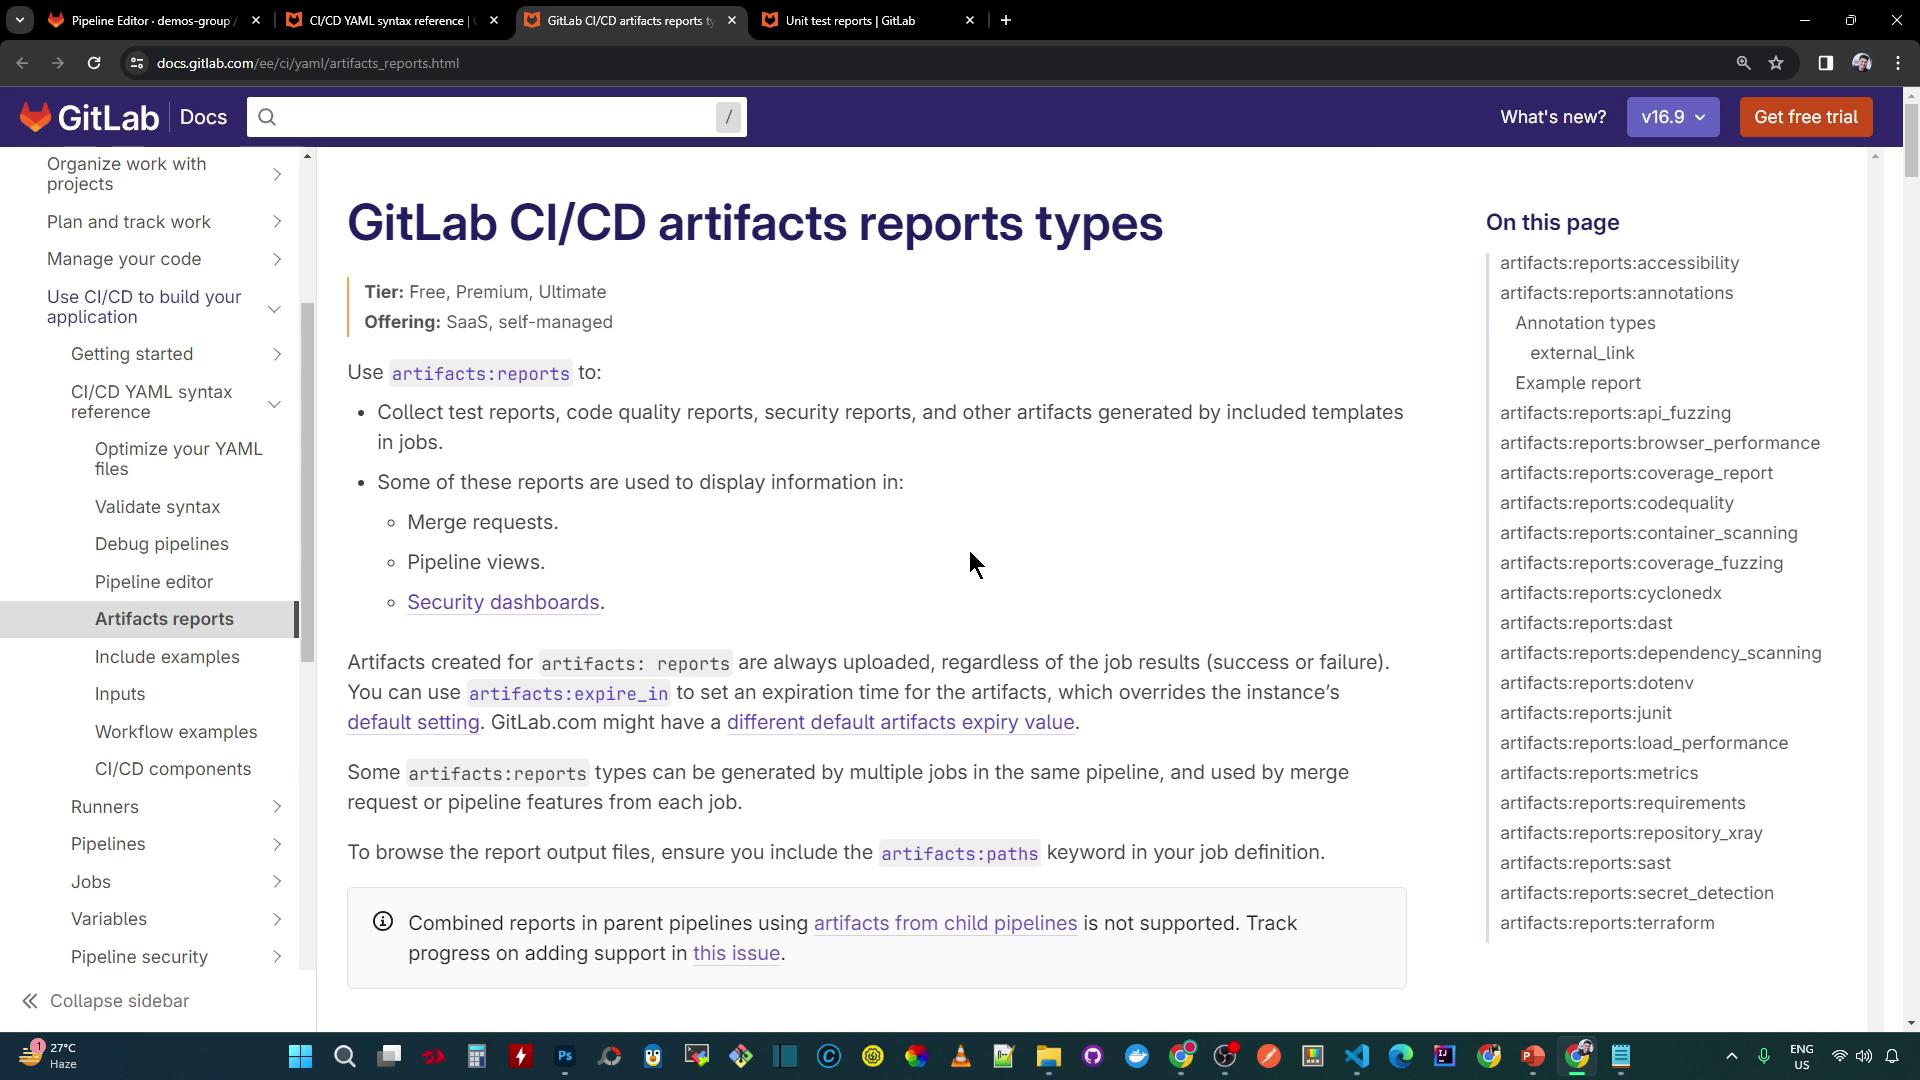
5. Viewing Failures in a Merge Request
When tests fail, GitLab surfaces a summary of the failures directly in the Merge Request: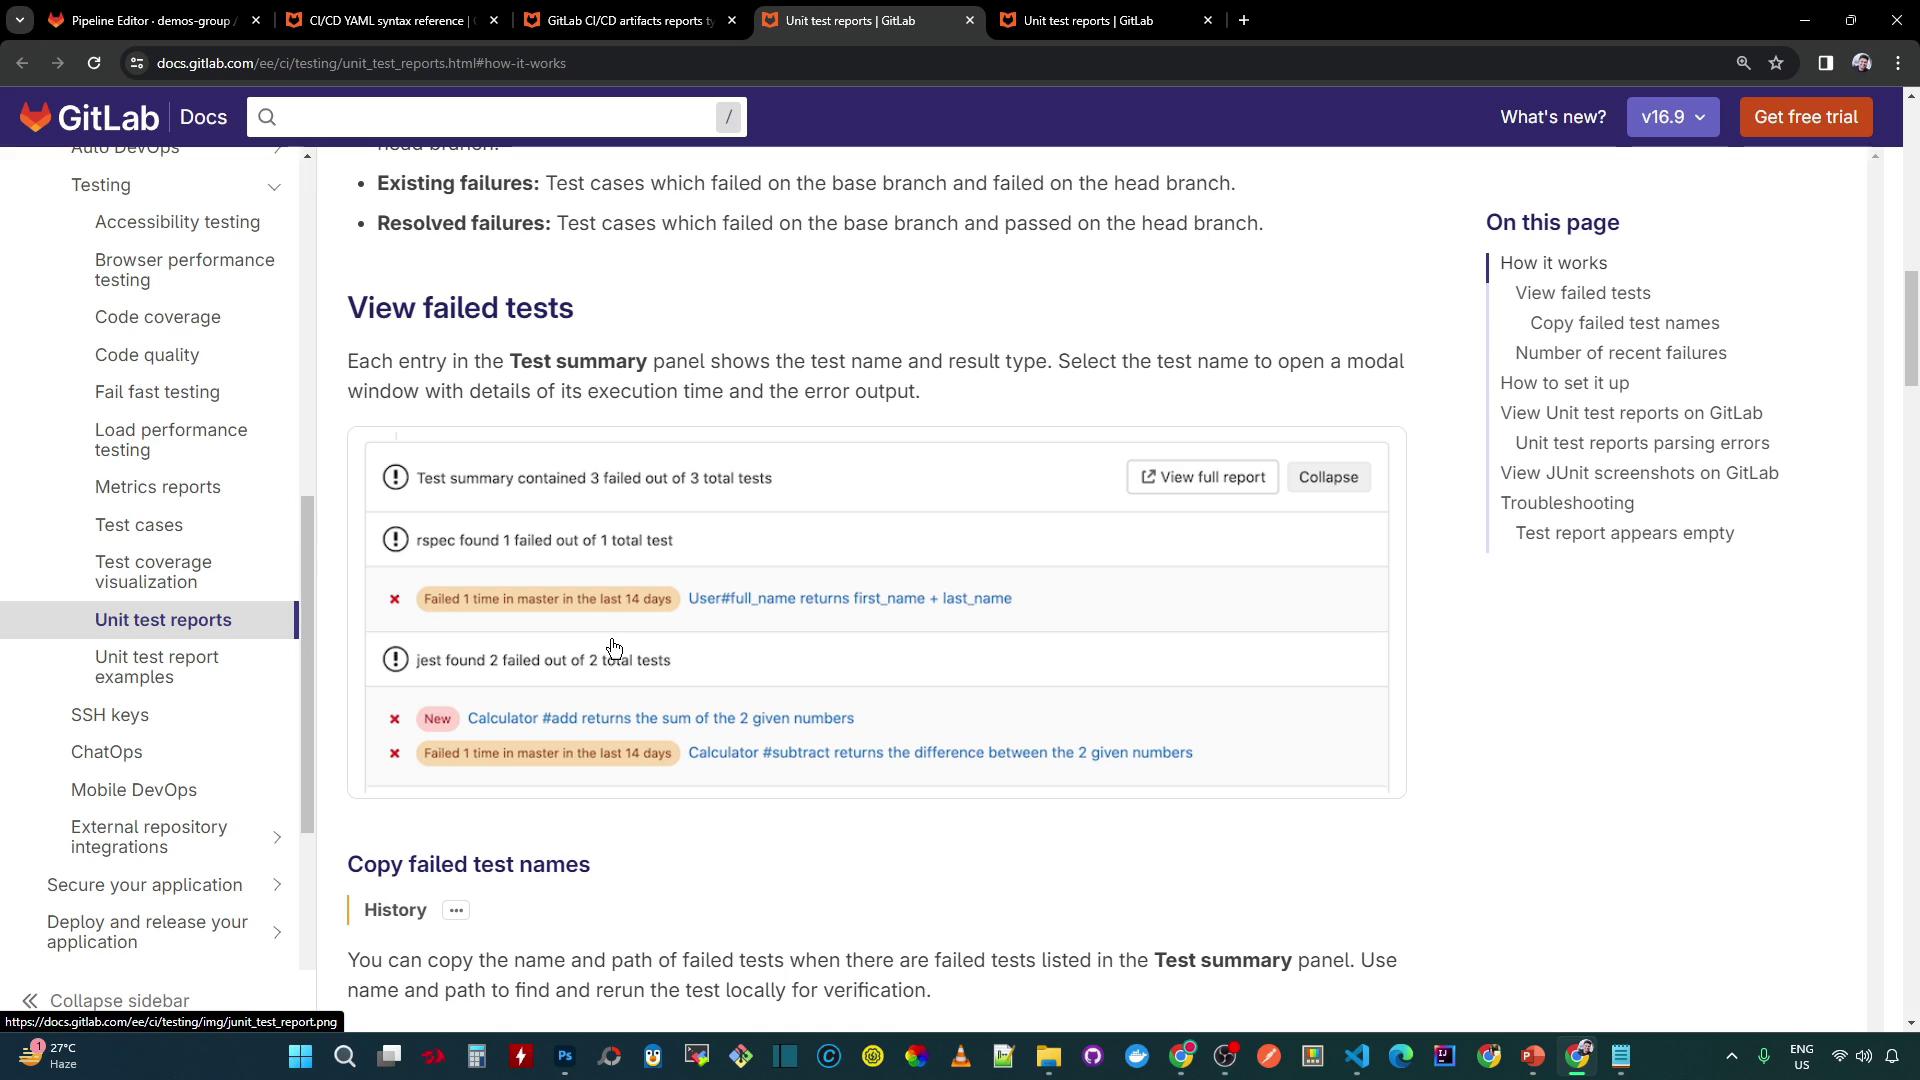
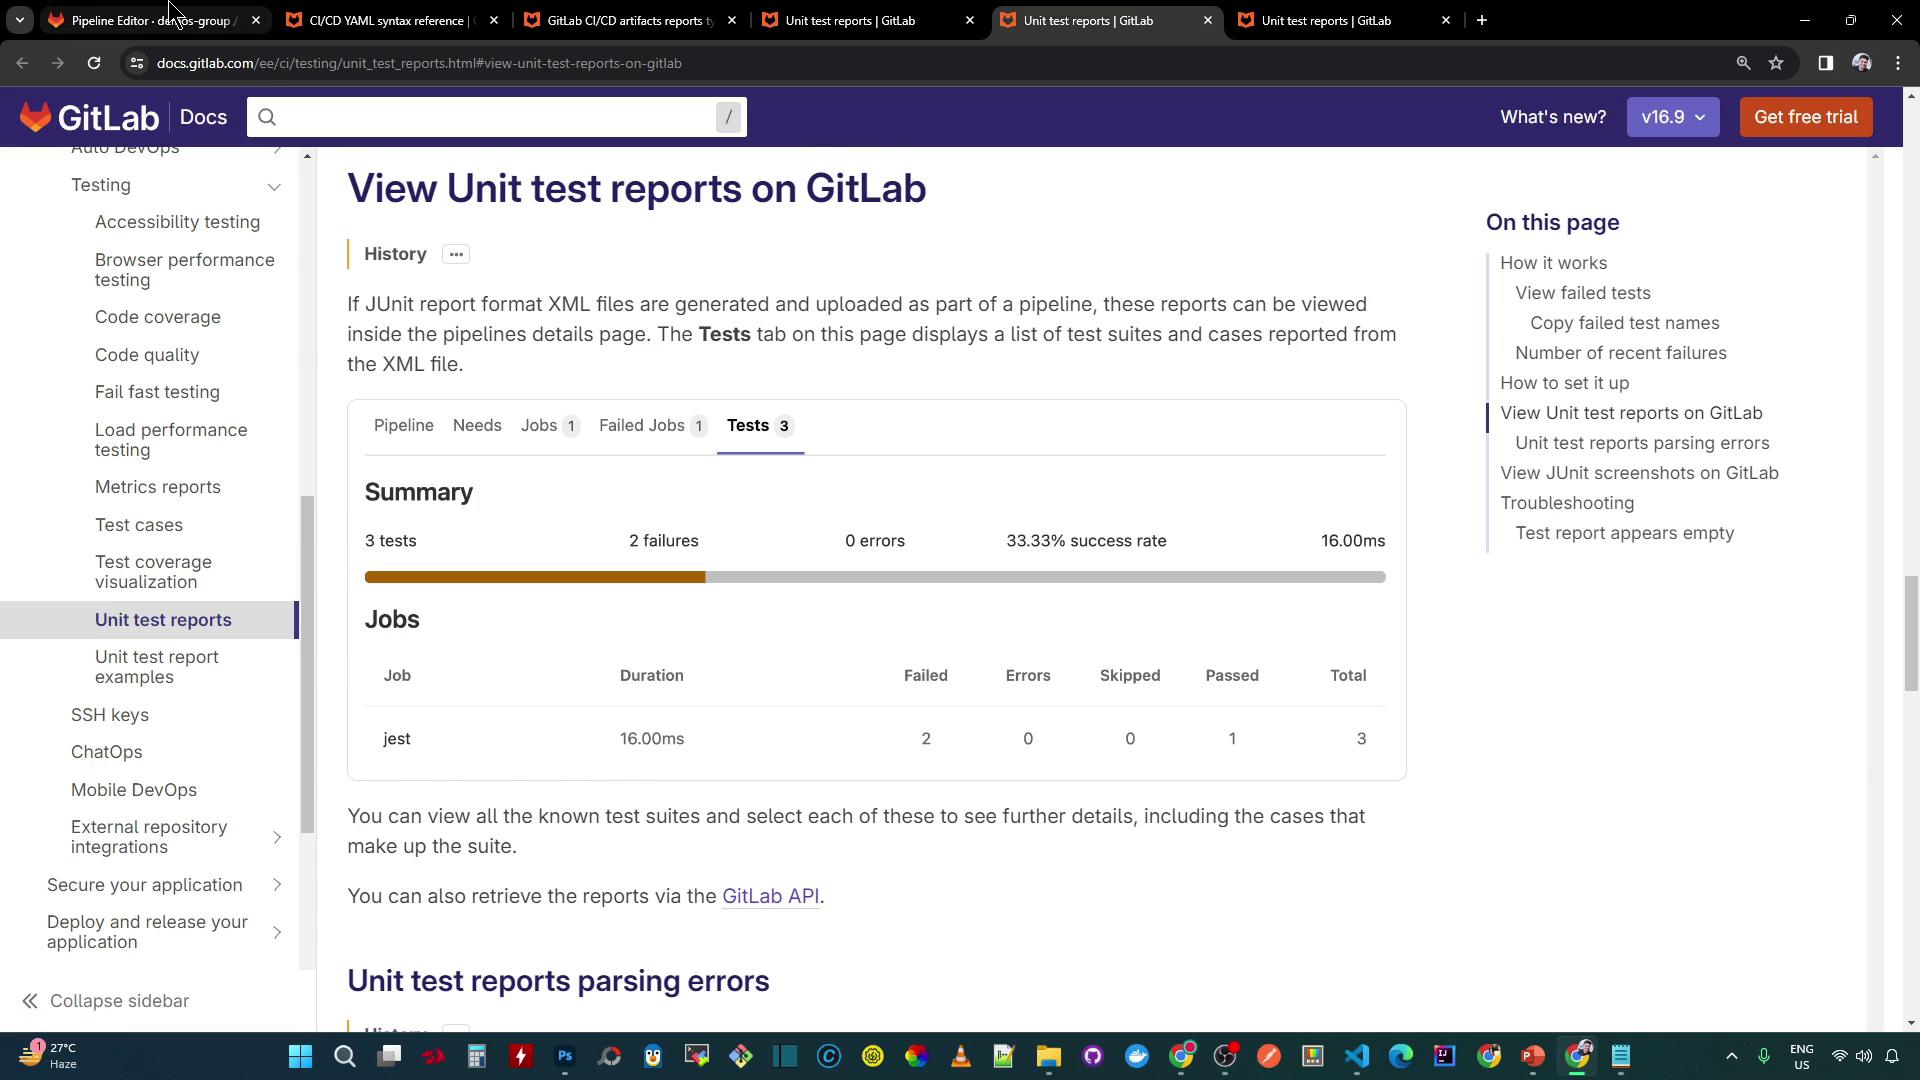
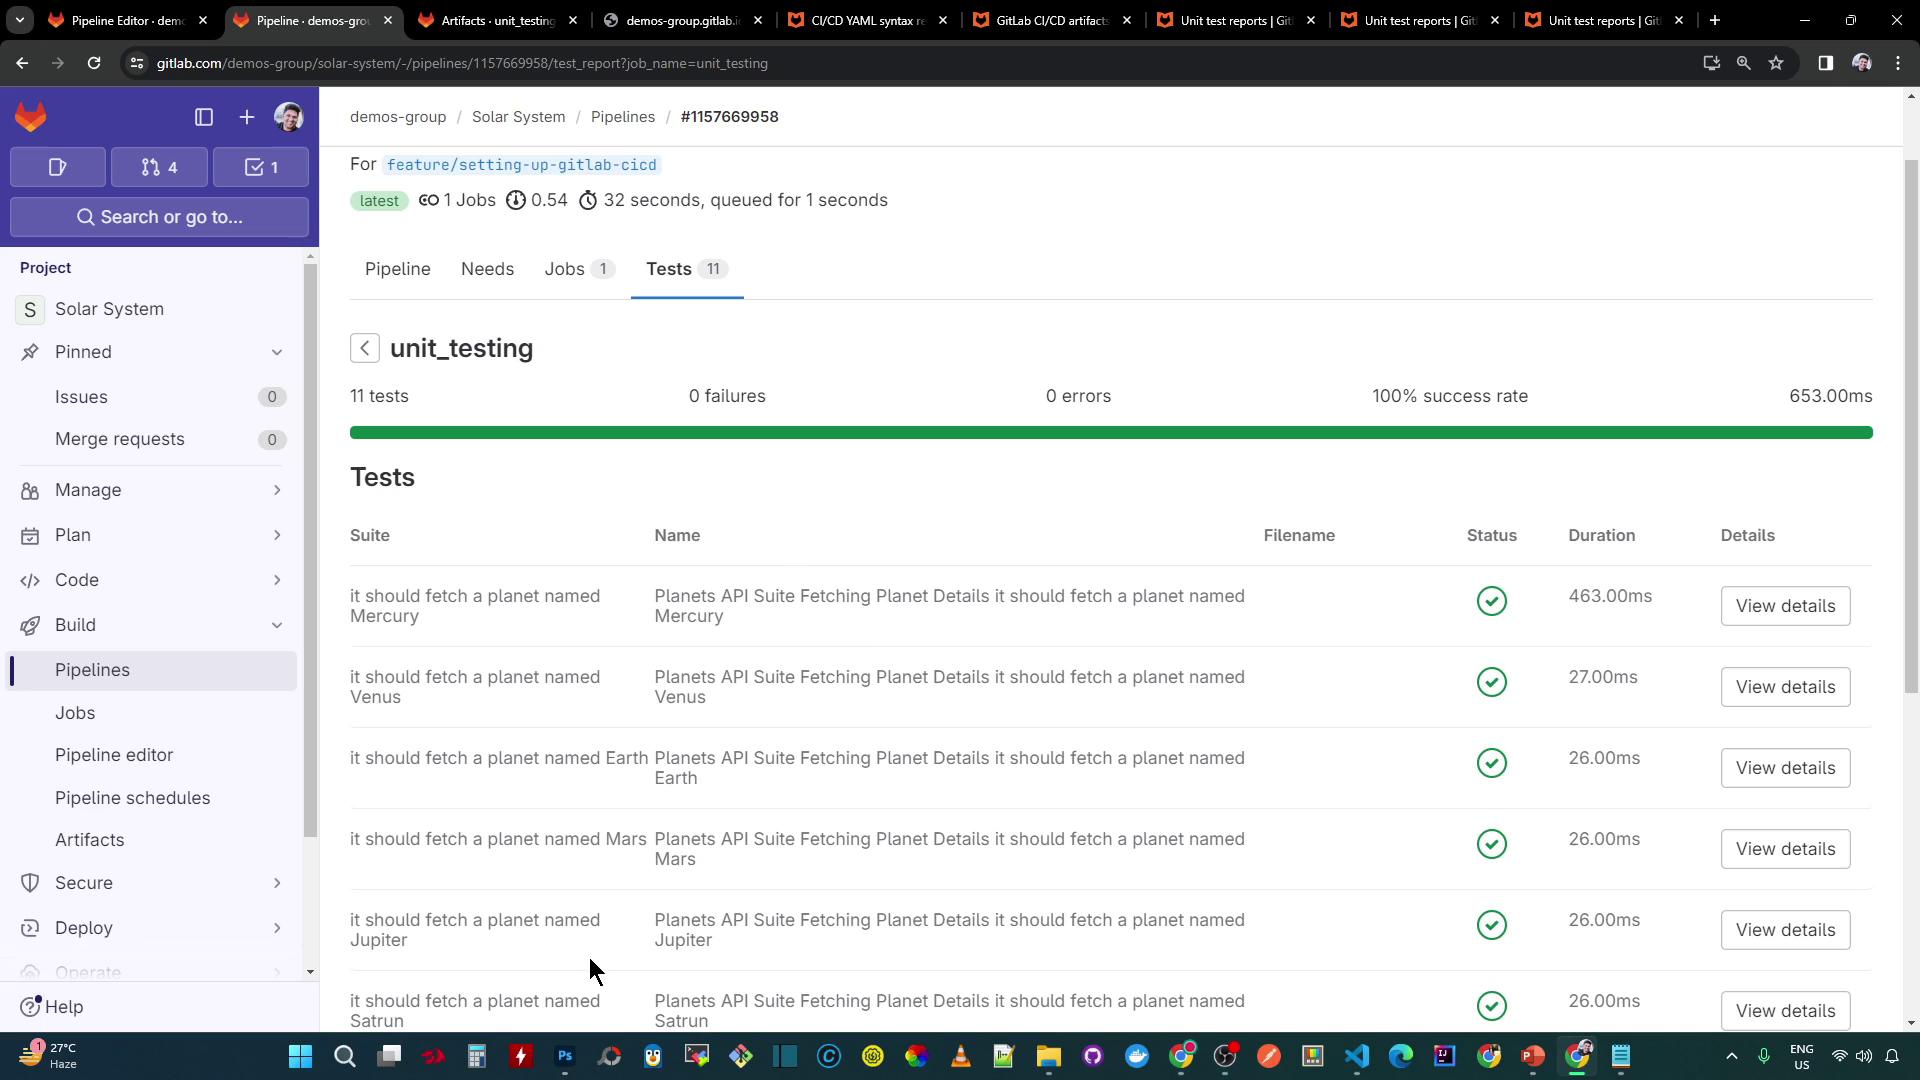
6. Checking Test Summaries in the Pipeline
In the pipeline’s Tests tab, you’ll see:- Total tests run
- Number of failures
- Success rate (%)
- Average test duration
References
- GitLab CI/CD Pipelines
- Artifacts
- JUnit Test Reports in GitLab
- mocha-junit-reporter on npm
- GitLab CI/CD YAML Configuration