

- Prometheus and Alertmanager installed and enabled as systemd services.
- Basic familiarity with Prometheus metrics and labels.
- Prometheus:
9090 - Alertmanager:
9093
You can follow the official docs for installation and basic configuration:
1) Create alerting rules
Create the rules file at/etc/prometheus/rules.yaml. The example below defines one group my-alerts containing three alerts:
NodeDown— triggers whenup{job="node"}goes to 0DatabaseDown— triggers whenup{job="db1"}goes to 0DatabaseDown-dev— triggers whenup{job="db2"}goes to 0
team and env labels to enable grouping and routing in Alertmanager. The annotations.message uses the Go template {{ .Labels.instance }} to show the instance address.
for: 0m moves alerts to firing immediately when the condition is true. To delay firing (reduce noise), use a longer duration such as for: 1m or for: 5m.2) Update Prometheus configuration to load rules and scrape targets
Add therule_files section to /etc/prometheus/prometheus.yml so Prometheus loads your alert rules. Ensure scrape_configs include jobs for node, db1, and db2. The example uses placeholder IPs — replace them with your actual targets.
http://localhost:9090 and check the Alerts page. Alerts will be shown in “not firing” (green) when targets are up; they move to pending/firing according to the for duration.
Example active alert labels and annotations you will see in Prometheus when targets go down:
alertname=NodeDown env=prod instance=192.168.1.168:9100 job=node team=infraalertname=DatabaseDown env=prod instance=192.168.1.168:9200 job=db1 team=databasealertname=DatabaseDown-dev env=dev instance=192.168.1.168:9300 job=db2 team=database
3) Configure Prometheus to forward alerts to Alertmanager
Add the followingalerting block to /etc/prometheus/prometheus.yml so Prometheus knows where to send alerts:
http://localhost:9093. Incoming alerts from Prometheus will appear there and will be grouped according to Alertmanager’s routing rules.
4) Configure Alertmanager routing and Slack receiver
Edit Alertmanager’s configuration at/etc/alertmanager/alertmanager.yml to define routes and receivers. The example below:
- Matches alerts whose
joblabel matchesnode,db1, ordb2(viamatch_re). - Groups alerts by
teamandenvso each team/environment becomes a single grouped notification in Slack. - Sends grouped alerts to the
slackreceiver. - Uses a
web.hookreceiver as a fallback.
api_url with your Slack incoming webhook URL and update channel as needed.
{{ .GroupLabels.team }}and{{ .GroupLabels.env }}reference the labels used for grouping.- The
texttemplate iterates over.Alertsand prints each alert’sannotations.message.
Do not commit or publish your Slack webhook URL publicly. Treat
api_url like a secret and store it in a secure secret manager or environment-specific configuration.team and env. For example:
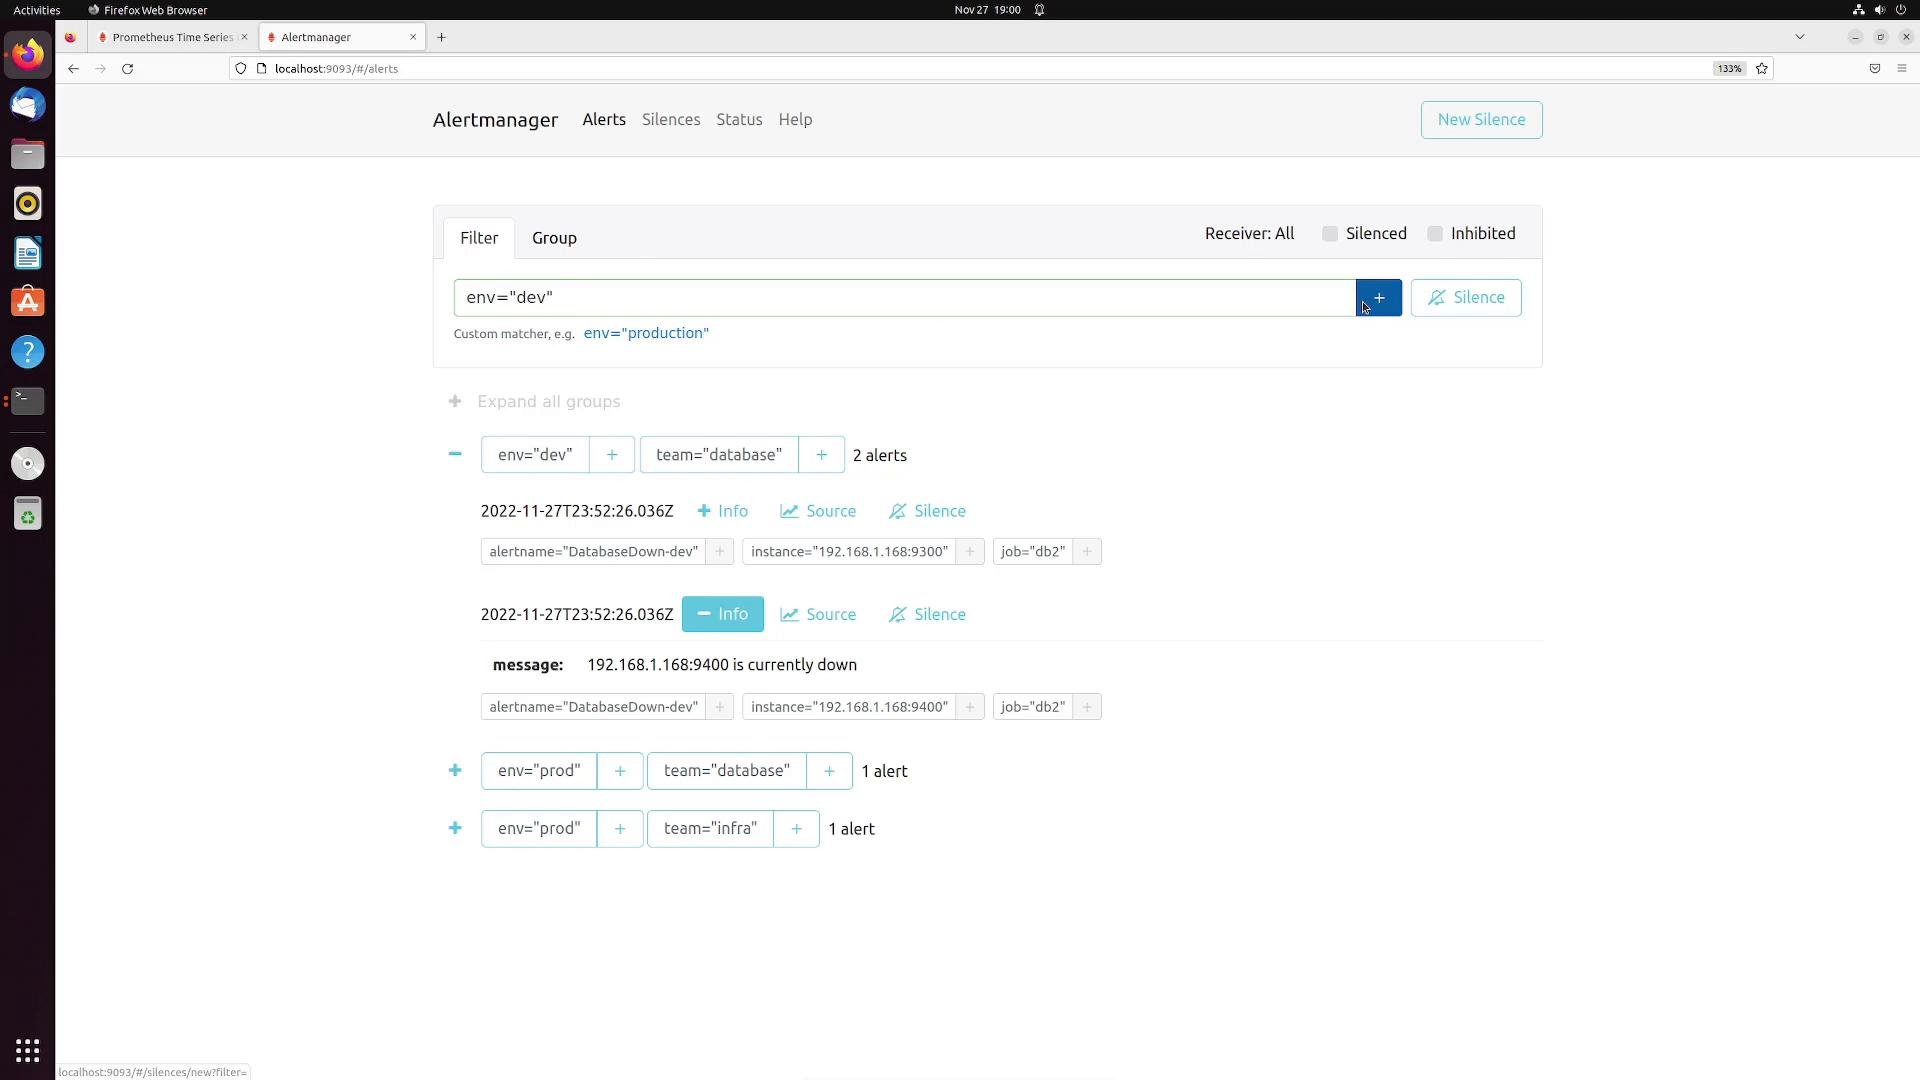
env=dev+team=databaseenv=prod+team=databaseenv=prod+team=infra
env="dev", only dev alerts will be displayed:
Slack notification example
When Alertmanager groups alerts and forwards them to Slack, a single Slack message is sent per group. Example messages that may appear in#alerts:
Files changed (quick reference)
Example alert summary table
Summary / Best practices
- Define rules in
/etc/prometheus/rules.yamland load them viarule_filesinprometheus.yml. - Use the
forfield to control pending → firing behavior and reduce alert flapping. - Point Prometheus to Alertmanager via the
alertingsection. - In Alertmanager:
- Use routing (
match,match_re) to direct alerts to the right receivers. group_bythe labels you want grouped (for exampleteamandenv) so one notification represents many alerts.- Use Go templates in receivers to build informative titles and messages.
- Use routing (
- Protect webhook URLs and sensitive receiver credentials; use secrets management for production.