

promtool, starting the server, and running a basic PromQL query via the web UI.
Prerequisites
- A machine with network access to download releases (Linux, macOS, or Windows — choose the matching binary).
- Common CLI tools:
wgetorcurl,tar, and a shell. - Ports: Prometheus listens on port
9090by default. Ensure firewall rules allow access if needed.
- Visit the Prometheus download page to find the correct URL for your OS/architecture:
https://prometheus.io/download - You can download via browser or copy the tarball link and use
wgetfrom the command line. Choose the correct OS/architecture (for example,linux-amd64) and prefer the latest stable release unless you require an older version.
Select the binary matching your operating system and architecture (for example,
linux-amd64). Using the latest stable release is recommended unless you need a specific older version.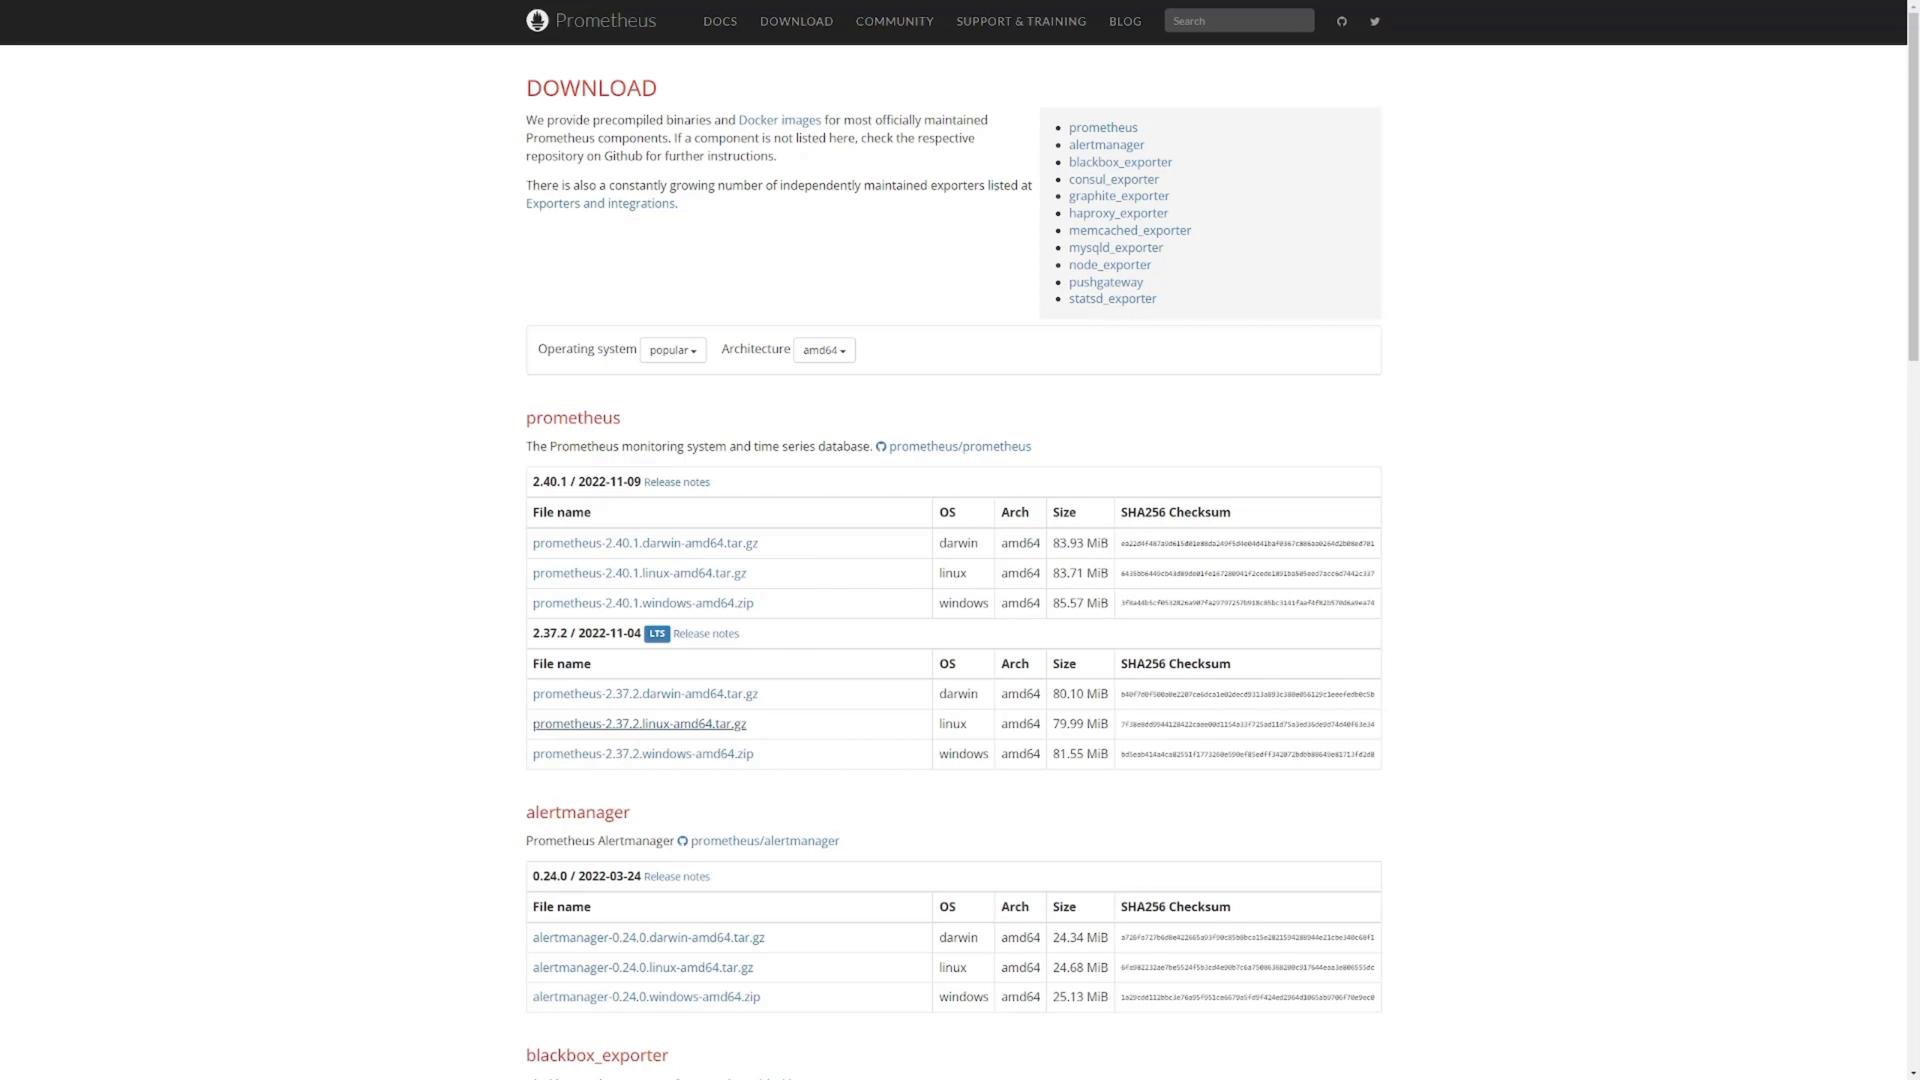
prometheus-<version>.linux-amd64.tar.gz and download with wget:
- Extract the gzipped tarball. The
-zhandles gzip compression,-vprints filenames, and-fspecifies the file:
prometheus-2.37.2.linux-amd64/. Confirm:
promtool:
Validate the configuration before starting Prometheus:
prometheus.yml from the current directory; you can override this with --config.file:
Do not expose Prometheus directly to the public internet without appropriate access controls (firewalls, reverse proxy with authentication, or network restrictions). Prometheus has no built-in authentication by default.
- Open a browser on the machine running Prometheus and go to:
http://localhost:9090If accessing remotely, use the server IP:http://<prometheus-server-ip>:9090 - In the Prometheus expression browser, run a simple PromQL query to check target status:
1 indicates the target is up; 0 indicates it is down. Prometheus includes a default job to scrape itself, so the server should appear in the up results immediately after startup.
Troubleshooting tips
- Web UI not reachable:
- Confirm Prometheus is running and listening on port
9090:ss -ltnp | grep 9090ornetstat -ltnp | grep 9090. - Check firewall rules and that you’re using the correct host/IP address.
- Confirm Prometheus is running and listening on port
- Configuration errors:
- Fix issues reported by
promtooland re-run./promtool check config prometheus.ymlbefore restarting.
- Fix issues reported by
- Logging and diagnostics:
- Check the Prometheus process stdout/stderr (if running in the foreground) or
journalctl -u prometheusif running as a systemd service.
- Check the Prometheus process stdout/stderr (if running in the foreground) or
- Running as a background service:
- Use systemd or your OS service manager. See the Prometheus documentation for an example systemd unit and recommended file locations.
- Prometheus download page: https://prometheus.io/download
- Prometheus official docs: https://prometheus.io/docs/
- PromQL basics: https://prometheus.io/docs/prometheus/latest/querying/basics/
promtool, running locally, and serving metrics on port 9090. From here you can add scrape targets to prometheus.yml, configure alerting rules, and integrate exporters or Grafana for visualization.