What is observability? Observability is the ability to infer the internal state of a system from the data it emits. In practice, it means collecting the signals a system produces so you can answer questions about health, performance, and failures—especially in dynamic environments. Observability helps you turn unexpected scenarios into actionable insights. Implementing observability across your applications and infrastructure improves troubleshooting speed, uncovers hard-to-find issues, enables performance monitoring, and enhances cross-team collaboration.
The image is a slide explaining the concept of observability, which involves understanding and measuring the state of a system from its data. It highlights benefits such as insight into system workings, speeding up troubleshooting, detecting problems, and monitoring performance.
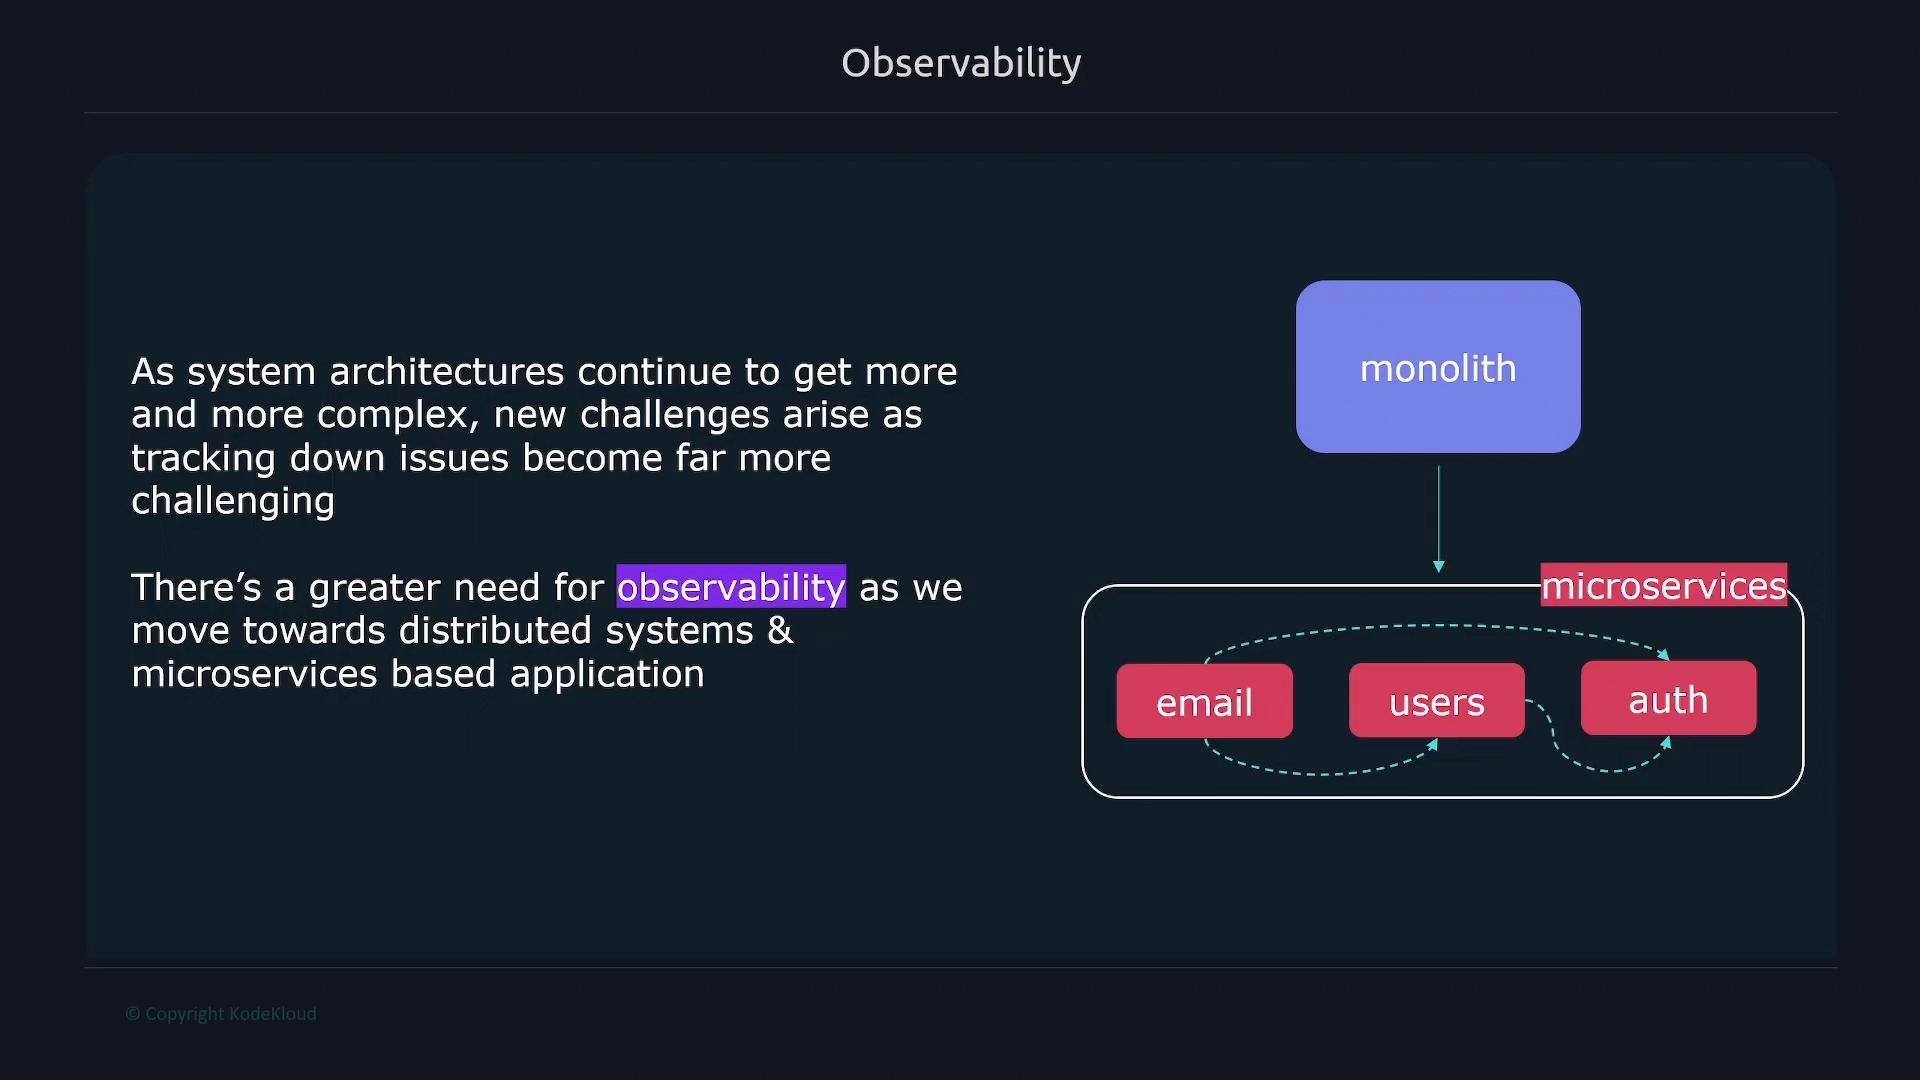
Observability lets you see inside what would otherwise be a black box: without it, data flows in and out but you cannot determine what happened between those points. By exposing internal state and context, you can identify which component failed, why it failed, and what to fix to prevent recurrence. Architectures are getting more complex—particularly with microservices. In a monolithic architecture, state and logs are often centralized; in microservices, many independent components interact, making isolation and diagnosis more difficult.
The image discusses the increasing complexity of system architectures and the need for observability as systems transition from monolithic to microservices-based structures. It includes a diagram illustrating a monolith transitioning to microservices with components like email, users, and auth.
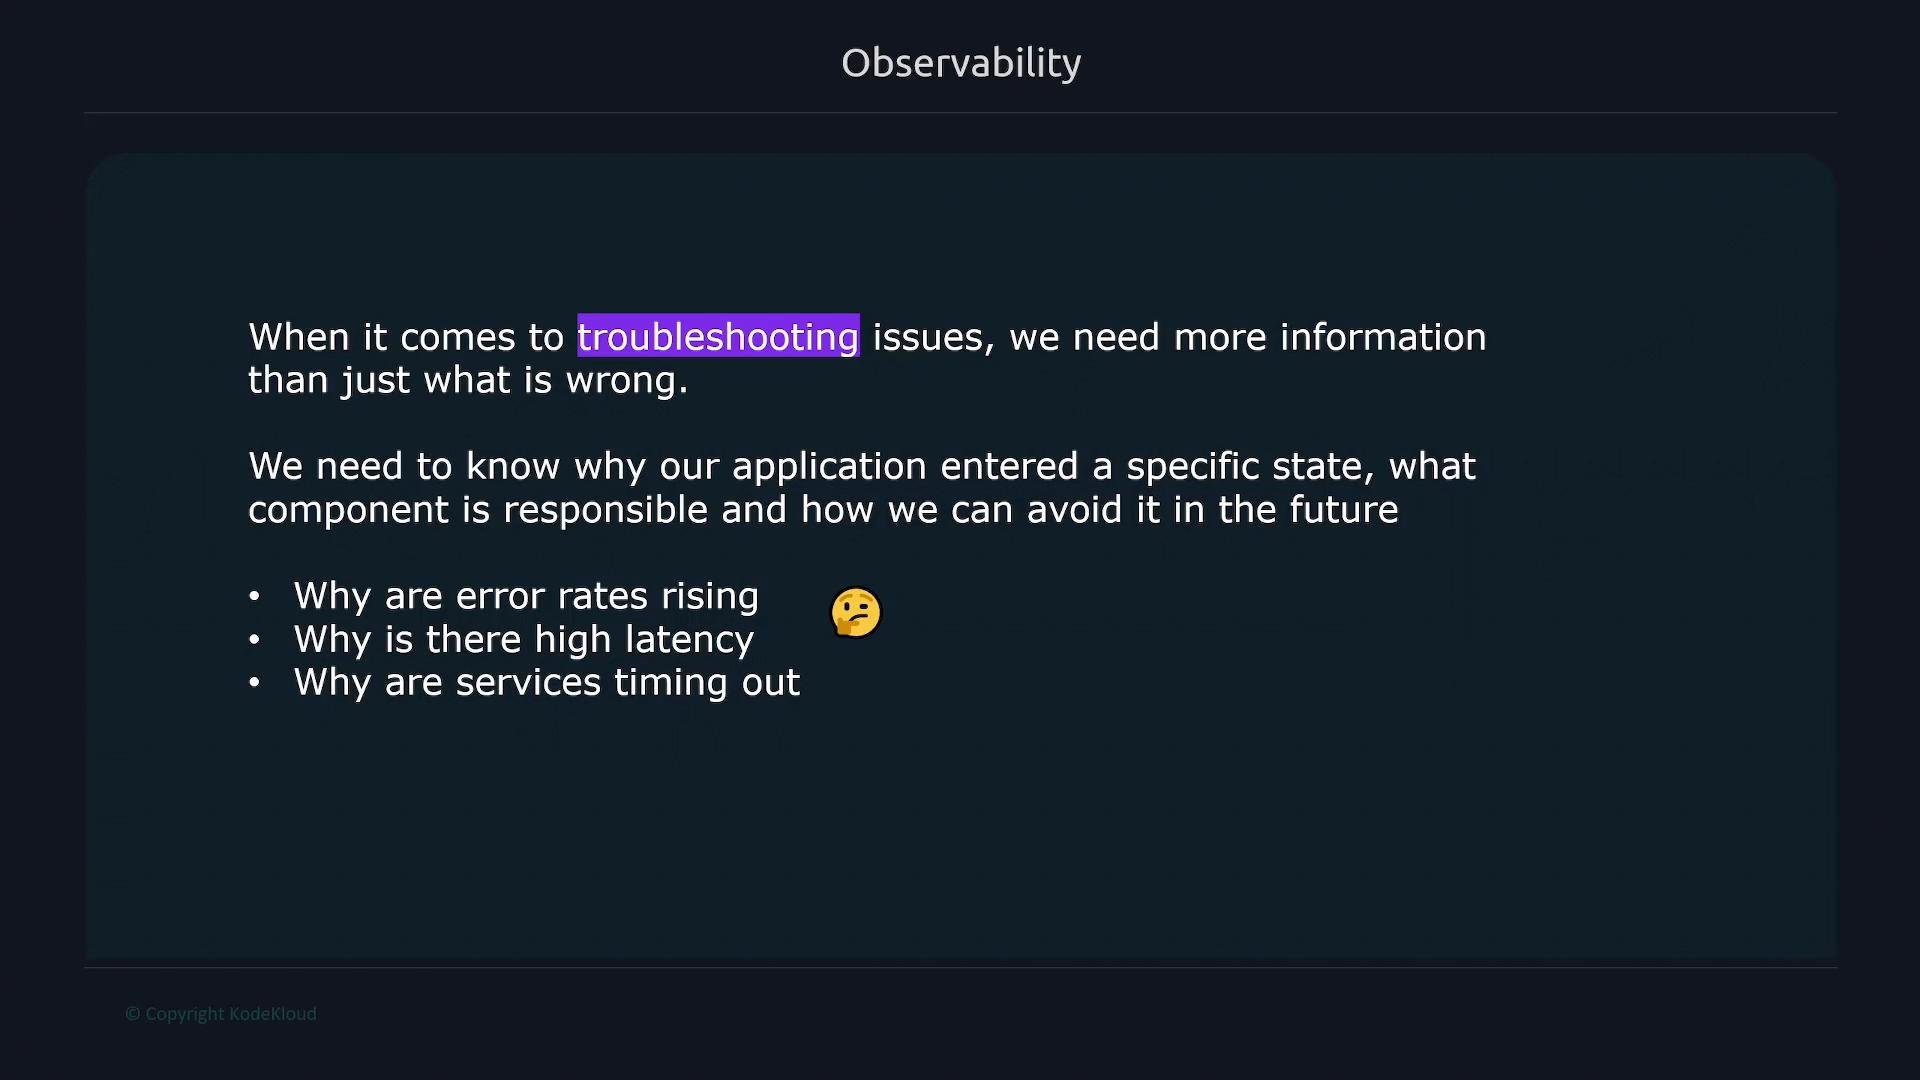
When troubleshooting, you need more than the symptom—you need the root cause and context. Observability lets you answer questions such as:
  • Why are error rates increasing?
  • Why is latency spiking for a subset of requests?
  • Which service is timing out and why?
These unpredictable questions require the flexibility provided by a complete observability strategy.
The image is a slide titled "Observability," discussing the need for information during troubleshooting to understand why issues occur in applications, such as rising error rates, high latency, and service timeouts.
How do we accomplish observability? Observability is commonly built on three signal types—often called the three pillars: logs, metrics, and traces. Each pillar answers different questions and is used together for effective monitoring and investigation. Logs Logs are timestamped records of events with descriptive messages. They are the most common output for applications and infrastructure. Logs provide rich context for specific events but can be very verbose and distributed across services and hosts, which makes manual analysis during outages time-consuming. Example system log snippet:
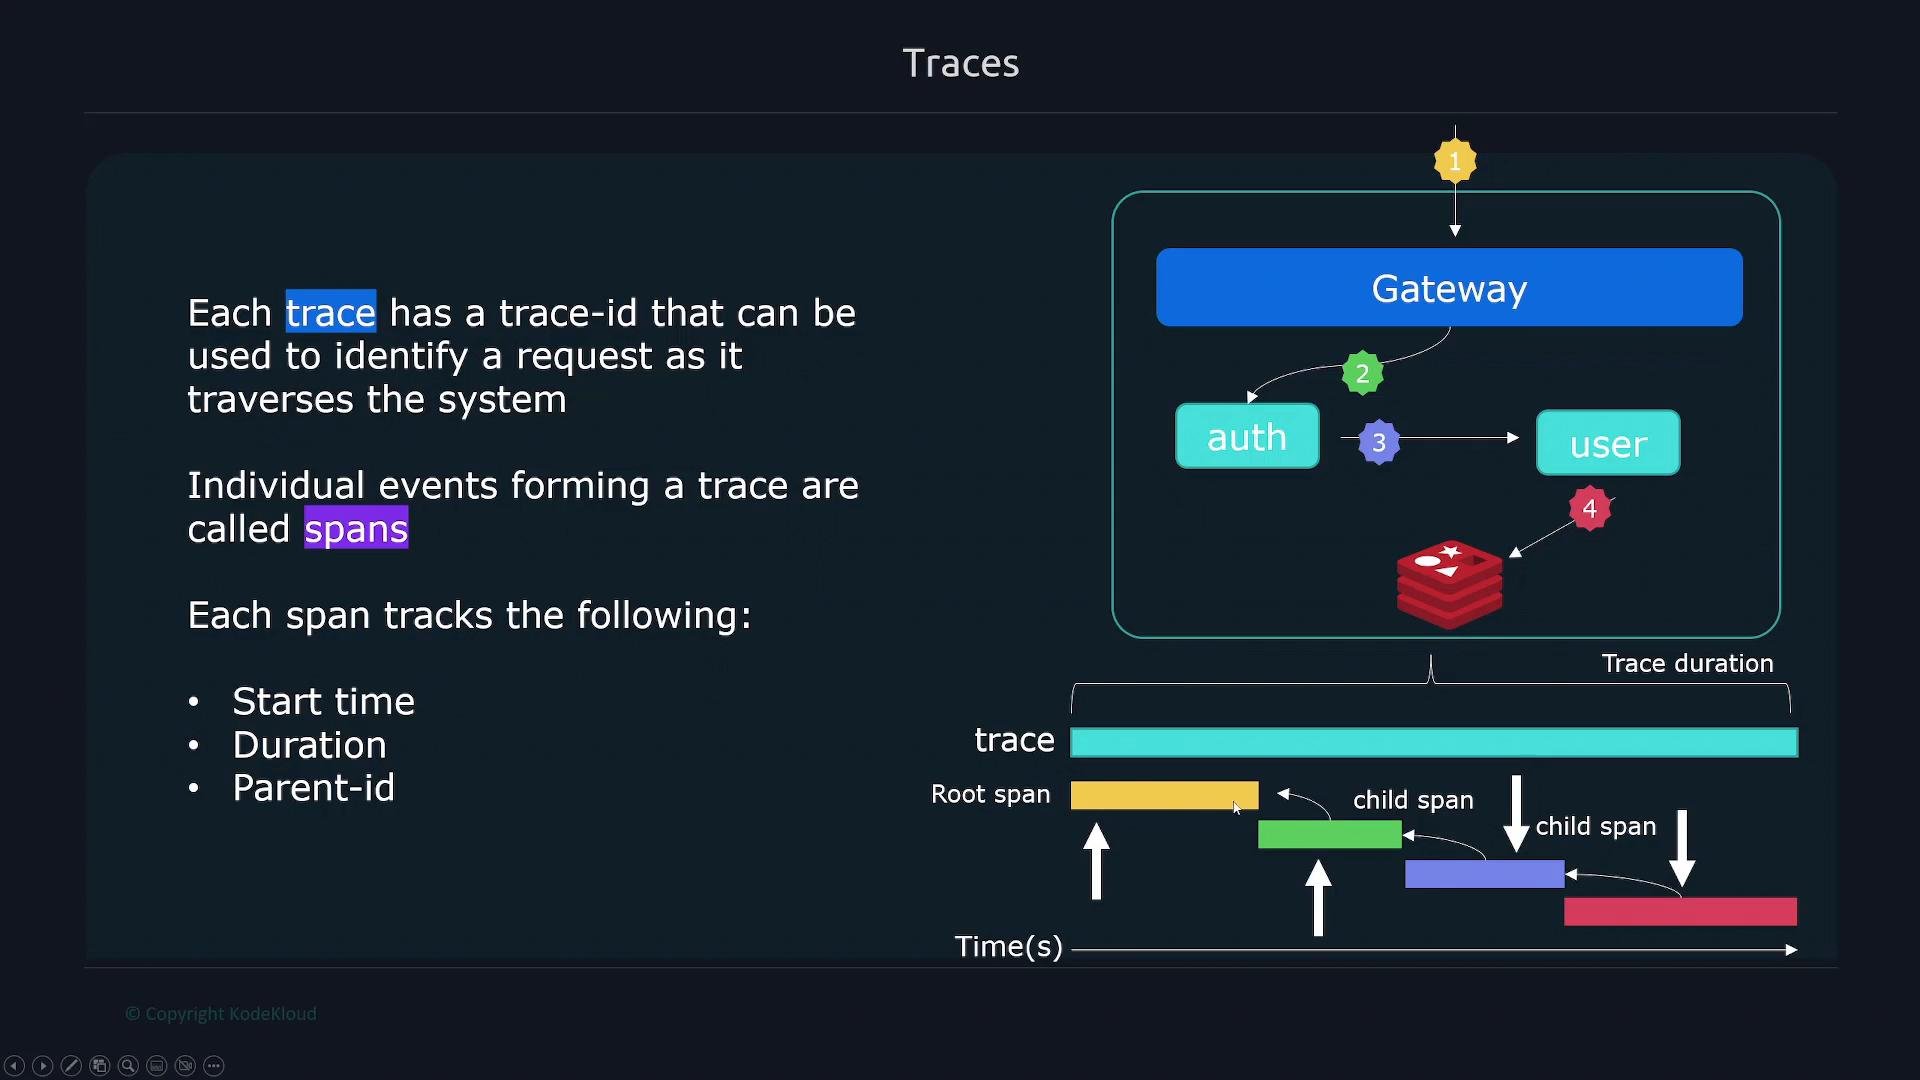
Traces Traces follow individual requests as they traverse services and components. A trace is composed of spans; each span records start time, duration, operation name, and parent relationships. Tracing helps pinpoint where latency is added or where failures occur along a request path.
The image explains how "Traces" work, showing a process flow from "Gateway" through various systems like "auth" and "user," to demonstrate how operations are followed as they traverse through systems and services. It highlights the concept of tracing individual requests step by step in a system.
Use traces to:
  • Visualize end-to-end latency per request.
  • Identify slow service hops or hotspots.
  • Correlate errors with specific spans.
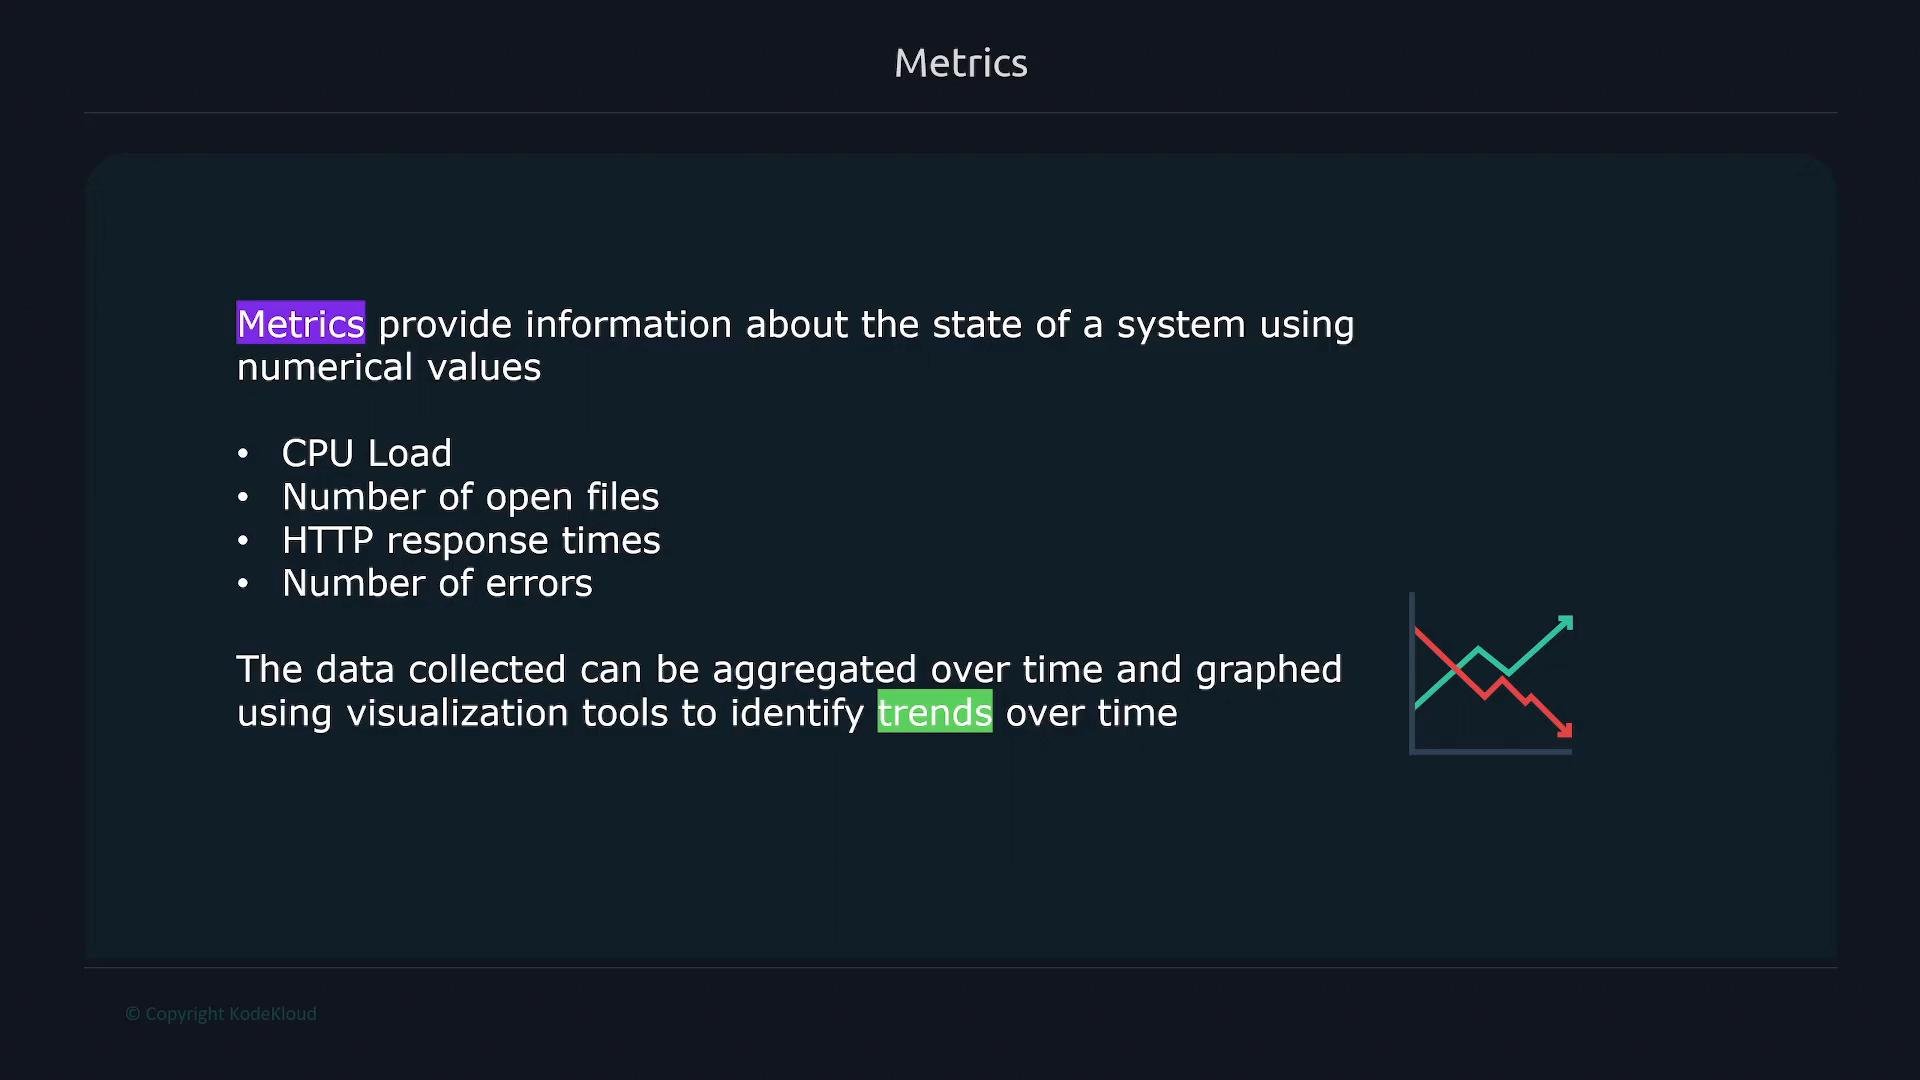
Metrics Metrics are numerical measurements sampled over time. They are ideal for identifying trends, triggering alerts, and creating dashboards. Metrics are generally compact and efficient to store and query, which makes them suitable for long-term analysis and automated rule evaluation. A metric typically includes:
  1. Metric name — what is measured.
  2. Value — numeric measurement.
  3. Timestamp — when it was collected.
  4. Labels/dimensions — key/value context for filtering and aggregation.
The image describes how metrics provide information about the state of a system using numerical values, including examples like CPU load and HTTP response times, and mentions that data can be aggregated to identify trends. A small graph depicting trends is also included.
Example metric sample:
Where does Prometheus fit? Prometheus is a metrics-first monitoring system: it scrapes numerical time series, evaluates rules, stores metrics efficiently, and triggers alerts based on metric conditions. Prometheus belongs to the metrics pillar and is not a logs or tracing system. For full observability, integrate Prometheus with logging (e.g., Elasticsearch, Logstash, Fluentd) and tracing tools (e.g., Jaeger, Zipkin, OpenTelemetry backends).
The image describes Prometheus as a monitoring solution responsible for collecting and aggregating metrics, with three main categories: Logs, Metrics, and Traces.
Prometheus is built for metrics: it scrapes and stores time series, evaluates alerting rules, and powers dashboards. Use dedicated logging and tracing systems to capture the other observability signals and correlate them with Prometheus metrics.
Links and references

Watch Video