

Metric naming rules
Follow these core rules when naming metrics:- Use snake_case: all lowercase with underscores (for example
http_requests_total). - Prefix the metric with the owning application or library: e.g.,
postgres_→postgres_queue_size_bytes. - Make the metric name descriptive; use multiple words when needed (for example:
queue_size). - Always include the base unit (seconds, bytes, meters, etc.) to avoid ambiguity. Prefer unprefixed base units such as
secondsandbytes; avoid using prefixed units likekilobytesormicrosecondsin the metric name. - Respect reserved suffixes created by client libraries:
_total,_count,_sum, and_bucket. Do not add these manually except when creating counter metrics yourself:- Use
_totalfor counters (for example,http_requests_total). - Do not manually append
_count,_sum, or_bucketfor histograms or summaries — the client library will generate those.
- Use
Counters should use the
_total suffix (see Prometheus naming best practices). Do not manually add _count, _sum, _bucket, or other reserved suffixes for metric types where the client library will create them automatically.container_docker_restartsplaces the library name (docker) in the middle; preferdocker_container_restarts.http_requests_sumis misleading — use_totalfor counters, not generic words likesum.nginx_disk_free_kilobytesuses a prefixed unit; usebytesinstead (for examplenginx_disk_free_bytes).dotnet_queue_waiting_timeomits the unit — includesecondsor another base unit (for exampledotnet_queue_waiting_seconds).
What to instrument
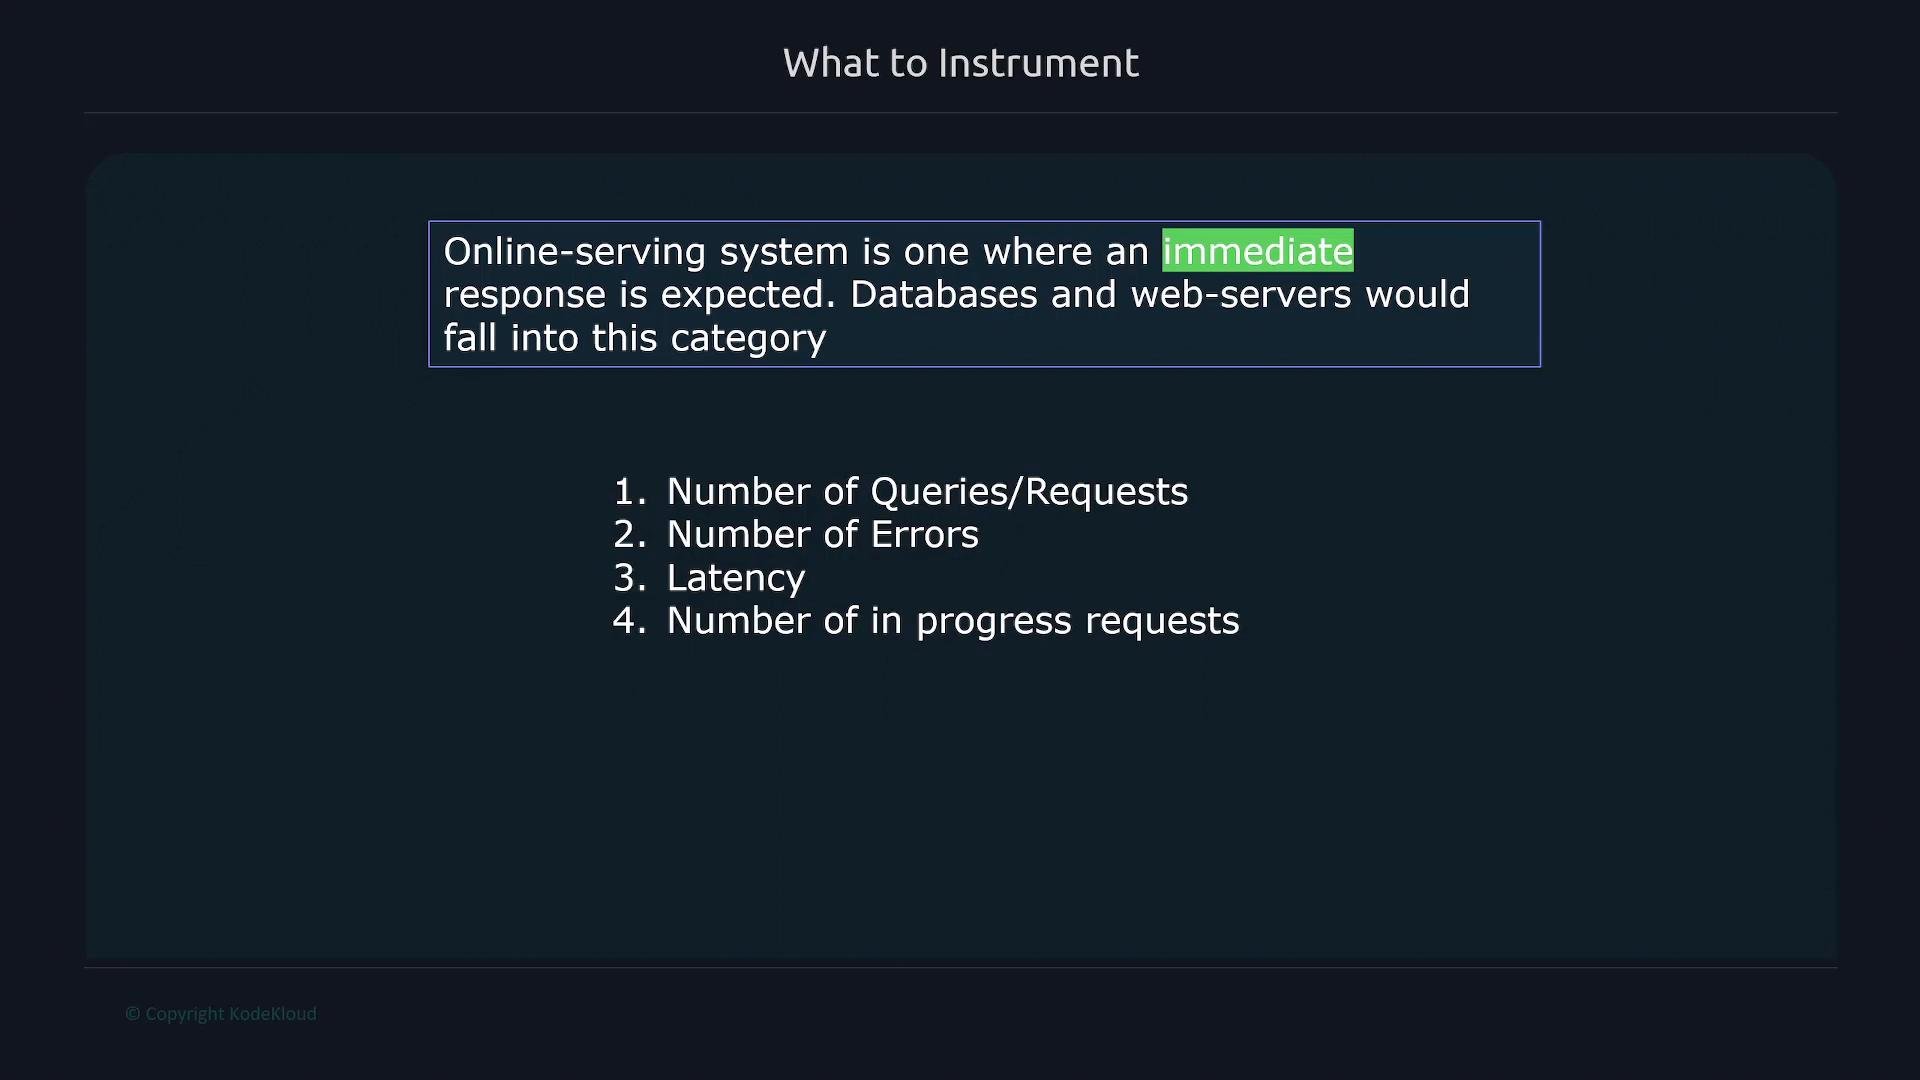
Instrumentation choices depend on the type of system you run. Below are typical metrics to collect for each system type and why they matter.Online-serving systems
(Examples: databases, web servers, APIs — systems expected to respond immediately.) Recommended metrics:- Total number of requests or queries (
_totalcounters) - Number of errors (counters or error-rate gauges)
- Latency distributions (histograms or summaries) — durations in
seconds - Number of in-progress requests (gauges)
Offline processing systems
(Examples: streaming pipelines or long-running workers that process data continuously.) For each pipeline stage, measure:- Amount of work processed (counters)
- Queued work size (gauges)
- Work in progress (gauges)
- Processing rate / throughput (derived from counters or a rate function)
- Error and failure counts (counters)
Batch jobs
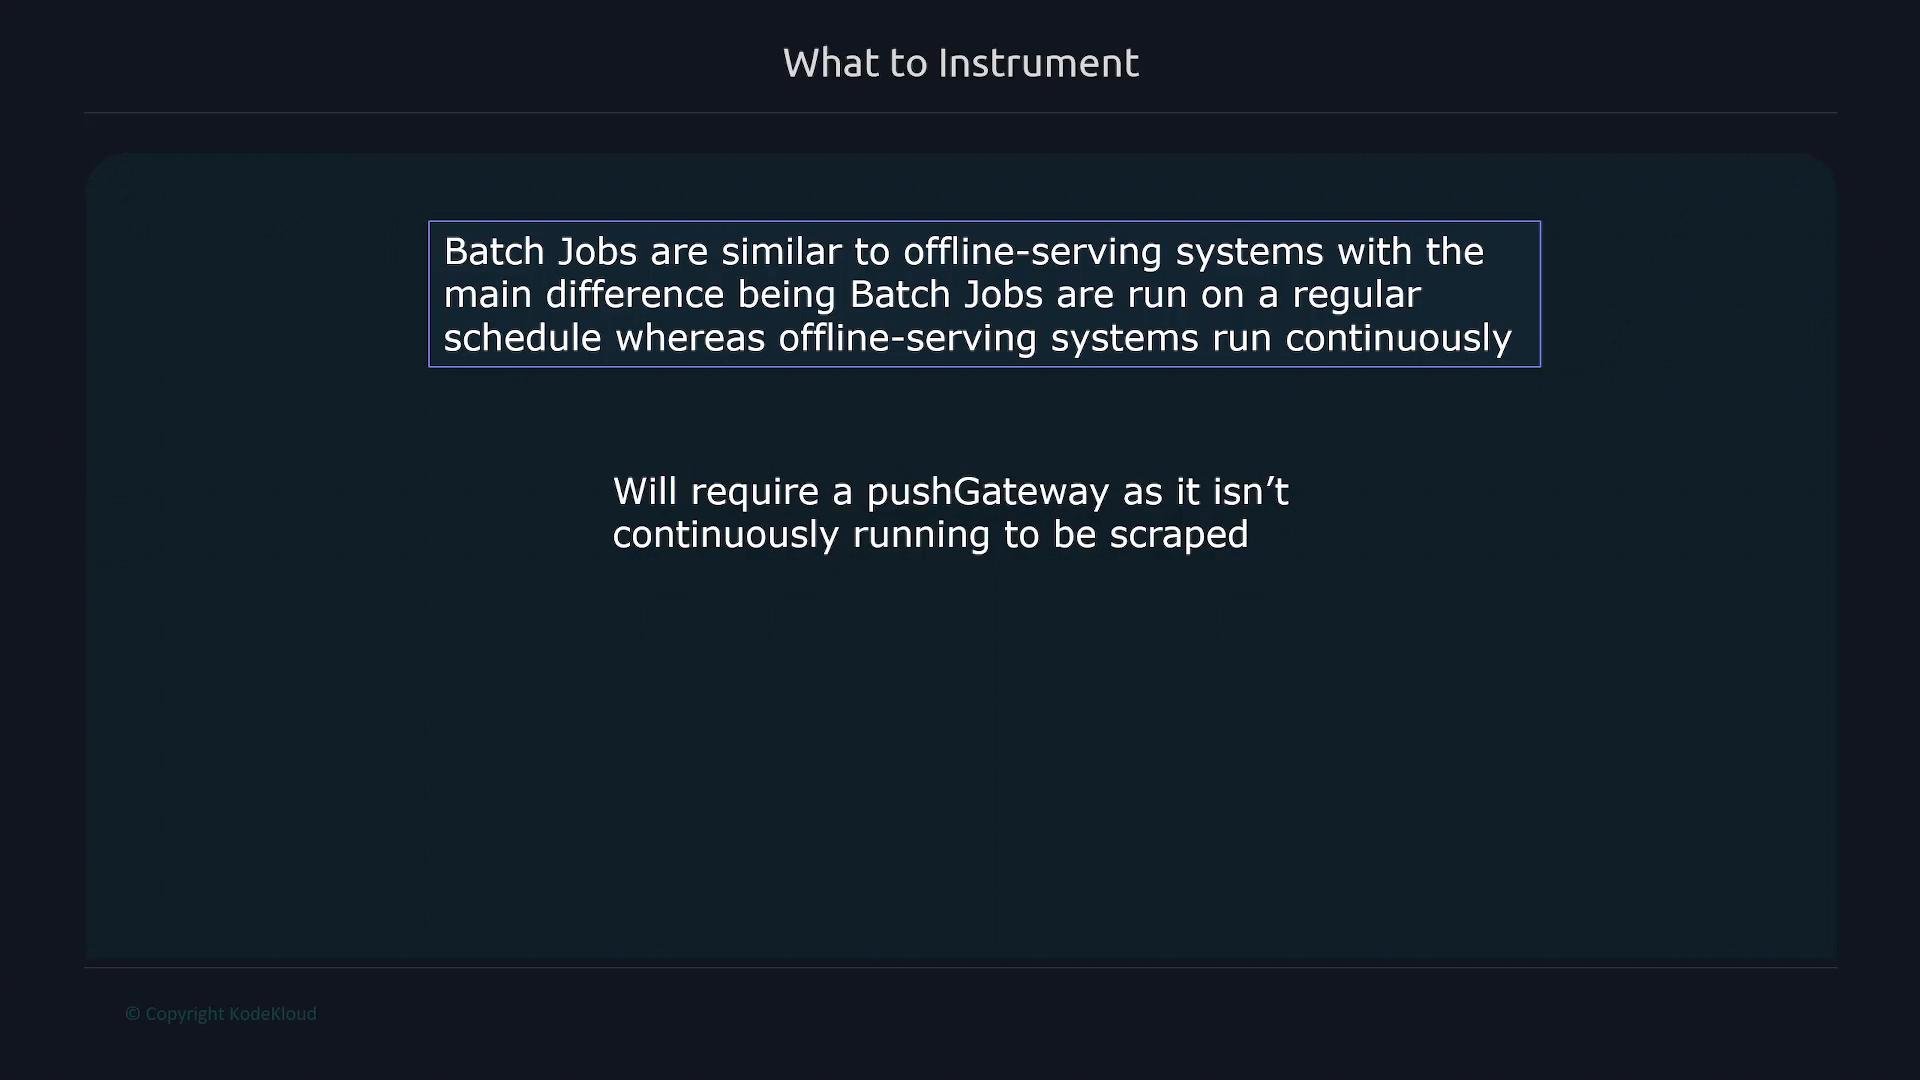
(Batch jobs run periodically or ad hoc, often short-lived.) Challenges:- Short-lived jobs may not be scrapeable directly by a Prometheus server.
- Use a push mechanism (for example, Prometheus Pushgateway) so the job can push metrics for later scraping.
- Time to process each stage (durations in
seconds) - Overall runtime (
seconds) - Success/failure counts (
_totalcounters) - Total items processed and throughput (counters and/or derived rates)
Quick reference: metrics by system type
Links and references
- Prometheus naming best practices: https://prometheus.io/docs/practices/naming/
- Prometheus introduction & architecture: https://prometheus.io/docs/introduction/overview/
- Prometheus Pushgateway (for short-lived jobs): https://prometheus.io/docs/practices/pushing/