

- Download the Node Exporter release for your platform
- Extract and run it locally (or as a service)
- Verify metrics on port
9100 - Add the target to your Prometheus
scrape_configs
Download Node Exporter
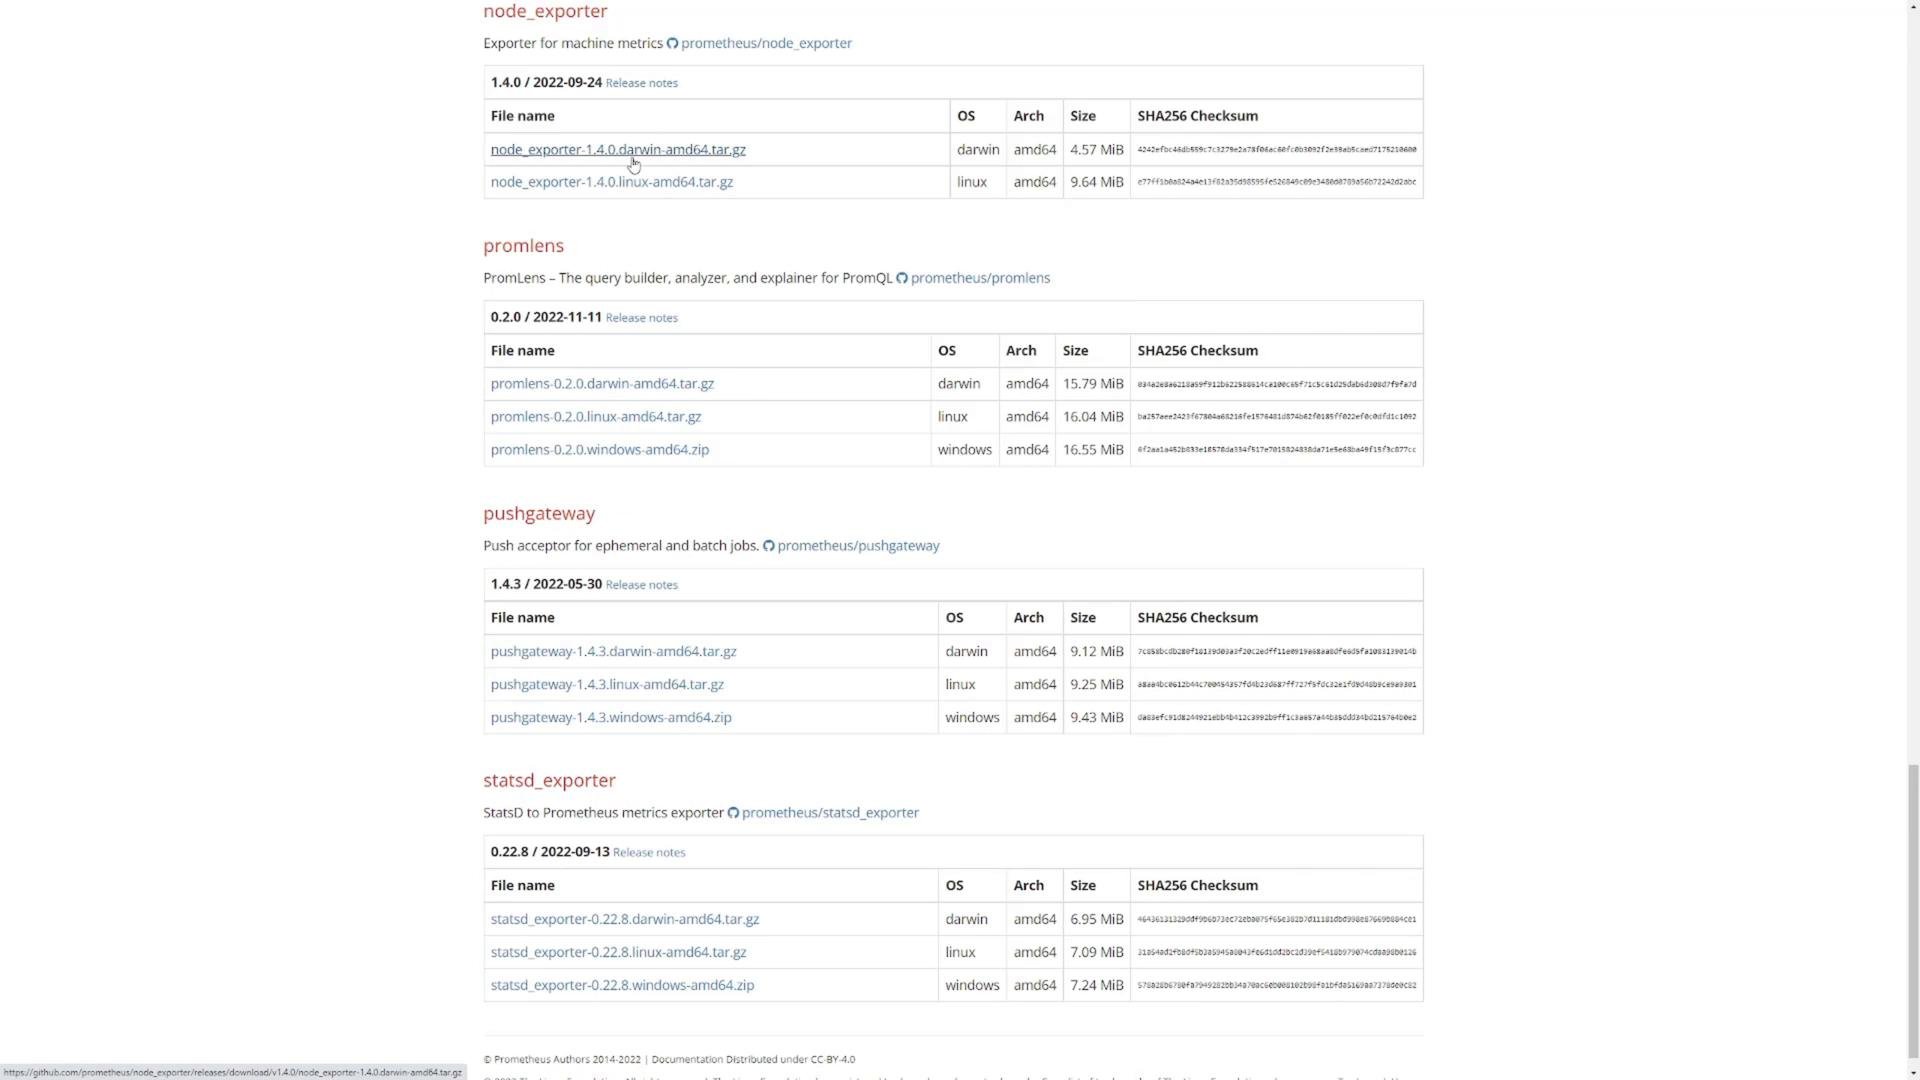
Open the Prometheus downloads page: https://prometheus.io/download/ and locate the Node Exporter section. Choose the release and OS/architecture that match your host (prefer the latest stable release), then copy the download URL. Download the tarball withwget (replace the URL with the one you copied; the example uses v1.3.1):
Extract and run
Extract the archive, change into the extracted directory, and start Node Exporter::9100 (the default port). Example log output:
http://localhost:9100/metrics in a browser if you are on the same machine or have network access.
Quick reference:
Add Node Exporter to Prometheus scrape config
Add a scrape job for Node Exporter in yourprometheus.yml. Replace the placeholder with the hostname or IP of the machine running Node Exporter:
- Local host:
targets: ['localhost:9100'] - Remote host:
targets: ['192.0.2.10:9100']
For production deployments run Node Exporter as a dedicated system service and user so it is managed across reboots. Create a Enable and start:
node_exporter user, copy the binary to a system path (for example /usr/local/bin/node_exporter), and use a systemd unit like the example below.