

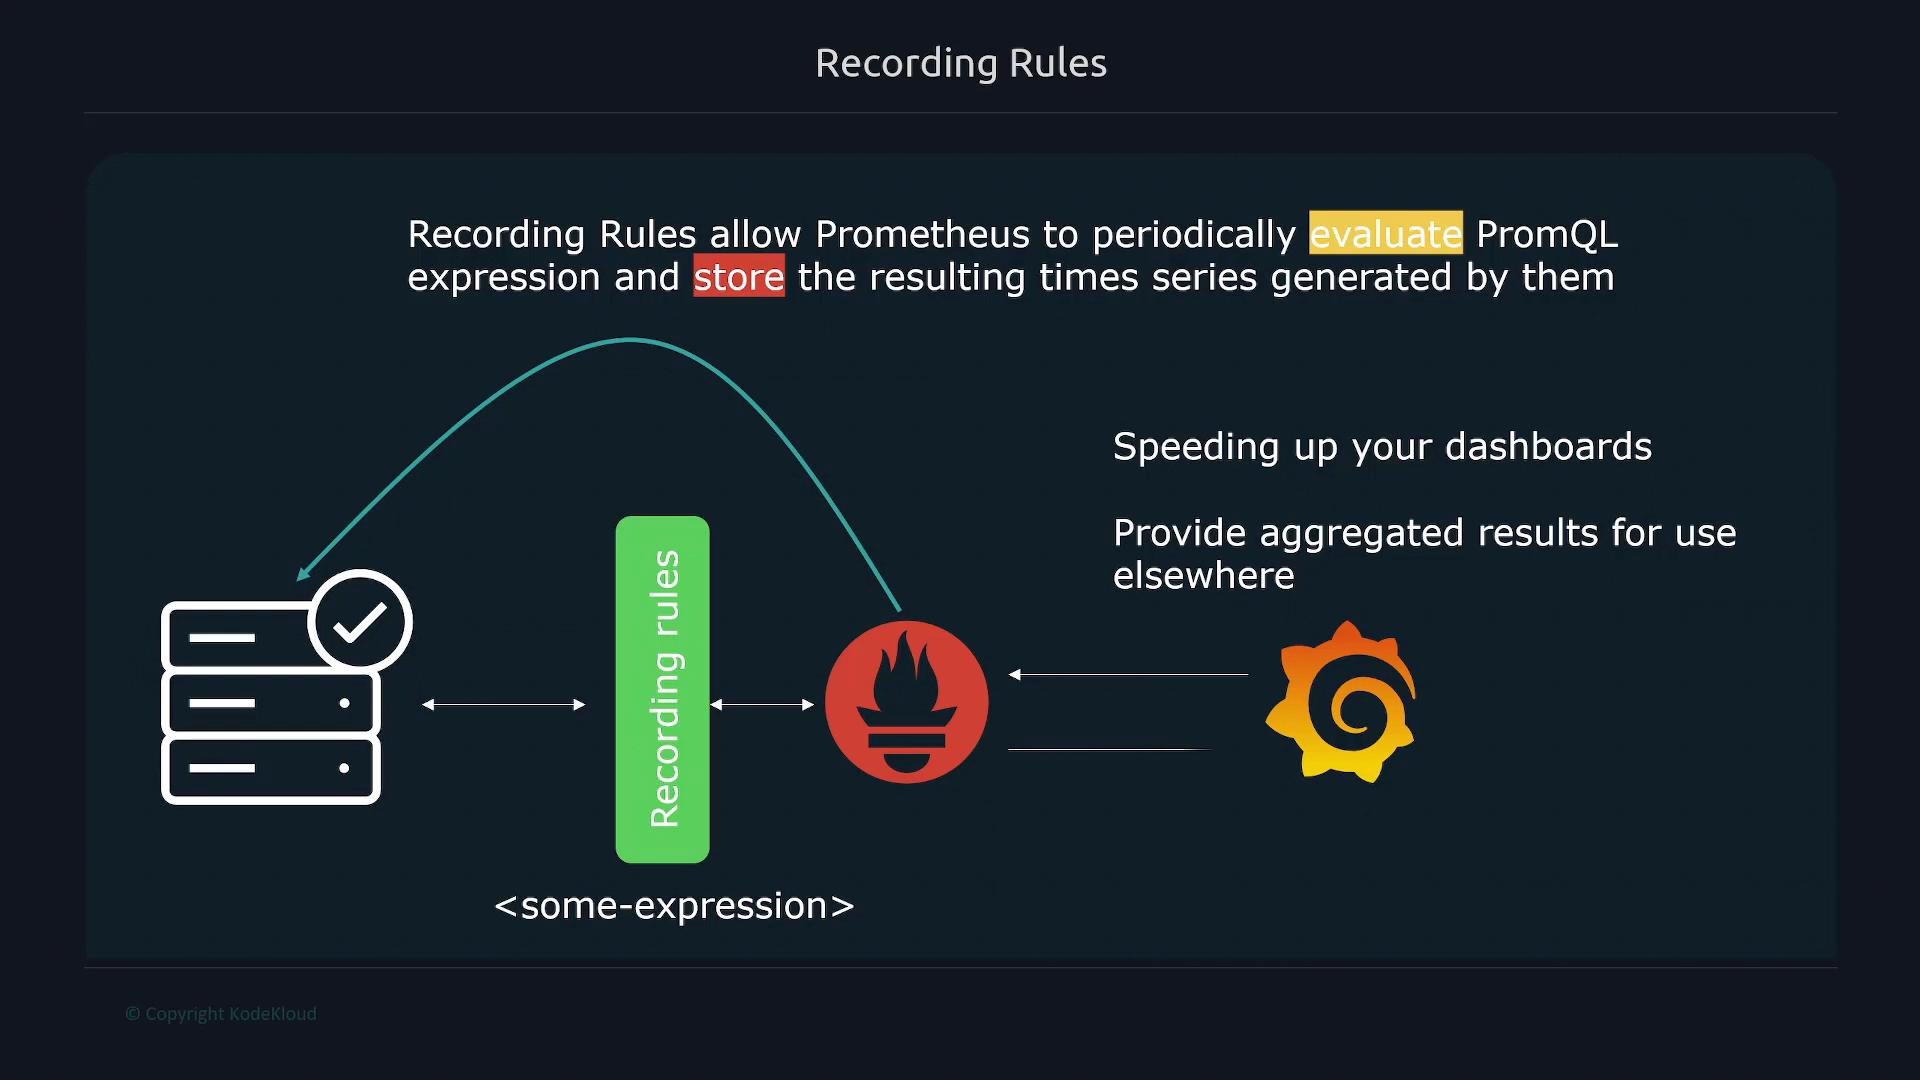
Configuration overview
- Define recording rules in rule files and list them under
rule_files:inprometheus.yml. - Prometheus evaluates each rule at its evaluation interval and stores the result as a new series whose metric name is the
recordvalue. rule_filesaccepts globs (for example,/etc/prometheus/rules/*.yml) so you can split rules across multiple files.- After editing rule files, Prometheus does not automatically pick them up unless you reload or restart Prometheus. Use the HTTP reload endpoint to avoid a full restart when possible.
After updating rule files, make sure to either reload Prometheus (
POST /-/reload) or restart the service. Failing to reload means Prometheus continues using the old rules.prometheus.yml (global intervals and rule_files):
Rule file structure
A rule file contains one or more rule groups under thegroups: key. Each group may define:
name: identifier for the group.interval(optional): overrides the globalevaluation_intervalfor rules in that group.rules: list of recording or alerting rules.
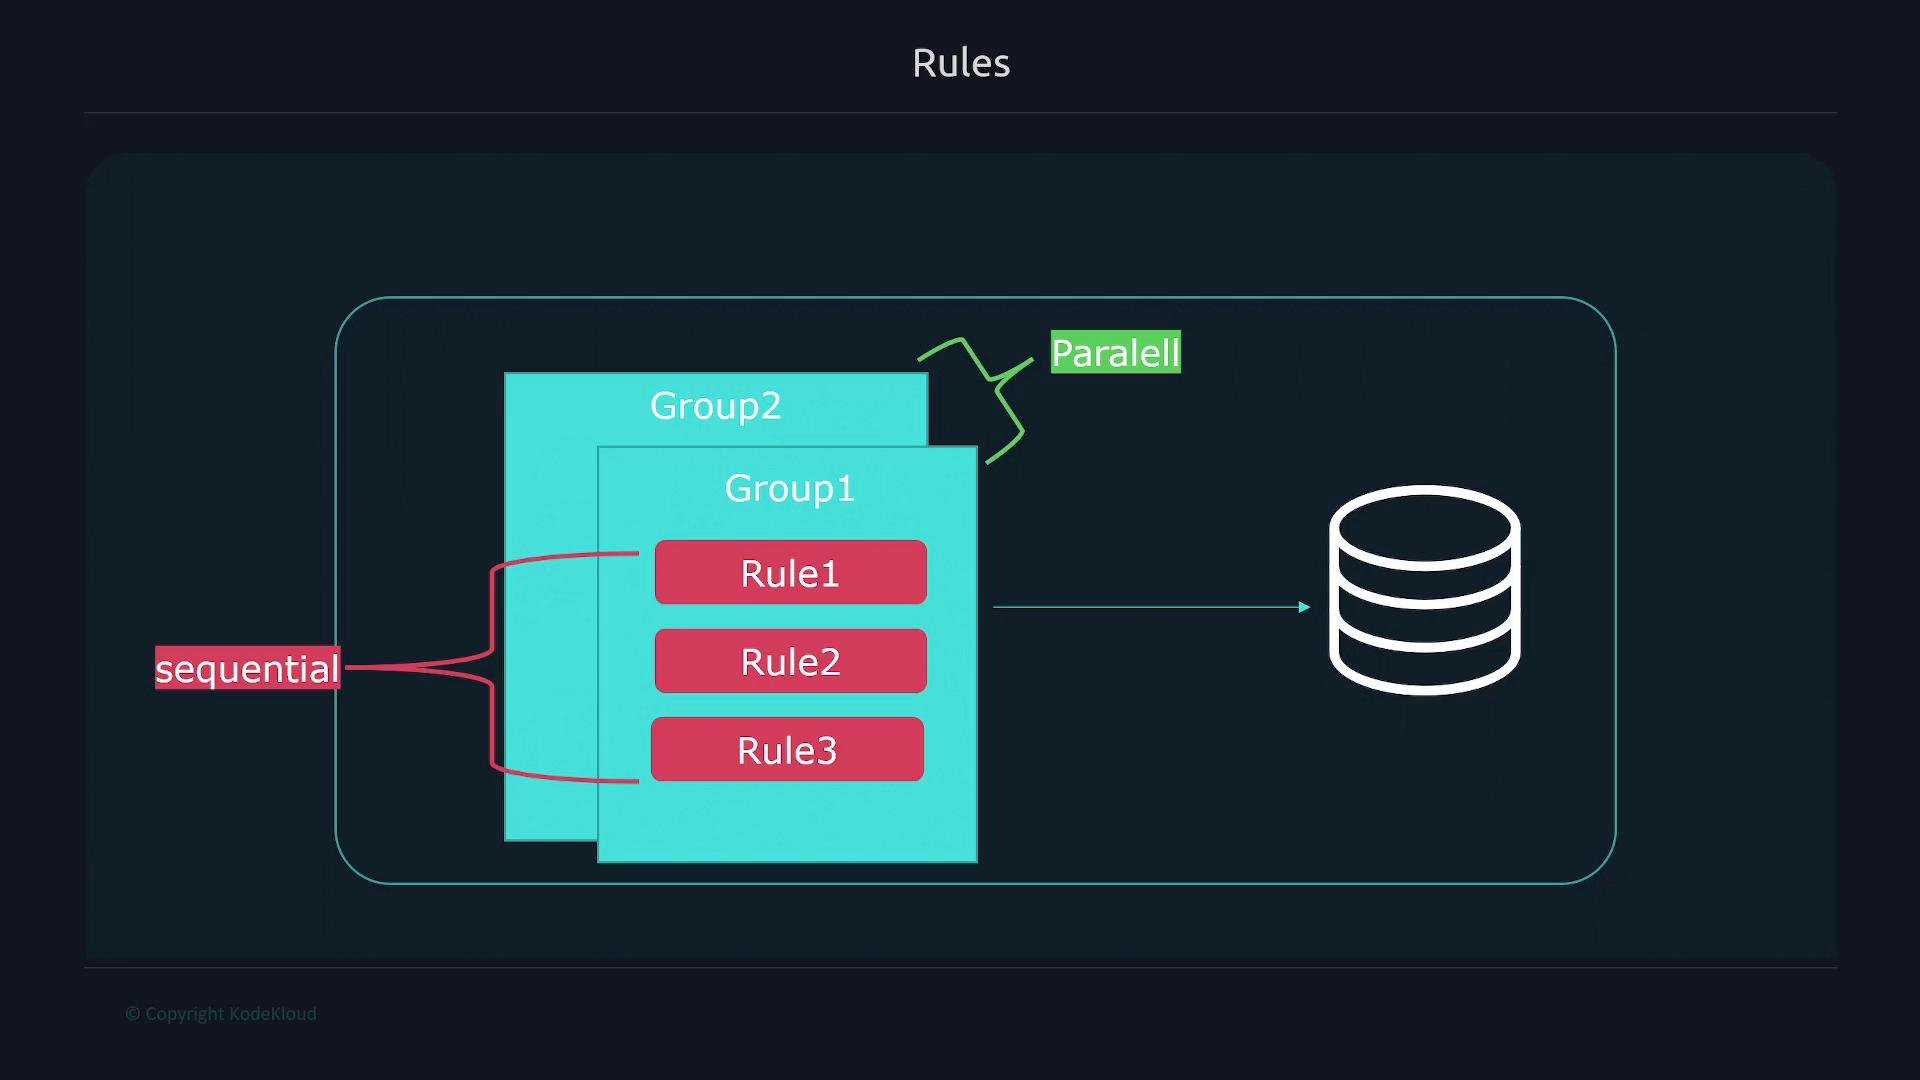
- Groups are evaluated in parallel.
- Rules within the same group are evaluated sequentially in the order declared. This allows later rules in a group to reference metrics recorded by earlier rules during the same evaluation run.
Rule fields
PromQL examples (raw expressions)
Calculate percentage of used memory:node_memory_MemAvailable_bytes is generally a better estimate of available memory than node_memory_MemFree_bytes. If your exporter doesn’t expose MemAvailable, you can fall back to MemFree, but it may underestimate actual available memory.
Calculate percentage of free space on filesystems:
Recording rule example
This sample rule group computes per-filesystem free percent, then produces an instance-level average. Therecord name becomes a new metric you can query directly.
Best practices for naming recording rules
Use a structured name to indicate the aggregation level, the base metric, and operations performed. A common pattern is: level:metric_name:operations- level: label set left after aggregation (e.g.,
job,job_method) - metric_name: base metric or subject (e.g.,
http_errors) - operations: transformations (e.g.,
rate5m,sum,avg)
http_errors aggregated by job, method, and path:
path from aggregation, change level to job_method. Remove method too and level becomes job.
Grouping rules by job
Keep rules for a specificjob together in one group. This simplifies management and makes sequential dependencies explicit.
Example structure:
Deploying rule files
- Create a rule file (e.g.
/etc/prometheus/rules.yml) and add yourgroups:content. - Ensure
prometheus.ymllists the file underrule_files. - Reload Prometheus config or restart Prometheus.
Checking rules in the UI
Open the Prometheus expression browser and visit Status → Rules. You will see rule groups and the evaluation status (OK, Error, etc.). You can also query recorded metrics by theirrecord name in the expression browser or in Grafana.
Documentation reference: Prometheus recording rules and management
Example rule definitions (quick reference)
Example query results (recorded metrics)
- Use descriptive
recordnames following thelevel:metric_name:operationspattern to keep metric namespaces consistent and understandable. - Prefer using the HTTP reload endpoint for production systems to avoid disrupting scraping and state where possible.
- Keep rule groups small and focused per job so dependencies (sequential rules) are explicit and predictable.