

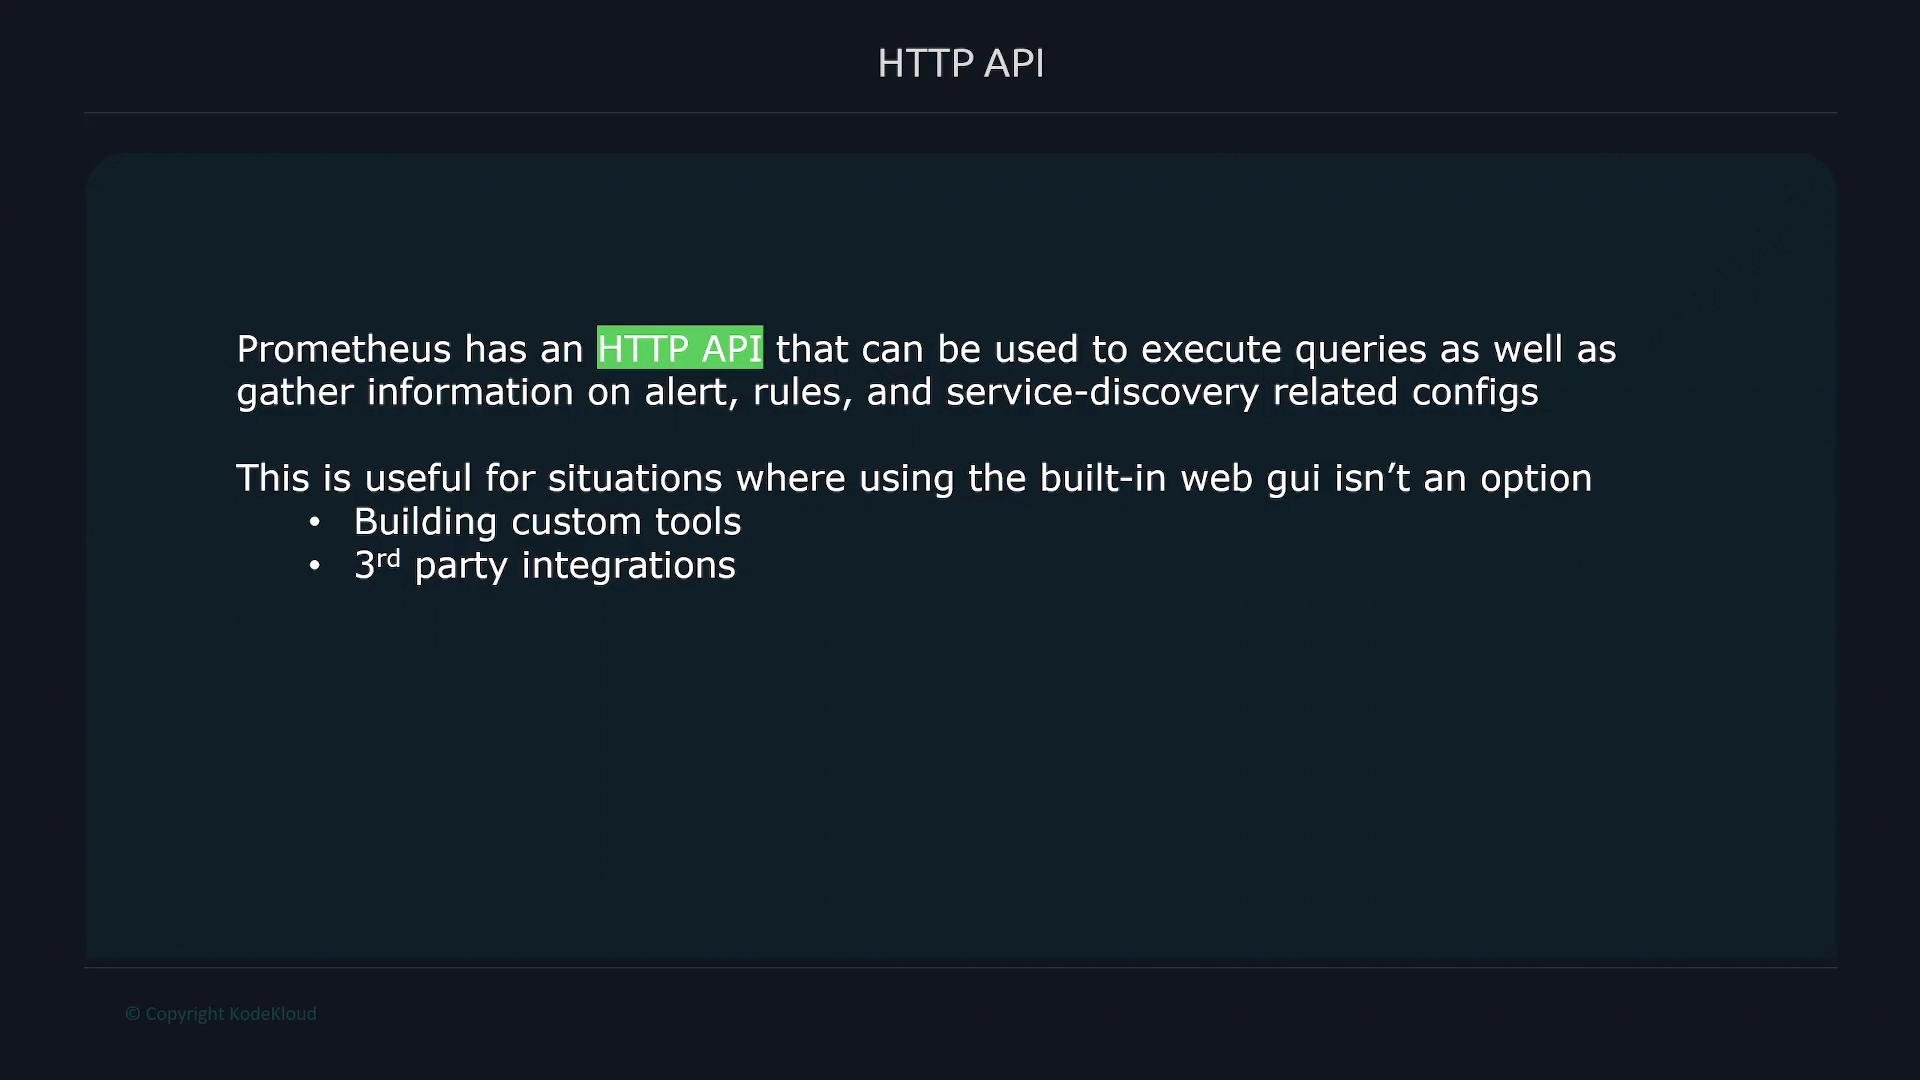
Make sure your Prometheus server is reachable from the host running your API calls. Many production Prometheus instances are restricted by firewall, reverse proxy, or authentication — check your deployment’s network and security configuration before calling the API.
Key query endpoints
The primary endpoints for querying metrics are:
Replace the placeholder
http://<prometheus-ip> with your Prometheus server address (for example, http://localhost:9090 or http://prom.example.com).
Instant (single-point) queries
To execute an instant vector query, call the/api/v1/query endpoint and provide the PromQL expression as the query parameter. Using POST avoids URL length limitations and simplifies quoting.
Example: query ARP entries for a specific node
- PromQL:
node_arp_entries{instance="192.168.1.168:9100"} - Endpoint:
http://<prometheus-ip>/api/v1/query
--data(or-d) triggers a POST request. You can use GET by URL-encoding thequeryparameter, but POST is usually more convenient for long queries.- Wrap the entire
--datavalue in single quotes and use double quotes inside label selectors to avoid shell quoting issues.
Querying a specific timestamp
To retrieve the value at a particular point in time, add thetime parameter (Unix timestamp with optional fractional seconds, or RFC3339).
Example:
Example: instant vector query with pretty output
Query CPU seconds for thenode job and pipe to jq to pretty-print the JSON:
jq:
value array contains two elements: the timestamp (Unix epoch with fractional seconds) and the metric value as a string.
Querying a metric at a given time
Example: fetchnode_memory_Active_bytes at a specific timestamp:
Range vectors and matrix results
To retrieve a series of samples (a range vector), include a duration selector in the PromQL expression. This returns aresultType of "matrix" where each result has a values array with timestamp/value pairs.
Example: last 10 minutes relative to a given time:
/api/v1/query_range endpoint with start, end, and step parameters:
Example:
Summary & quick reference
- Instant queries:
http://<prometheus-ip>/api/v1/query— providequery, optionallytime. - Range queries (even sampling):
http://<prometheus-ip>/api/v1/query_range— providequery,start,end,step. - Range vectors in PromQL (e.g.,
metric[10m]) return"matrix"resultType withvaluesarrays. - Pipe responses to
jqfor readable JSON output.
Links and references
- Prometheus HTTP API: https://prometheus.io/docs/prometheus/latest/querying/api/
- PromQL basics: https://prometheus.io/docs/prometheus/latest/querying/basics/
- jq: https://stedolan.github.io/jq/
- Grafana: https://grafana.com
Prometheus query endpoints accept both GET and POST. Use POST (or
--data) for convenience and to avoid URL length issues with long queries.