

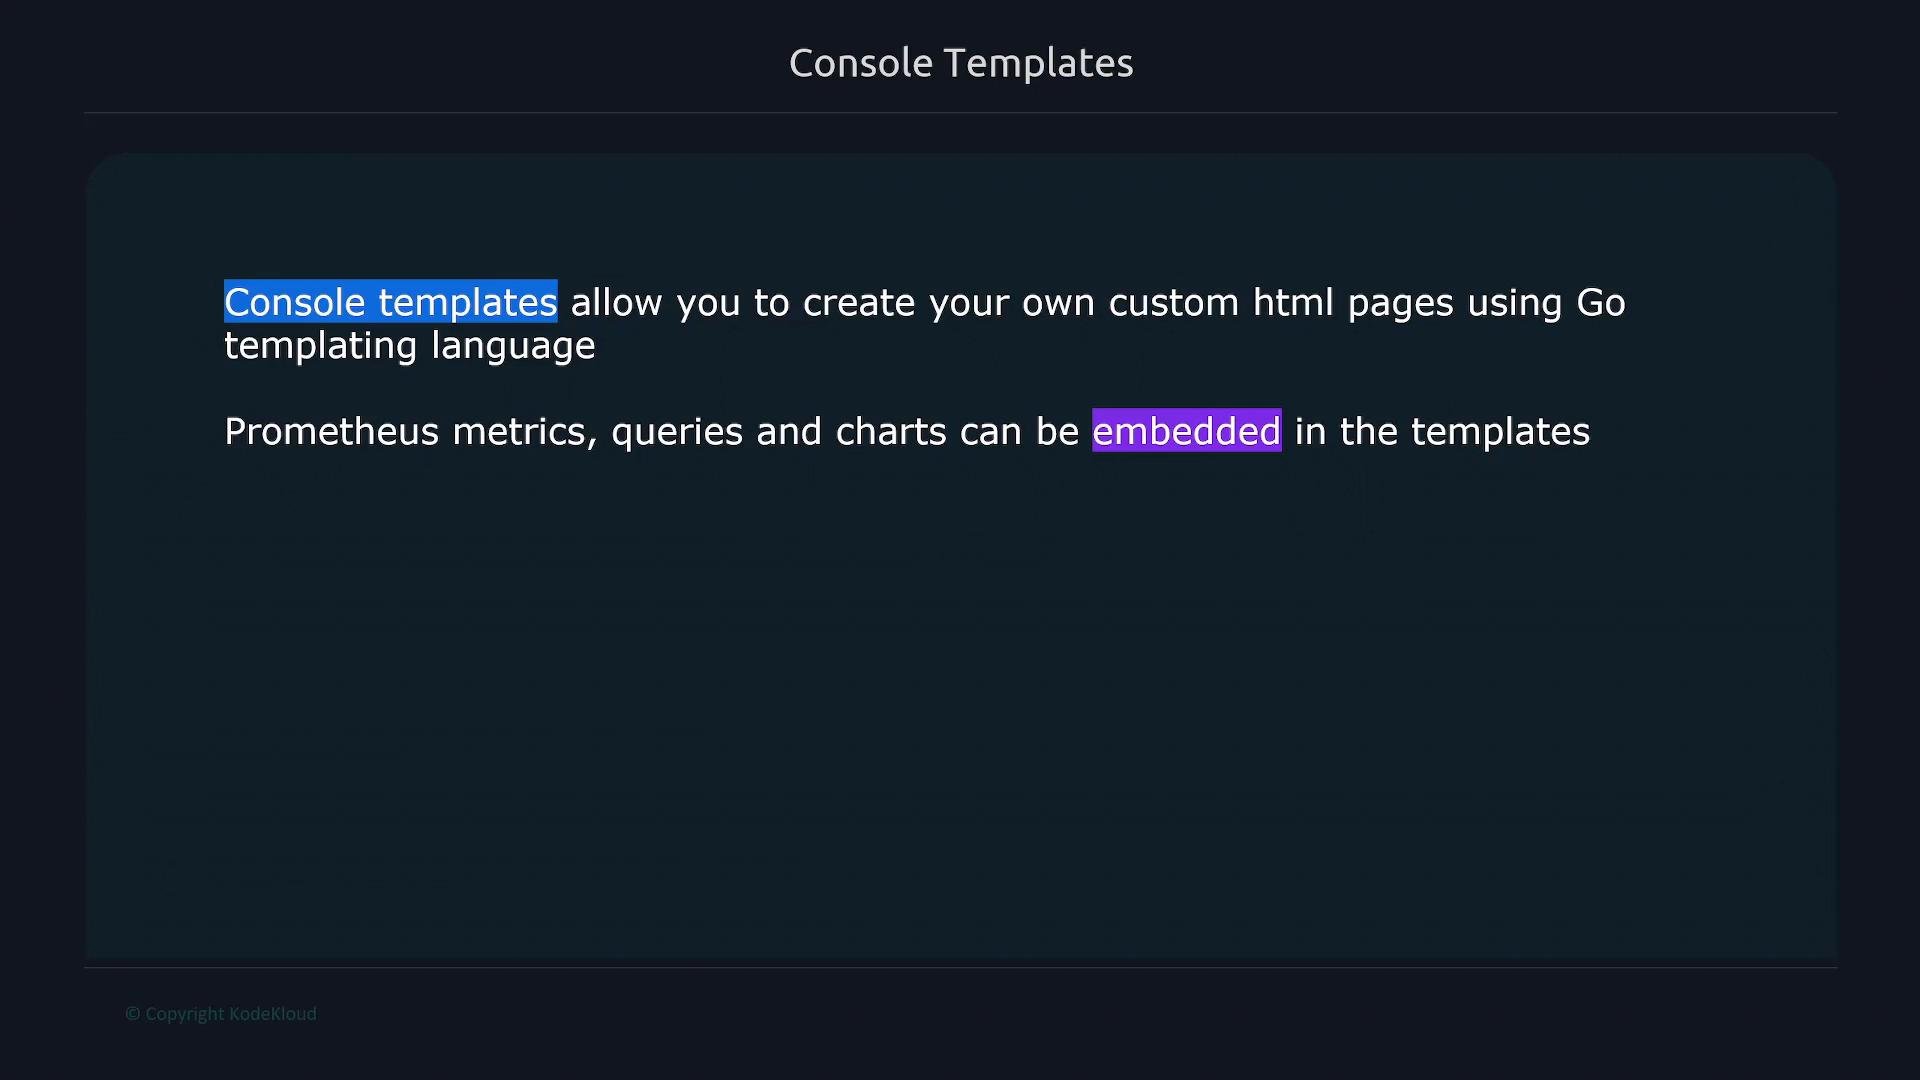
- Template files are stored on disk, typically under
/etc/prometheus/consoles. - Prometheus ships with several example templates you can reuse or adapt.
- Templates are rendered at request time; you usually do not need to restart Prometheus after adding or editing files (permissions permitting).
You can also inspect the directory directly:
- Anything inside double curly braces
{{ ... }}is a Go template expression. - Most console files import shared template fragments such as
head,tail, and content wrappers. - Built-in helper templates (e.g.,
prom_query_drilldown) render metric values and provide clickable drilldowns into the Prometheus expression browser.
index.html.example (kept in the template directory):
/consoles path, for example:
http://<prometheus-server>:9090/consoles/index.html.example
The example consoles include dashboard-like pages such as a Node overview which shows CPU, disk I/O, memory, and a right-hand summary panel for system stats.
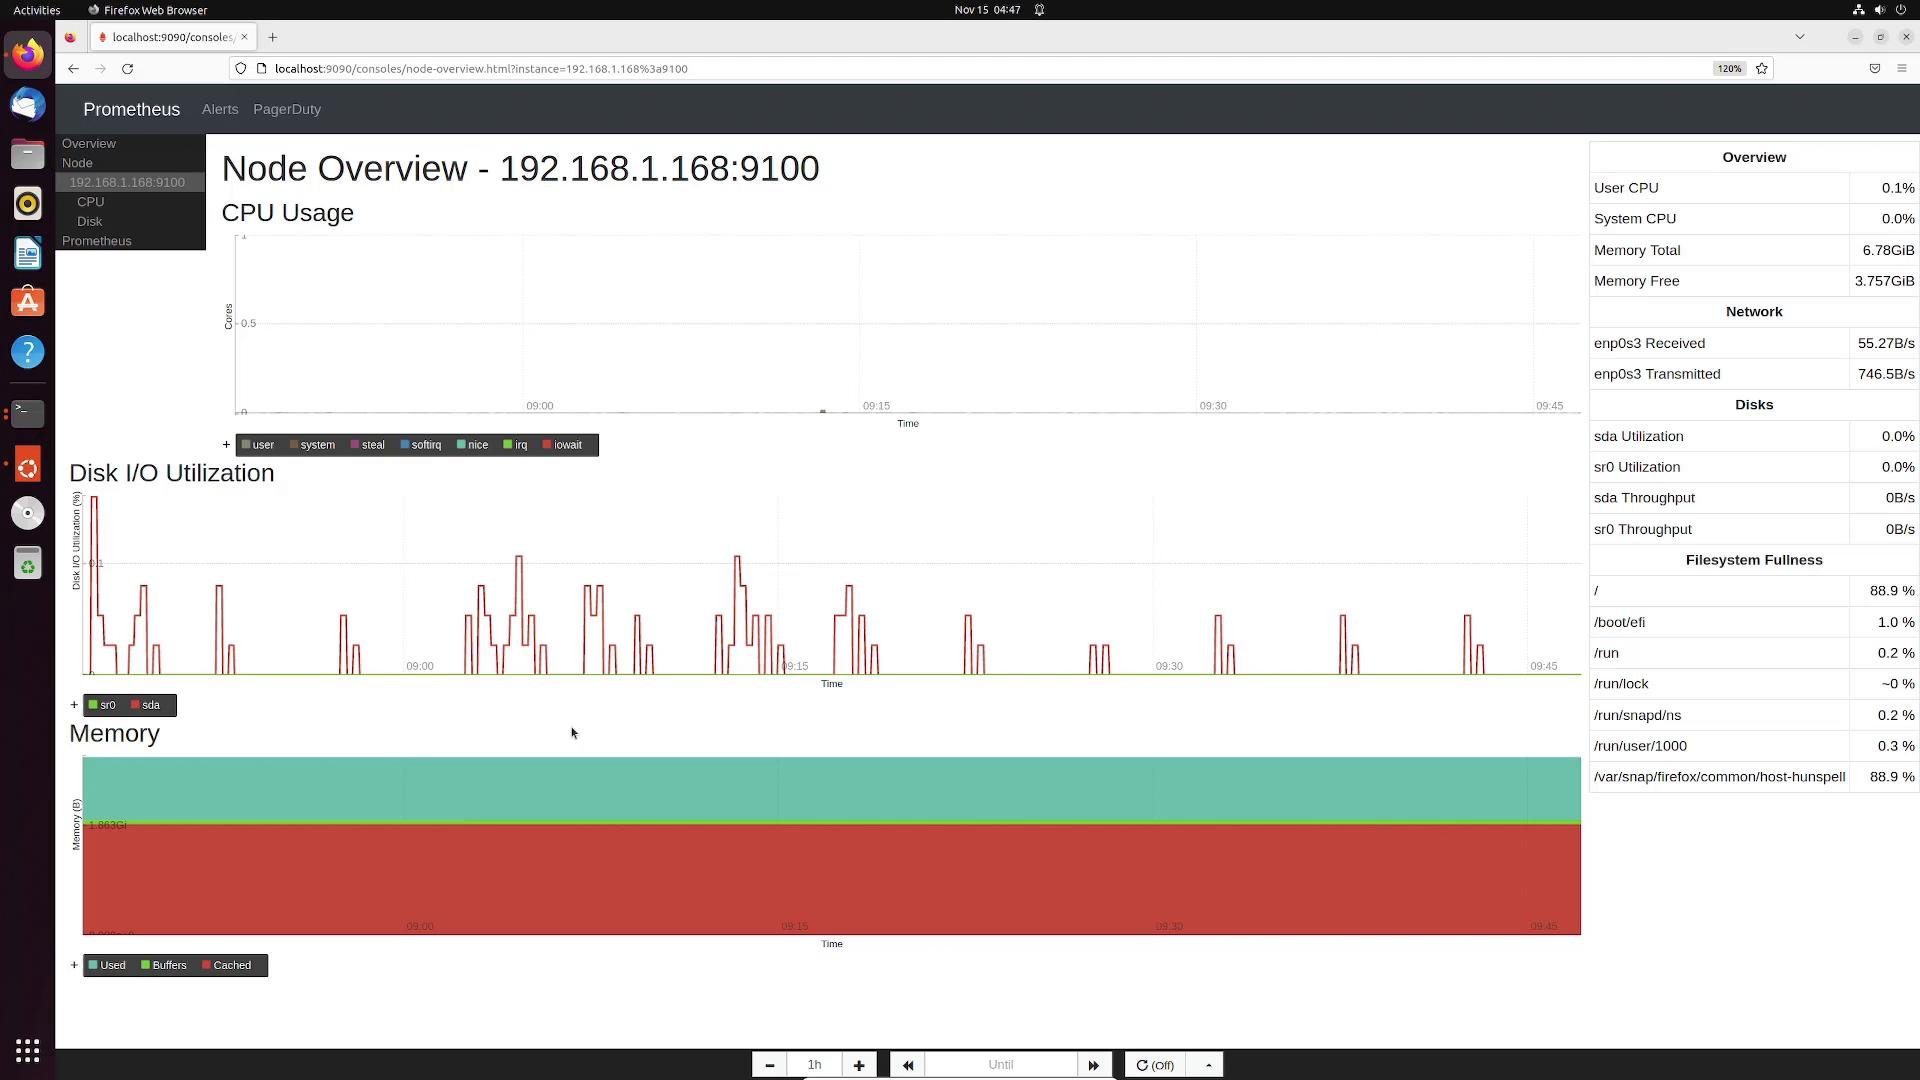
Console templates are served directly from disk under
/consoles. Ensure the Prometheus process can read any files you add there. Templates are loaded at request time, so you generally do not need to restart Prometheus after adding or modifying a console file.A minimal example: creating demo.html
This step-by-step shows how to create a small console that uses the shared header/footer, displays a metric value as a clickable drilldown, and embeds a chart by referencing Prometheus’ own graph UI inside an iframe.
- Change to the consoles directory and open an editor:
- Paste the following HTML (this is regular HTML using Go template expressions to include the shared fragments):
- The
{{ template "prom_query_drilldown" "node_memory_Active_bytes" }}line renders the current value and makes it clickable so it opens the expression in Prometheus’ expression browser. - Using an iframe that points to
/graphembeds Prometheus’ graph UI for that PromQL expression. This is a simple, compatible way to present charts without external dashboard tools.
- Save and open the page:
http://<prometheus-server>:9090/consoles/demo.html
You should see the shared header, the H1 title, the active memory value rendered by the drilldown template, and an embedded time-series graph for node_memory_Active_bytes.
Example rendered metric text might look like:
If you add files under
/etc/prometheus/consoles, ensure ownership and permissions allow the Prometheus process to read them (e.g., chown prometheus:prometheus and appropriate chmod). Otherwise the templates will not be served.- Small, focused dashboards that combine metric values, charts, tables, and drilldowns.
- Reusable template fragments for organization-wide dashboards (headers, sidebars, footers).
- Per-host or per-service pages that link directly into the Prometheus expression browser.
- Prometheus documentation — Console templates
- Prometheus expression browser and graph UI
- Prometheus main docs