

Focus on Thanos’s purpose: providing a single, scalable query layer, deduplication for HA Prometheus setups, and long-term storage by shipping Prometheus TSDB blocks to object storage. You do not need to memorize every architectural detail—understanding these roles is enough to design and operate a Thanos-enabled monitoring stack.
- A single “pane of glass” to query metrics across multiple Prometheus servers.
- Deduplication for high-availability setups where multiple Prometheus instances scrape the same targets.
- Cost-effective long-term storage by uploading Prometheus TSDB blocks to object stores such as Amazon S3 or Azure Blob Storage, preventing unbounded growth of Prometheus local disks.
- Thanos sidecar: Runs alongside each Prometheus instance (same host or pod). It exposes Prometheus data over gRPC and uploads TSDB blocks to the configured object storage.
- Thanos Store (store gateway): Reads TSDB blocks from the object store and makes historical data available for queries.
- Thanos Query: The query layer that federates queries across Prometheus sidecars (for recent/live data) and Thanos Store components (for historical data), merges results, and applies deduplication when needed.
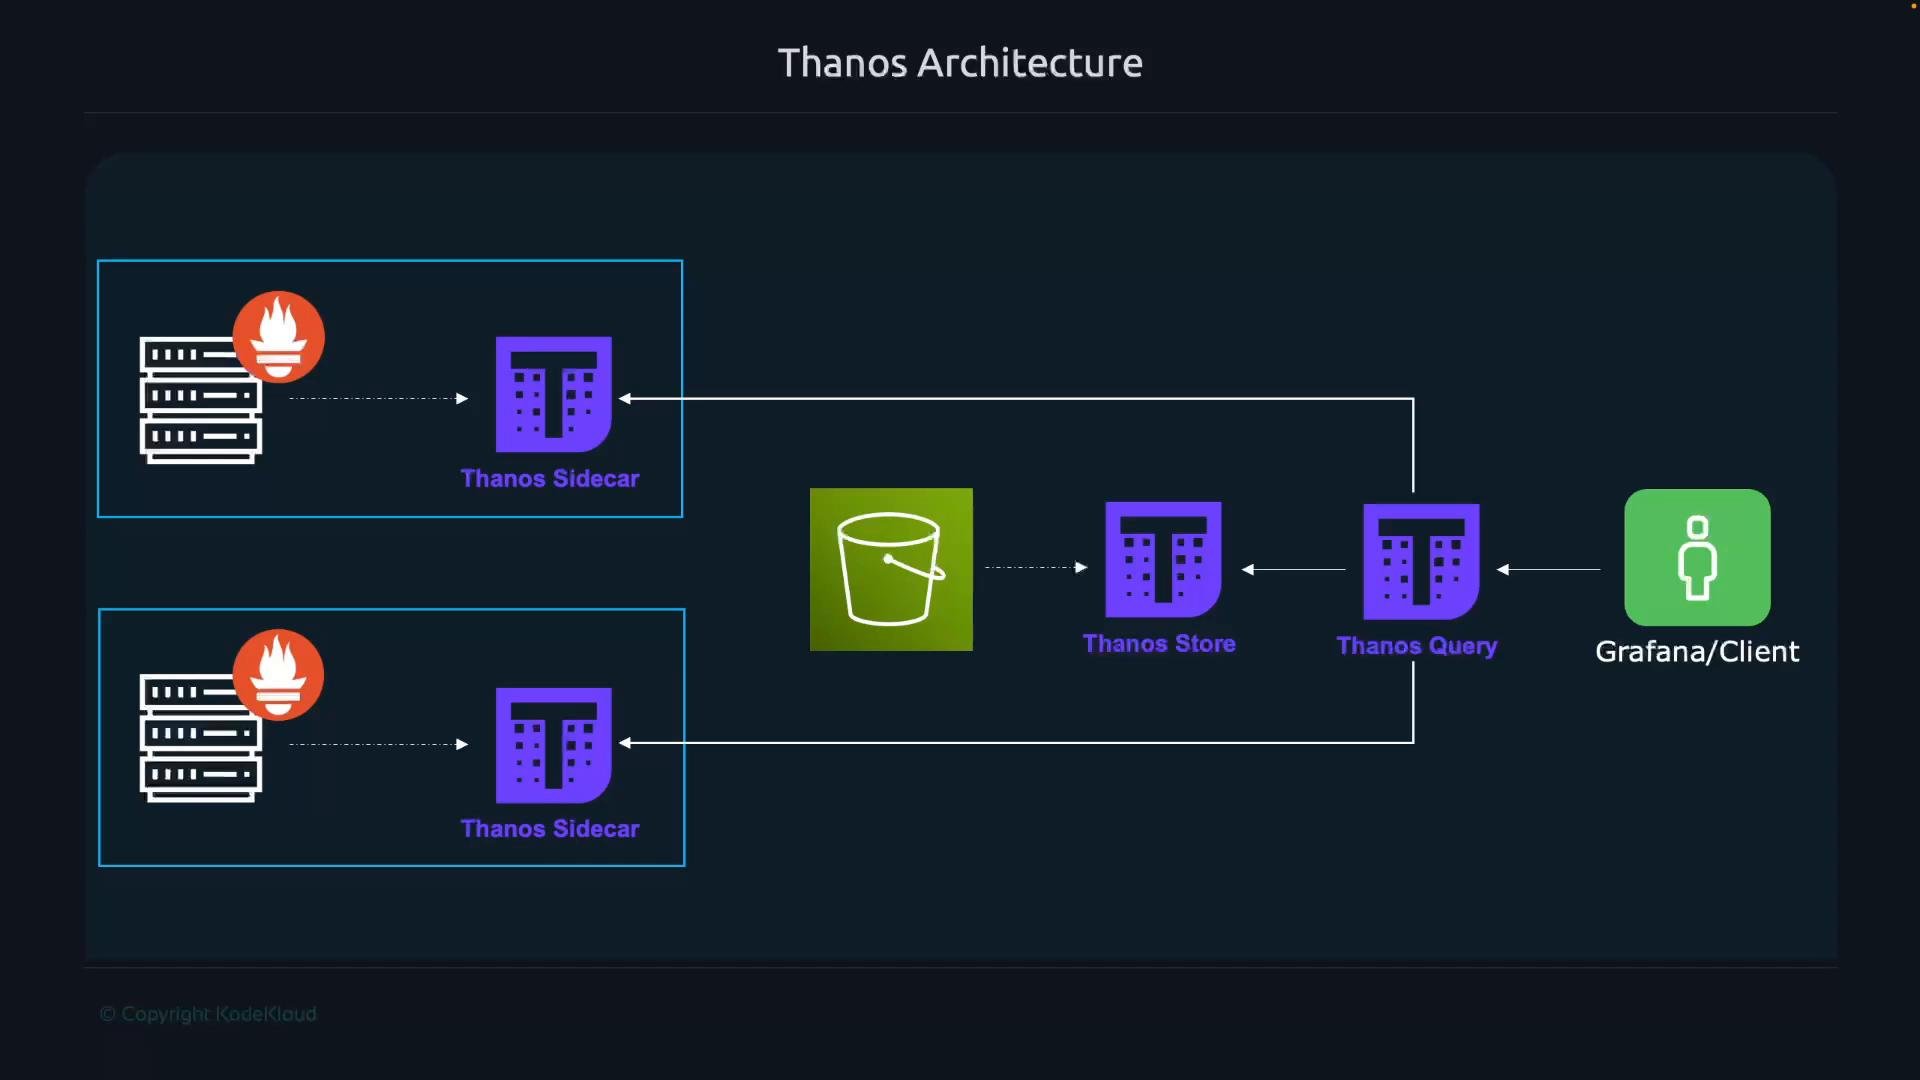
How queries flow:
- A user issues a PromQL query to Thanos Query.
- Thanos Query contacts Prometheus sidecars to retrieve recent/real-time samples.
- It also queries Thanos Store components to fetch historical data stored in the object store.
- Thanos Query merges the results, applies deduplication when necessary, and returns the final response to the client (for example, Grafana).
Set both
--storage.tsdb.min-block-duration and --storage.tsdb.max-block-duration to the same value to effectively prevent Prometheus from compacting blocks. Let Thanos components handle compaction and retention to avoid inconsistencies in object storage.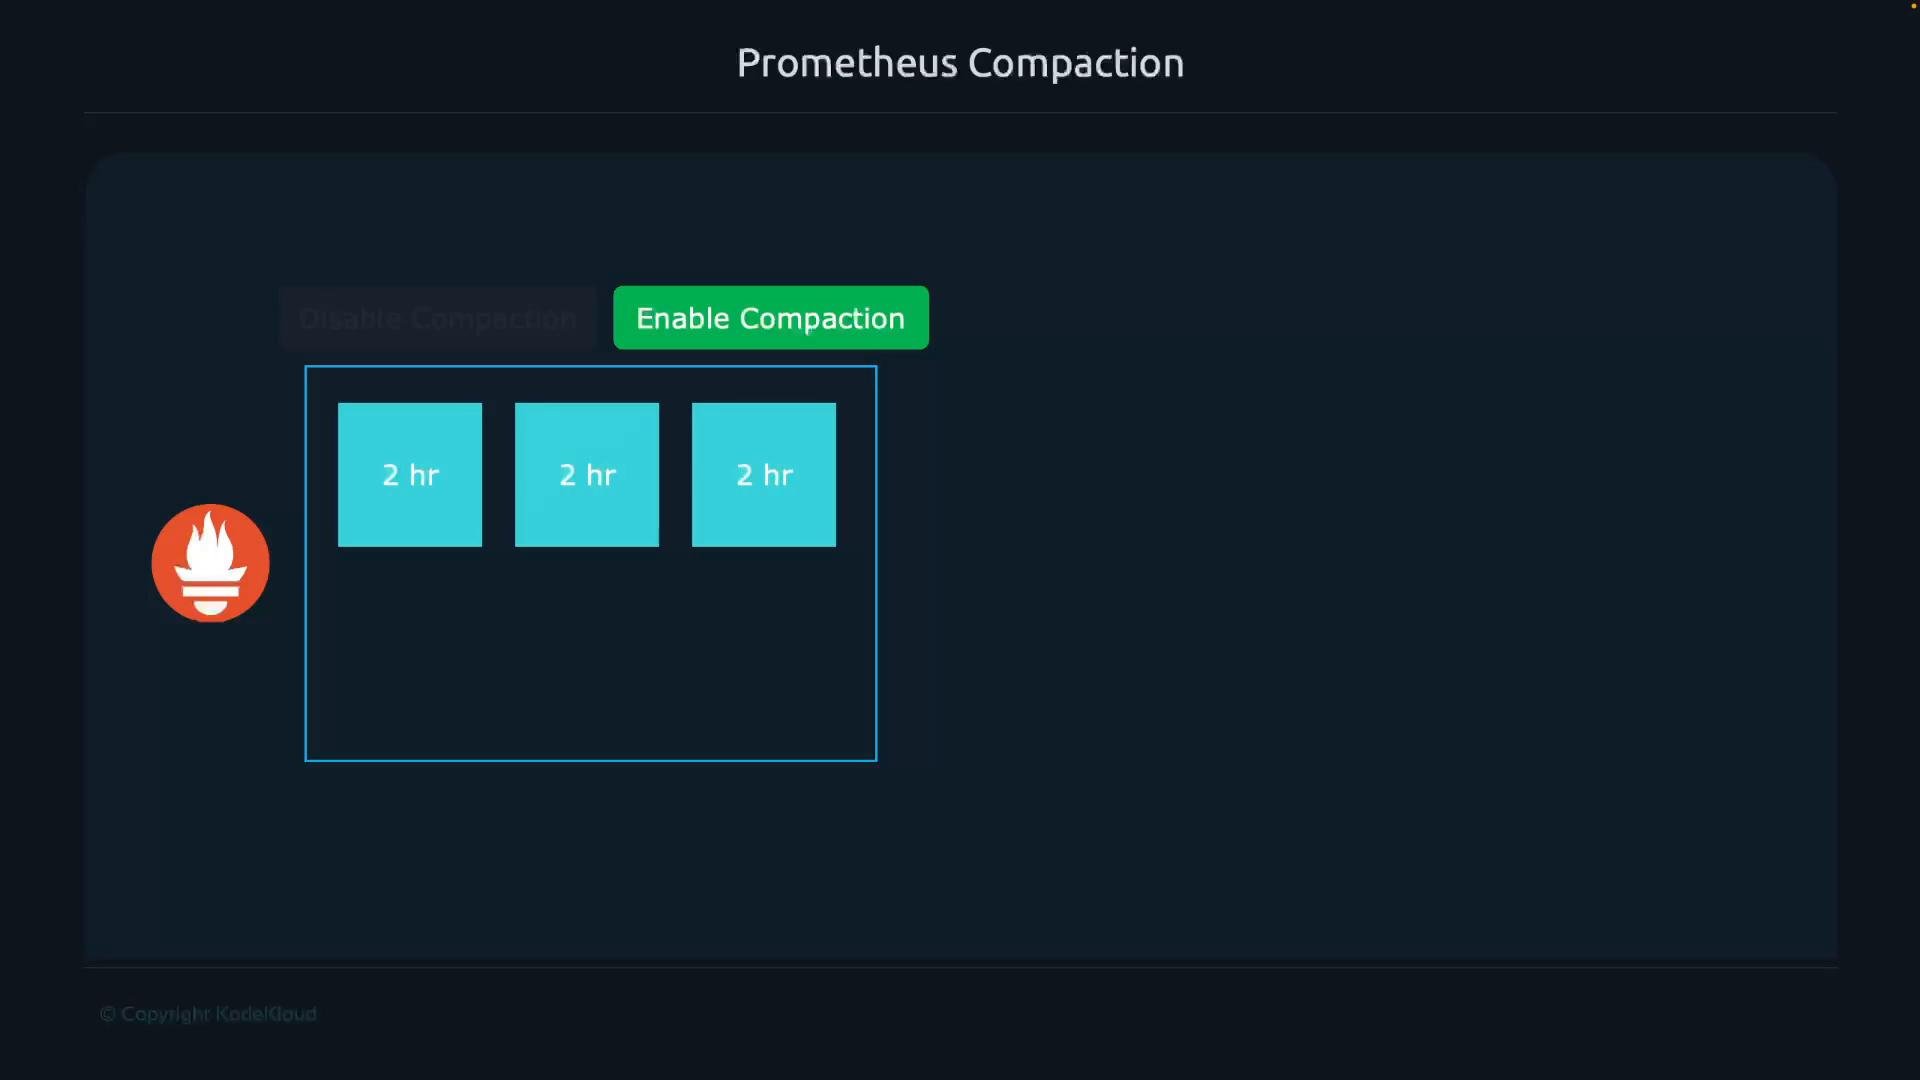
- A unified query layer across multiple Prometheus servers.
- Deduplication for HA Prometheus setups.
- Long-term, cost-effective storage by uploading Prometheus TSDB blocks to object stores.
- Prometheus: Querying basics (PromQL)
- Prometheus TSDB storage documentation
- Thanos project on GitHub
- Amazon S3
- Azure Blob Storage