

node_cpu_seconds_total and node_filesystem_files to demonstrate:
- Exact label matches and negation
- Regular-expression (regex) matching and negation
- Turning instant vectors into range vectors
- Shifting queries with
offset - Evaluating queries at a specific time with the
@modifier
Label selector values must be quoted (for example,
cpu="0"). Regular-expression operators are =~ (match) and !~ (not match). Negation for exact matches uses !=. Always quote label values and regexes.Inspecting a metric with labels
Below is an example output for thenode_cpu_seconds_total metric. It shows values for two CPUs and different modes:
- Select only CPU 0 with an exact match:
- Select all CPUs except CPU 0 using negation:
- Convert the instant vector into a range vector for the last 2 minutes:
- Filter by multiple labels (CPU 0 and idle mode):
Filtering with regular expressions
Considernode_filesystem_files output that includes several mount points:
- Match mountpoints that start with
/runusing a regex match (=~):
- Negate the regex match to get everything that does not contain
/run(use!~):
Time ranges, offset, and the @ modifier
To request a time window for a selection, append a range vector in square brackets:
- Last 5 minutes for mountpoints that match
/run:
- Shift that same 5-minute window back by 30 minutes with
offset:
- Evaluate an expression at an explicit Unix epoch timestamp with
@. Many UIs such as Grafana provide time selectors, but raw PromQL supports@for reproducible queries.
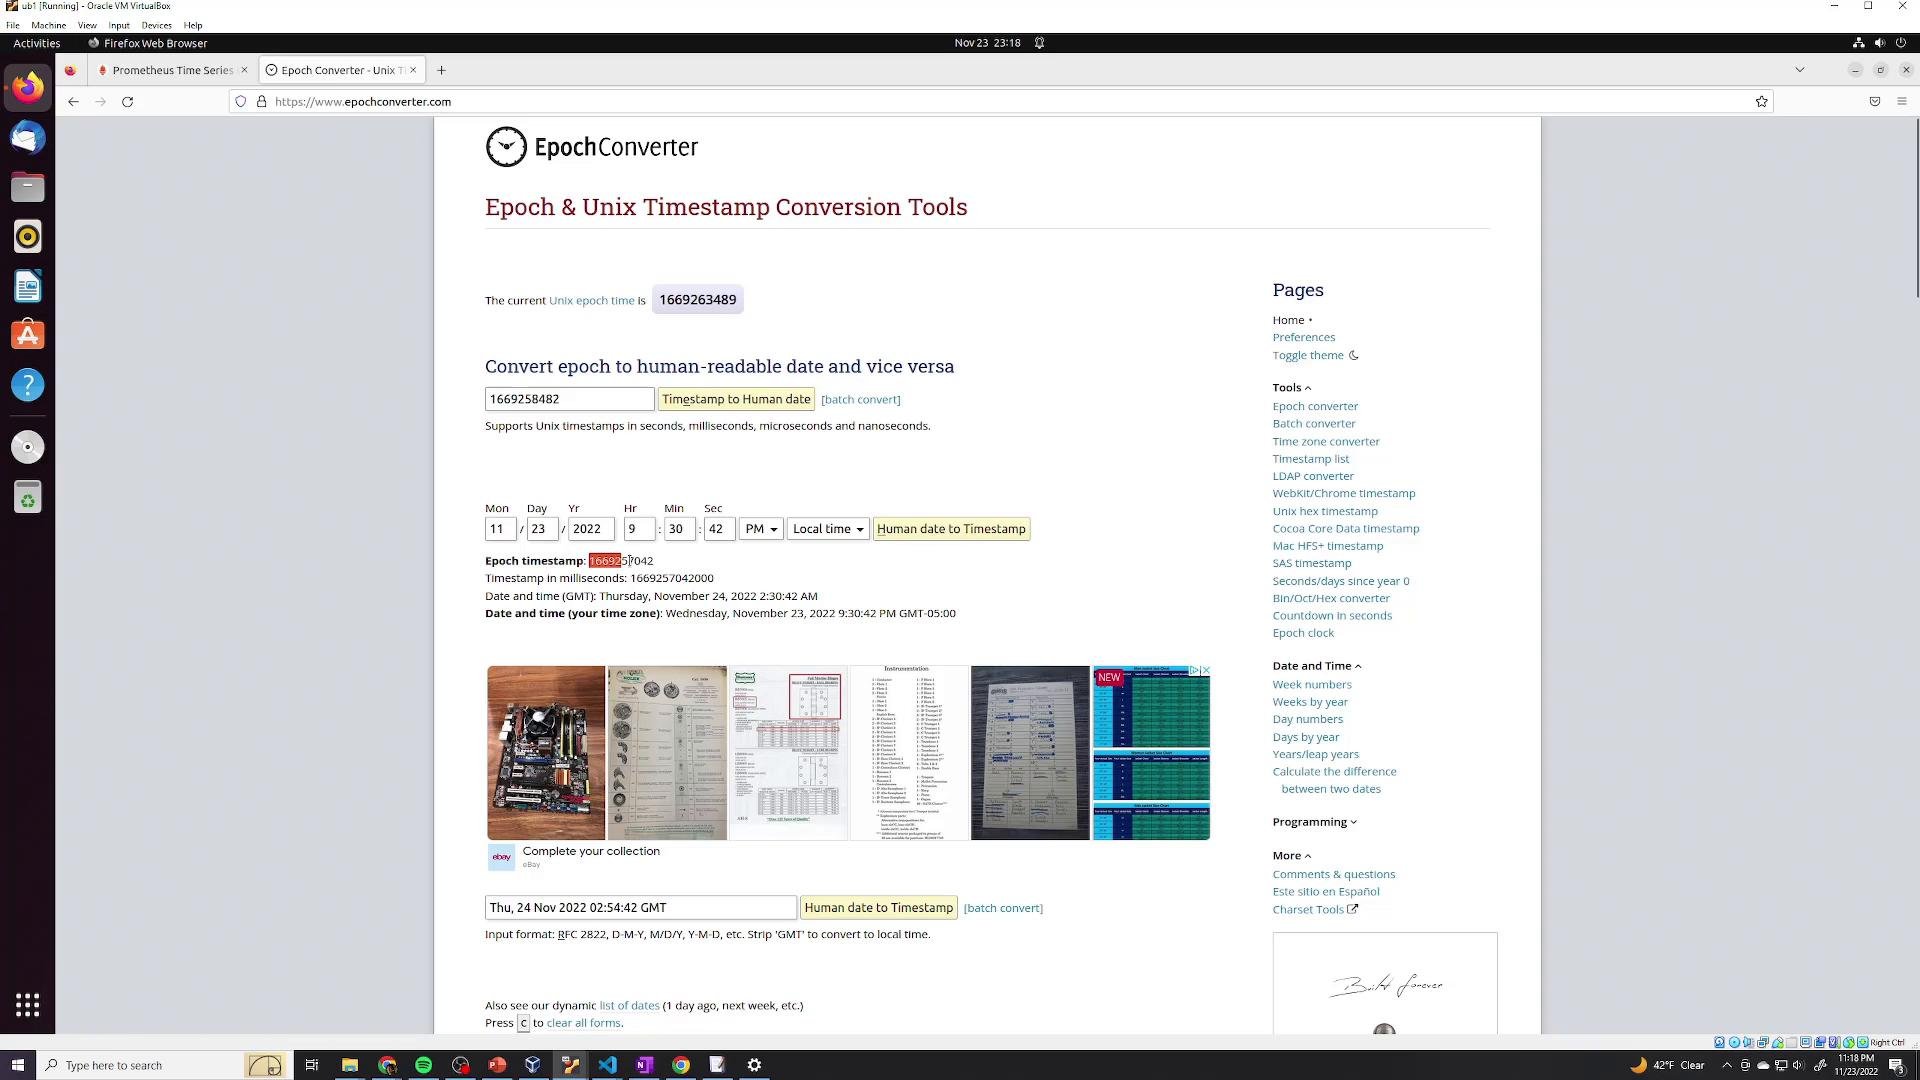
1669257042):
Not all PromQL front-ends expose the
@ modifier in their query builders. When running raw PromQL queries, convert human-readable timestamps to Unix epoch seconds before using @.Quick operator reference
Tips and best practices
- Always quote label values and regexes (for example,
instance="host:9100"ormountpoint=~"/run.*"). - Combine label selectors to narrow results (use commas to add more label filters).
- Use range vectors when you need rate or increase functions (e.g.,
rate(...[5m])). - Use
offsetto compare current data with historical windows (e.g., day-over-day comparisons). - Use
@for reproducible, point-in-time evaluations, especially in automated checks or tests.
offset, and the @ time modifier. Combine these primitives to precisely target metrics and time ranges in PromQL.