


Quick reference
Math functions
Basic math helpers operate on instant vectors and transform each sample value.ceil(v instant-vector)— round up to the nearest integer.floor(v instant-vector)— round down to the nearest integer.abs(v instant-vector)— return the absolute value of each sample.
Date and time functions
Prometheus can return components of the current evaluation time as scalar integers. These are useful for calendar-aware rules or time-based label logic. Example results:Changing types
vector(scalar)— converts a scalar to an instant vector with a single sample and no labels. Useful when a vector input is required by a function.scalar(vector)— converts an instant vector to a scalar. Important: the vector must contain exactly one element; otherwise the result isNaN.
scalar(v) will return NaN if v has zero or multiple elements. Use aggregation (e.g., sum(), avg()) or label filtering to guarantee a single-element vector before calling scalar().Sorting
sort(v instant-vector)— sort samples in ascending order by value.sort_desc(v instant-vector)— sort samples in descending order by value.
Presence and absence functions
Use these functions to detect whether series exist or are missing in a given time window.absent(v instant-vector)/absent_over_time(v range-vector)— indicate absence.absent_over_time(metric[window])returns a sample with value1for the series if there are no samples for the metric in the specifiedwindow. If there is at least one sample in the window, it returns an empty vector.
present_over_time(v range-vector)— returns1for each series that has at least one sample in the specified range.
Other useful functions
Prometheus provides many additional functions. A few highlights and notable behaviors:delta,deriv,changes,expand others exist for time-series analysis.clamp(v instant-vector, min scalar, max scalar)— clamp samples to the givenminandmax.- Returns an empty vector if
min > max. - Samples become
NaNifminormaxisNaN. - Histogram samples are ignored.
- Returns an empty vector if
changes(v range-vector)— returns how many times a series’ value changed within the range.
ceil:
ceil(+Inf) = +Infceil(±0) = ±0ceil(1.49) = 2.0ceil(1.78) = 2.0
delta:
Histogram helpers (common patterns)
- Compute a quantile from histogram buckets:
- Per-second request rate from the histogram
_countseries:
- Total increase in requests over a window:
Rate and irate for counters
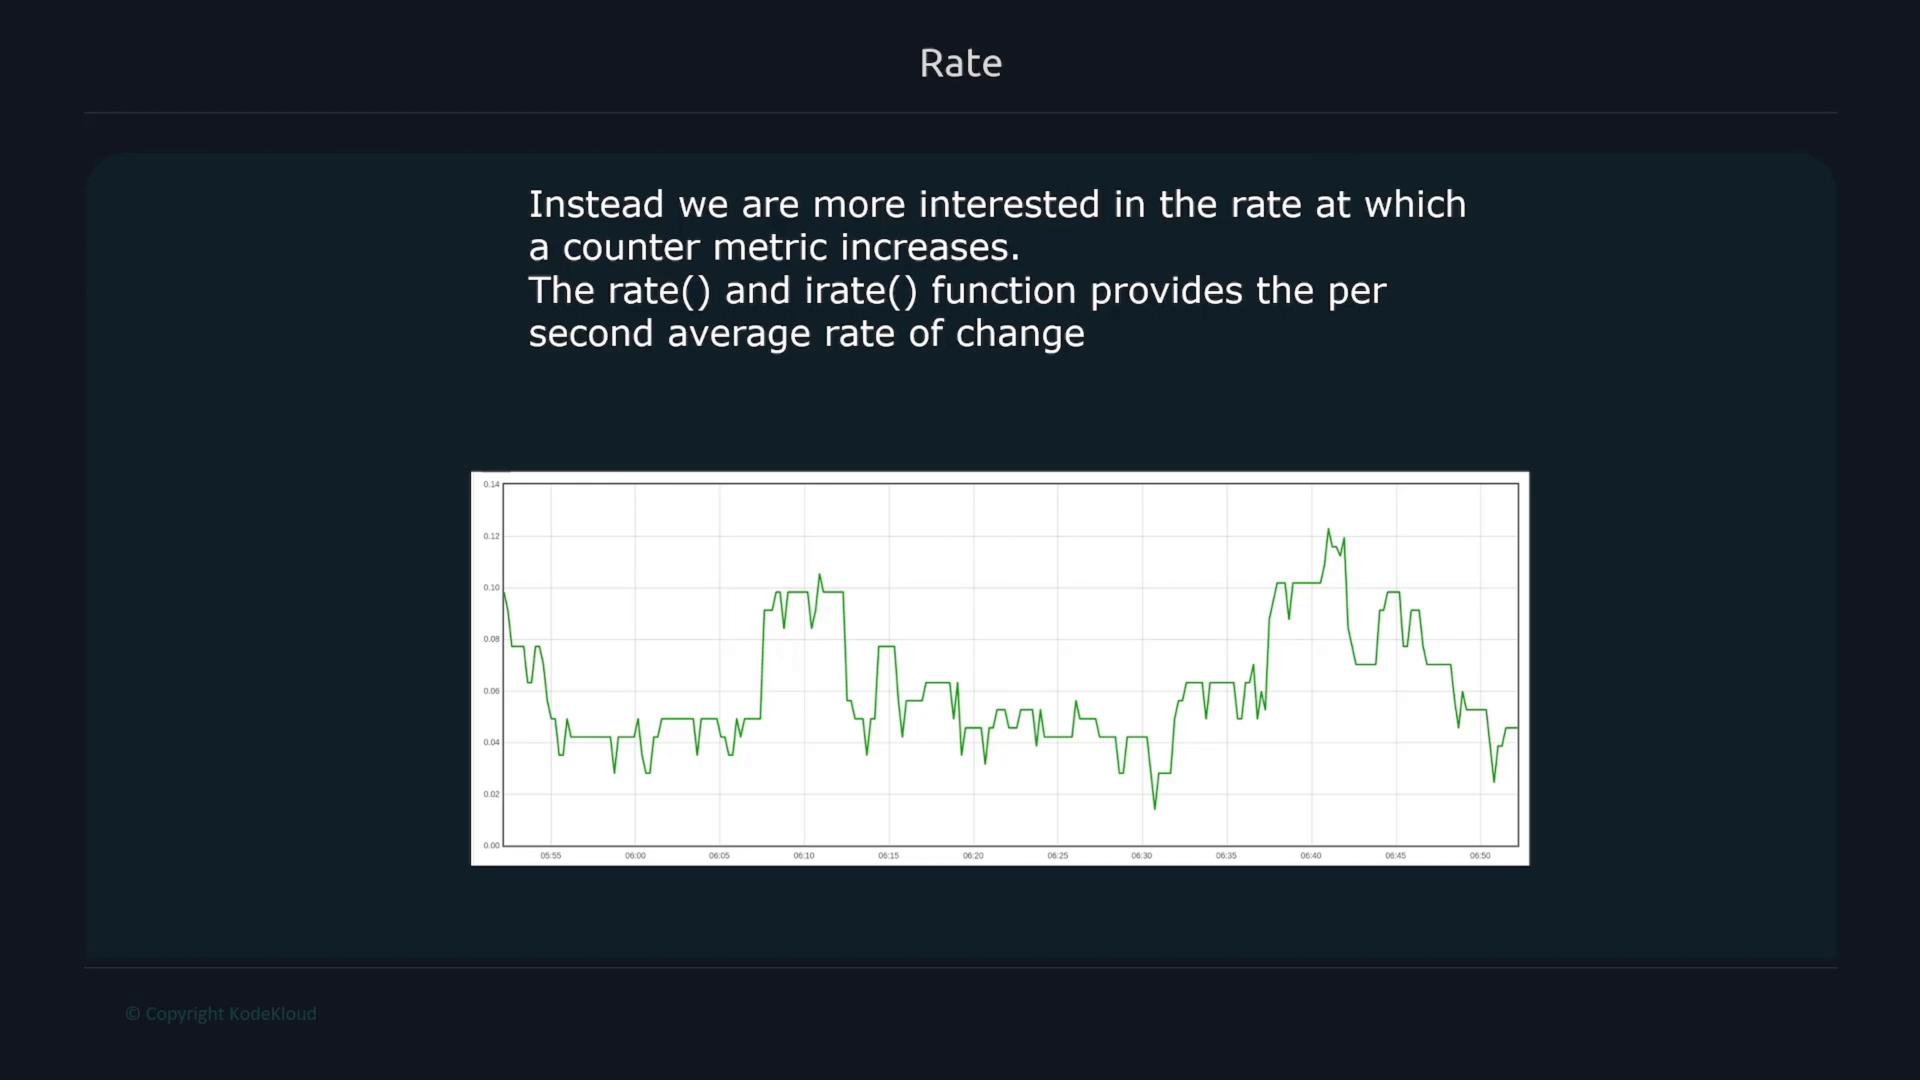
Raw counters typically always increase; to visualize or alert on throughput we convert them to per-second rates withrate() or irate().
rate() works (conceptually)
- Expression:
rate(metric[window]) - Prometheus collects all samples in the specified
window(e.g.,1m). With a 15s scrape interval, a 1m window usually contains ~4 samples. rate()computes an average per-second rate over the window. For counters it accounts for resets and extrapolates at the window edges when necessary. Conceptually it uses the difference between the extrapolated earliest and latest sample values divided by the time span.
- Samples in a 1m window: 1.2, 2.3, 3.1, 3.3
- First = 1.2, Last = 3.3 → delta = 2.1
- Time window = 60s → rate = 2.1 / 60 ≈ 0.035
irate() differs
- Expression:
irate(metric[window]) irate()uses only the last two samples in the window to compute an instantaneous rate: (last - second_last) / (time difference between those two samples). With a 15s scrape interval, that difference is typically 15s.
- Last two samples: 8.9, 10.3 → delta = 1.4
- Time difference = 15s → irate = 1.4 / 15 ≈ 0.0933
rate()— use for stable, averaged rates and alerting rules (recommended for robustness).irate()— use for instantaneous or highly volatile rate visualizations.
Best practices:
- Ensure the window contains enough samples (e.g., with 15s scrapes use at least
1mor larger windows). - Apply
rate()/irate()before aggregation (e.g.,sum()oravg()), so Prometheus can correctly handle counter resets. Example:sum without(code, handler) (rate(http_requests_total[24h]))
Network example
A counter likenode_network_transmit_bytes_total is monotonically increasing. To get per-second throughput, use rate().
Raw instant vector over the last 5 minutes:
Summary and further reading
Prometheus ships many functions for numerical manipulation, time extraction, type conversion, presence detection, histogram analysis, and counter rates. The functions shown here cover most practical scenarios; consult the official Prometheus documentation for the complete list and edge-case behavior:- Prometheus docs — Querying → Functions: https://prometheus.io/docs/prometheus/latest/querying/functions/