

- Name — a descriptive identifier for the metric.
- Labels — zero or more key/value pairs that add dimensions to the metric.
- Value — the metric’s numeric value for a particular timestamp (collected when Prometheus scrapes the target).
node_cpu_seconds_total metric (exported by node_exporter). It represents the cumulative number of seconds the CPU has spent in a specific mode. Labels tell us which CPU (cpu="0") and which mode (mode="idle") this sample refers to. If the machine has multiple CPUs, Prometheus will store one sample per CPU (each with a different cpu label).
A set of example mode metrics for CPU 0:
Prometheus stores a sequence of timestamped samples for each unique metric + label set — this sequence is called a time series. A time series is uniquely identified by the metric name together with its labels.
Metric types
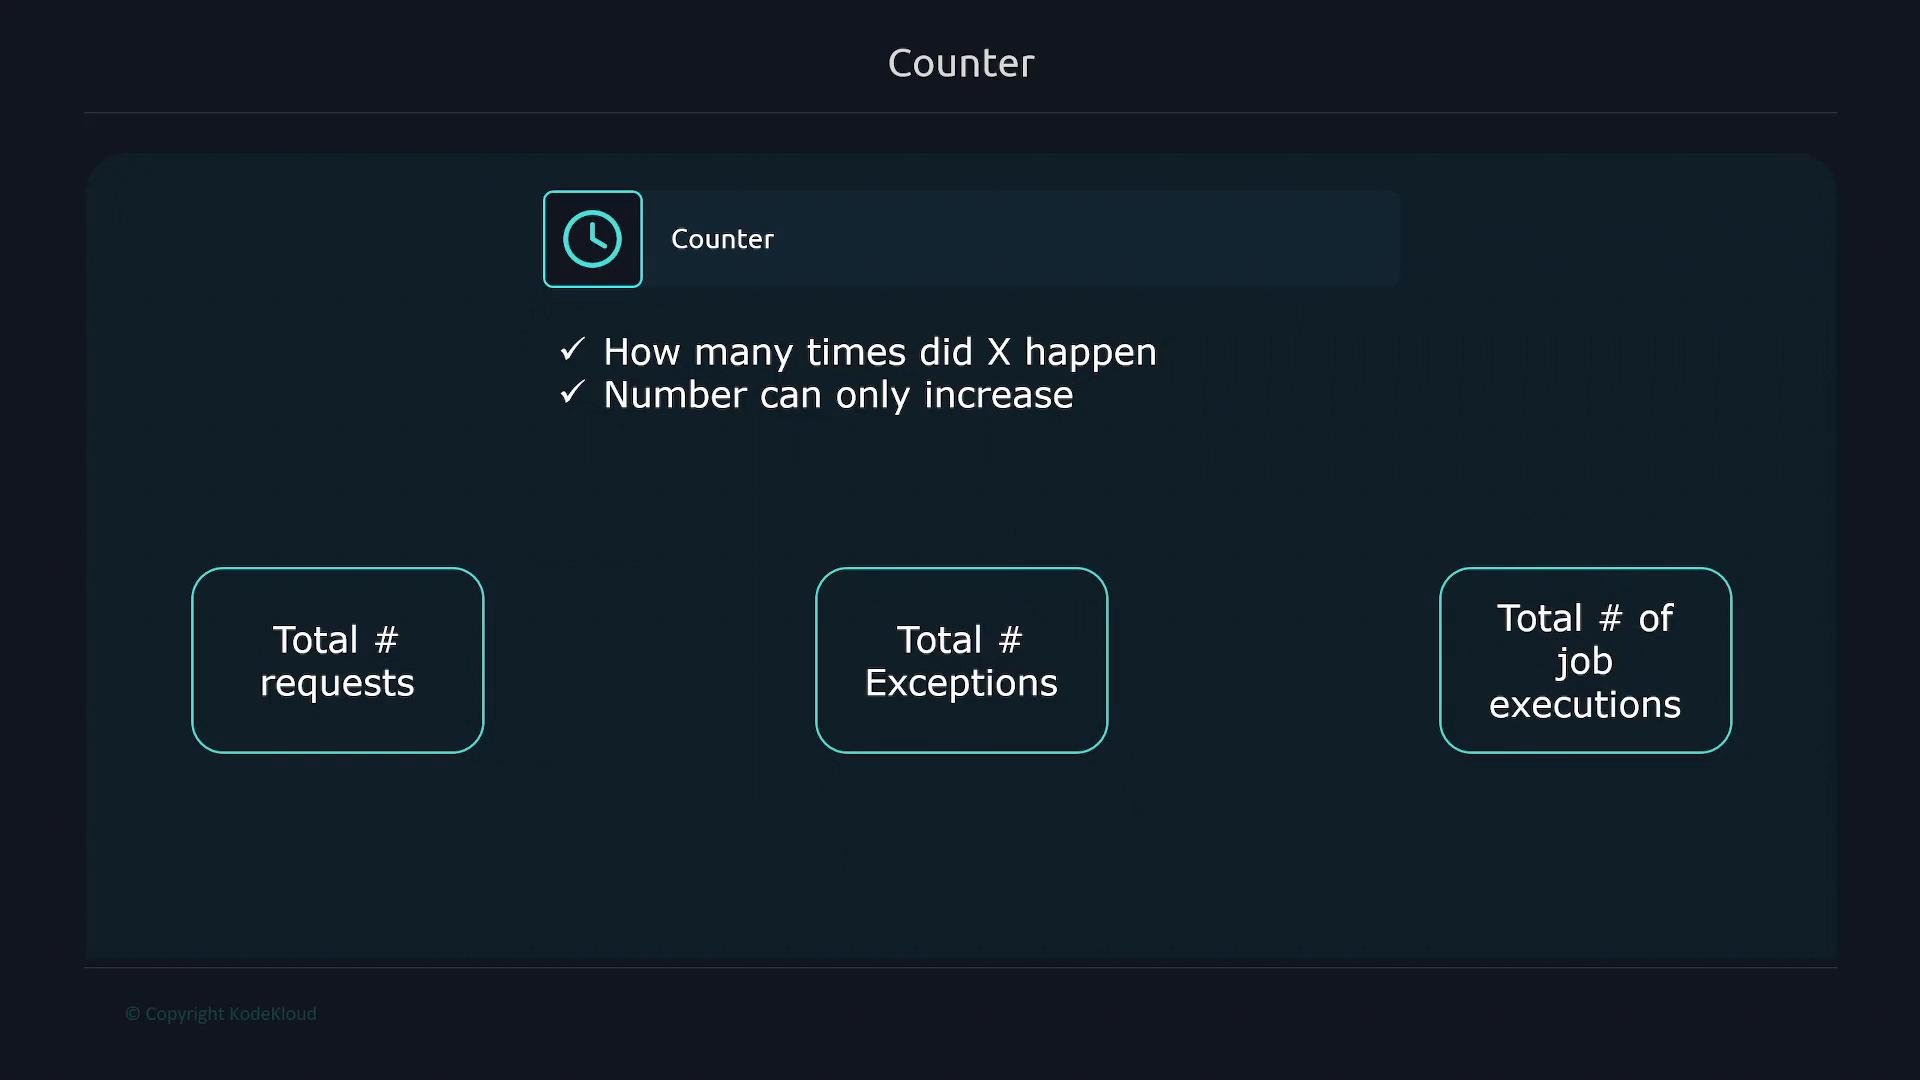
Prometheus exposes four primary metric types. Use the type that best matches what you are measuring.- Counter — a monotonically increasing value. Useful for cumulative totals.
- Gauge — represents a value that can both increase and decrease. Use it for instantaneous measurements (CPU usage, number of active connections, queue lengths).
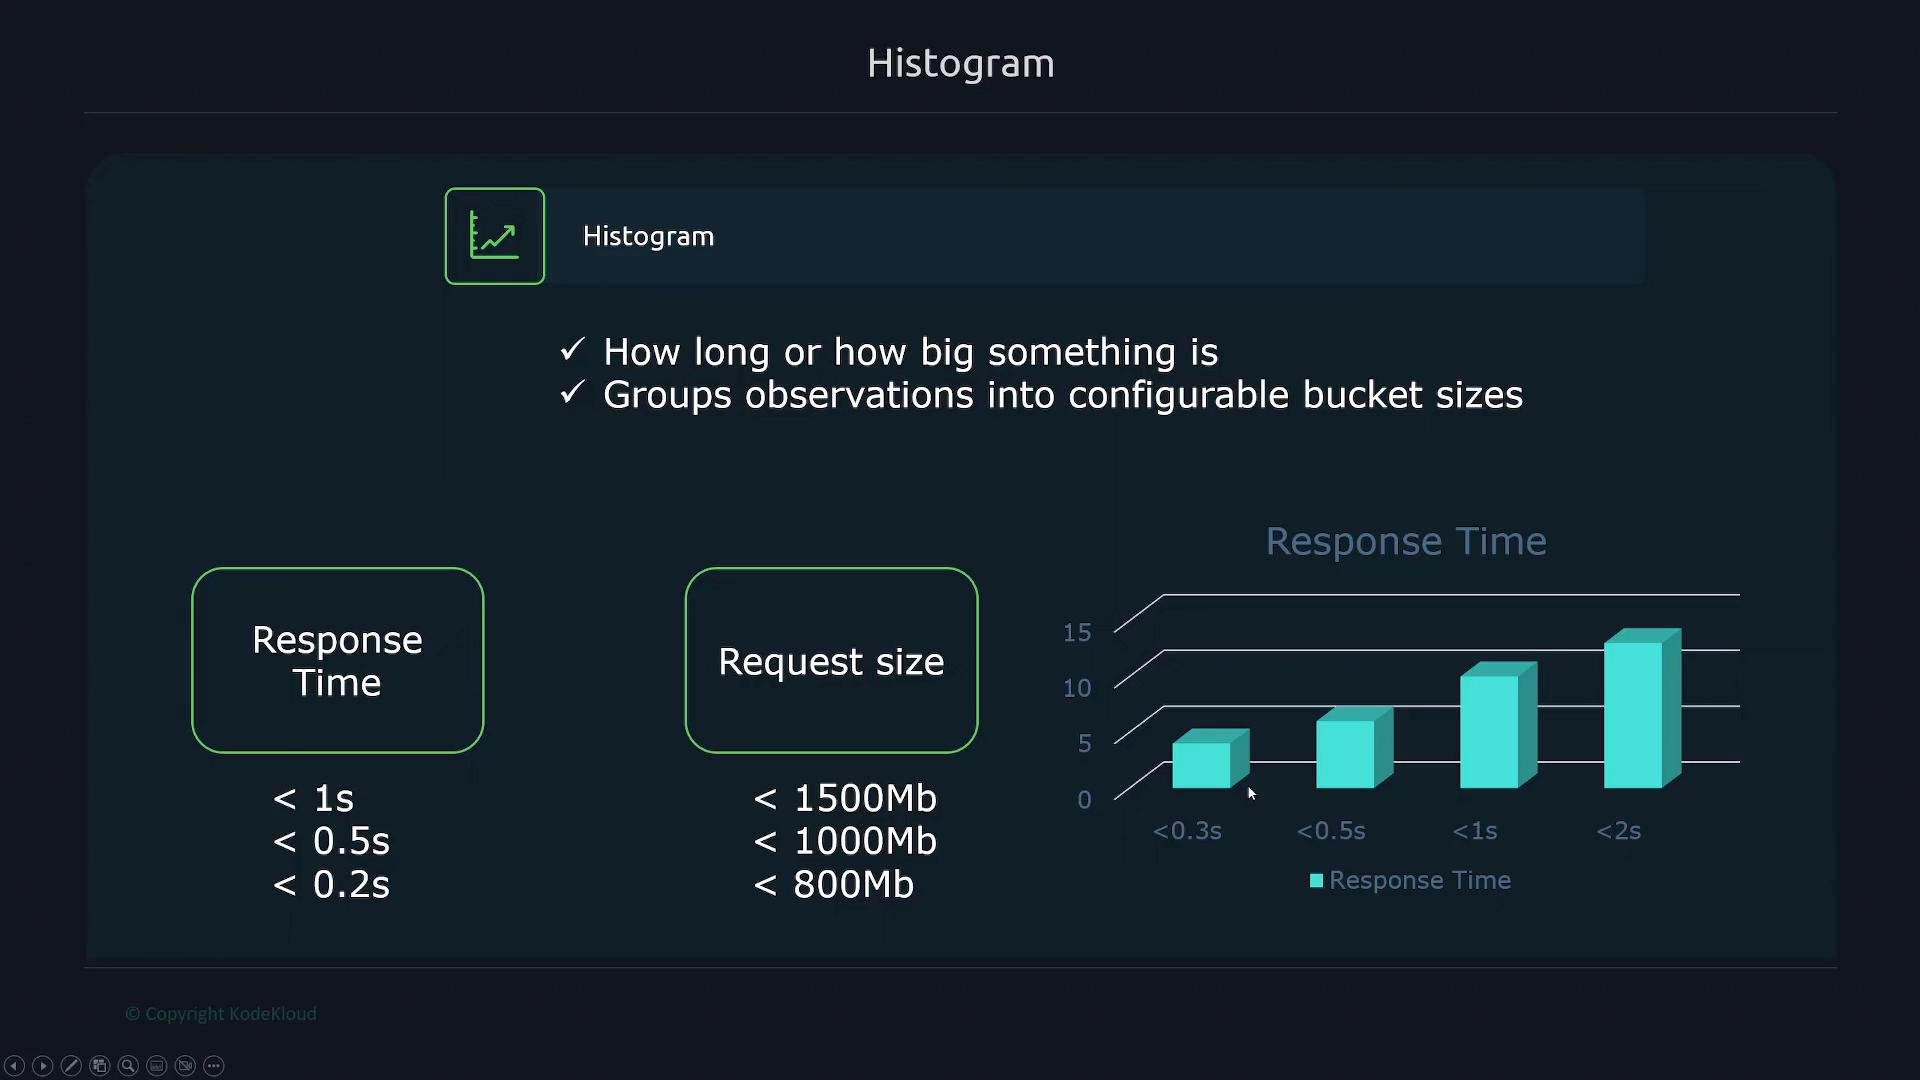
- Histogram — groups observations into configurable buckets and reports cumulative counts for each bucket. For example, with response-time buckets at 0.2s, 0.5s, and 1s, a histogram can tell you how many requests finished in <0.2s, <0.5s, and <1s. Bucket counts are cumulative, so the count for the 0.5s bucket includes the 0.2s bucket.
- Summary — provides client-side computed quantiles (percentiles) and a count/sum of observations. Summaries produce per-instance quantiles and therefore cannot be aggregated across instances as easily as histograms.
When to choose histogram vs. summary
- Use histograms when you need to aggregate latency distributions across multiple instances (e.g., cluster-wide 95th percentile).
- Use summaries when you need accurate, per-instance percentiles and do not require cross-instance aggregation.
Metric and label naming rules
Metric names may contain ASCII letters, digits, underscores, and colons. They must match:path label:
method="GET" or method="POST" to split by HTTP method while keeping a single metric name:
__name__. Example:
__name__) are considered internal to Prometheus.
Prometheus automatically adds at least two labels to scraped metrics: instance (the scraped target) and job (the scrape job name). Example metric with those automatic labels:
prometheus.yml job configuration that produces those labels:
Beware of high-cardinality labels (e.g., including user IDs, session IDs, or GUIDs). Each distinct label value creates a separate time series — too many series can severely impact Prometheus performance and storage.
Best practices (summary)
- Choose stable, descriptive metric names.
- Use labels for dimensions you will filter or aggregate by.
- Avoid labels with unbounded cardinality (user IDs, request IDs).
- Prefer histograms for cross-instance aggregation of distributions; use summaries when you need per-instance quantiles.
- Use the
# HELPand# TYPEcomments to document metrics for humans and tools.
Links and references
- Prometheus official docs: https://prometheus.io/docs/
- Prometheus metrics and instrumenting applications: https://prometheus.io/docs/practices/instrumentation/