

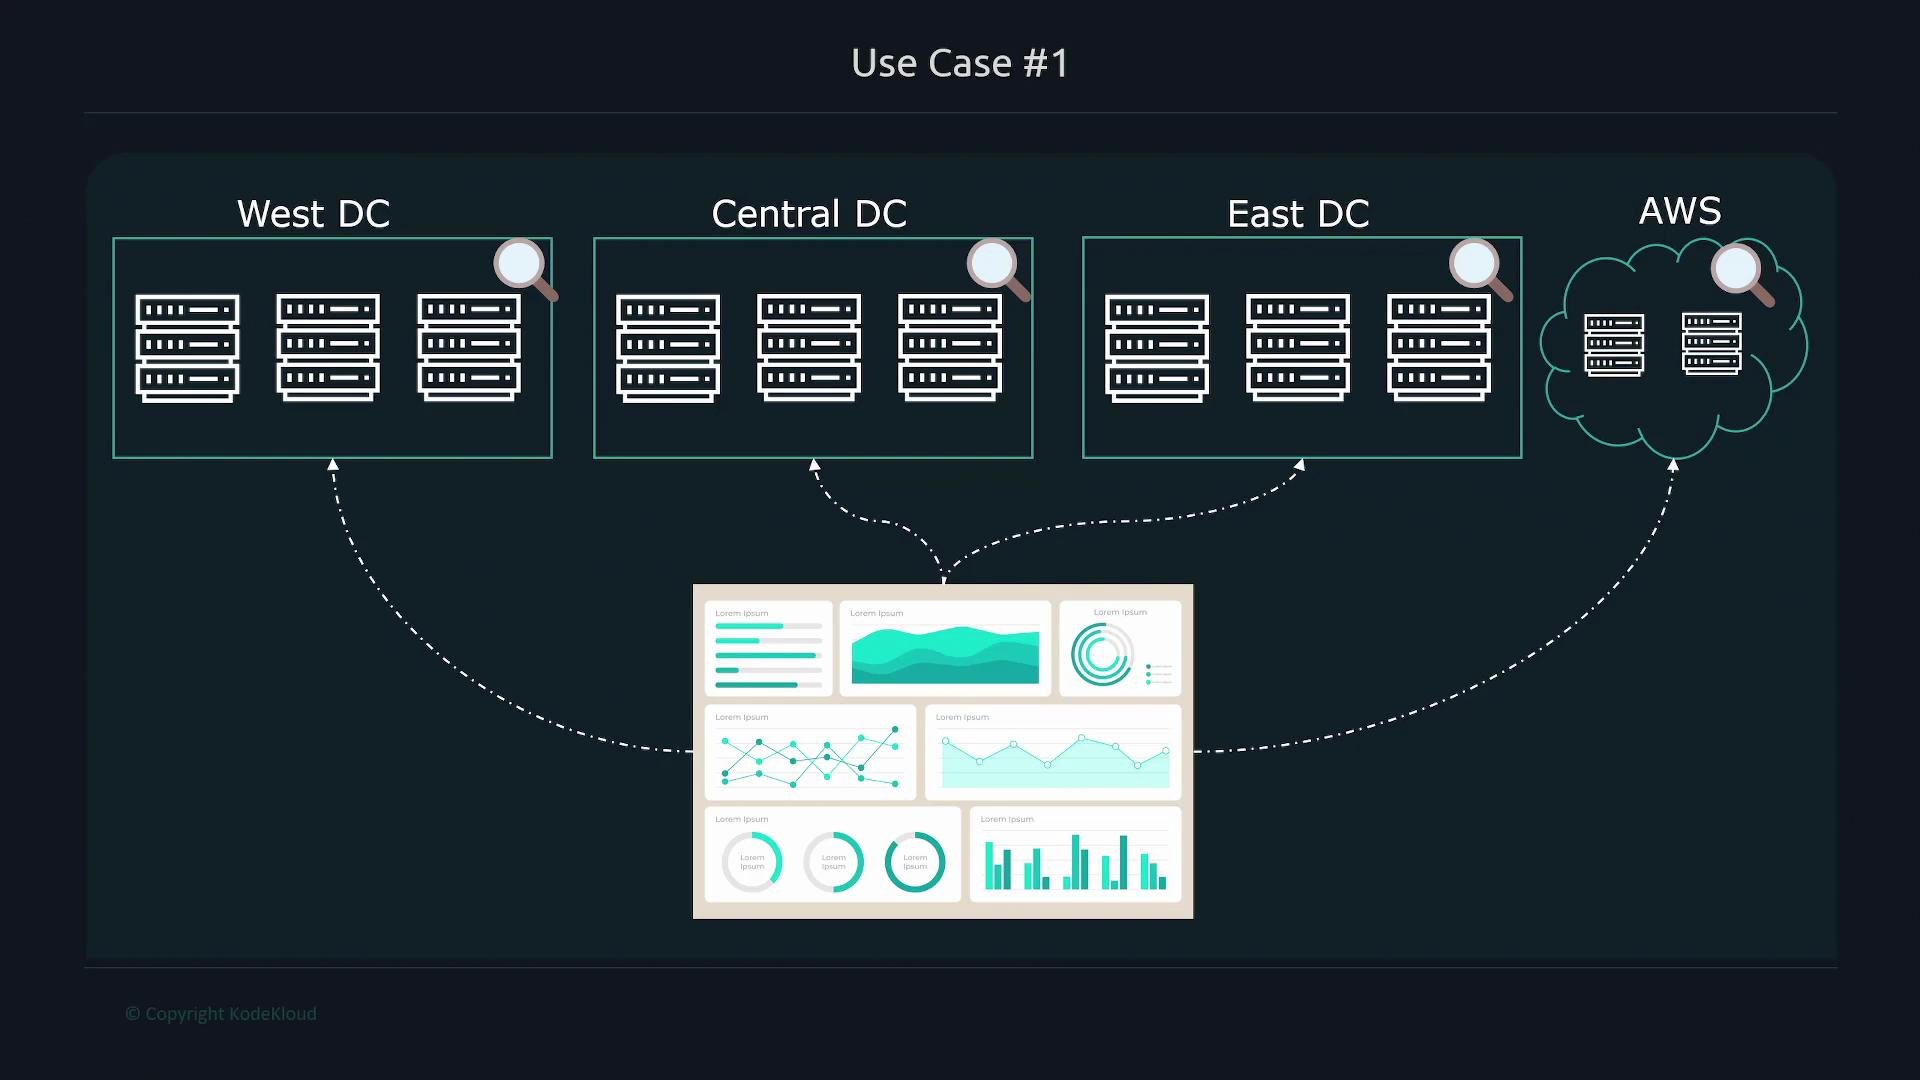
remote_write to a long-term store. Prometheus also includes a built-in expression browser and graphing UI for quick exploration. For richer dashboards, teams commonly pair Prometheus with Grafana.
Use case 2: Alerting on memory saturation
Imagine repeated outages caused by high memory usage on the MySQL host. The operations team wants alerts (email, Slack, PagerDuty) when memory usage hits 80% so they can intervene before users are affected. Prometheus evaluates alerting rules (PromQL) and emits alerts when conditions are true. Alertmanager receives those alerts and handles deduplication, grouping, inhibition, and delivery to receivers such as email, Slack, or PagerDuty.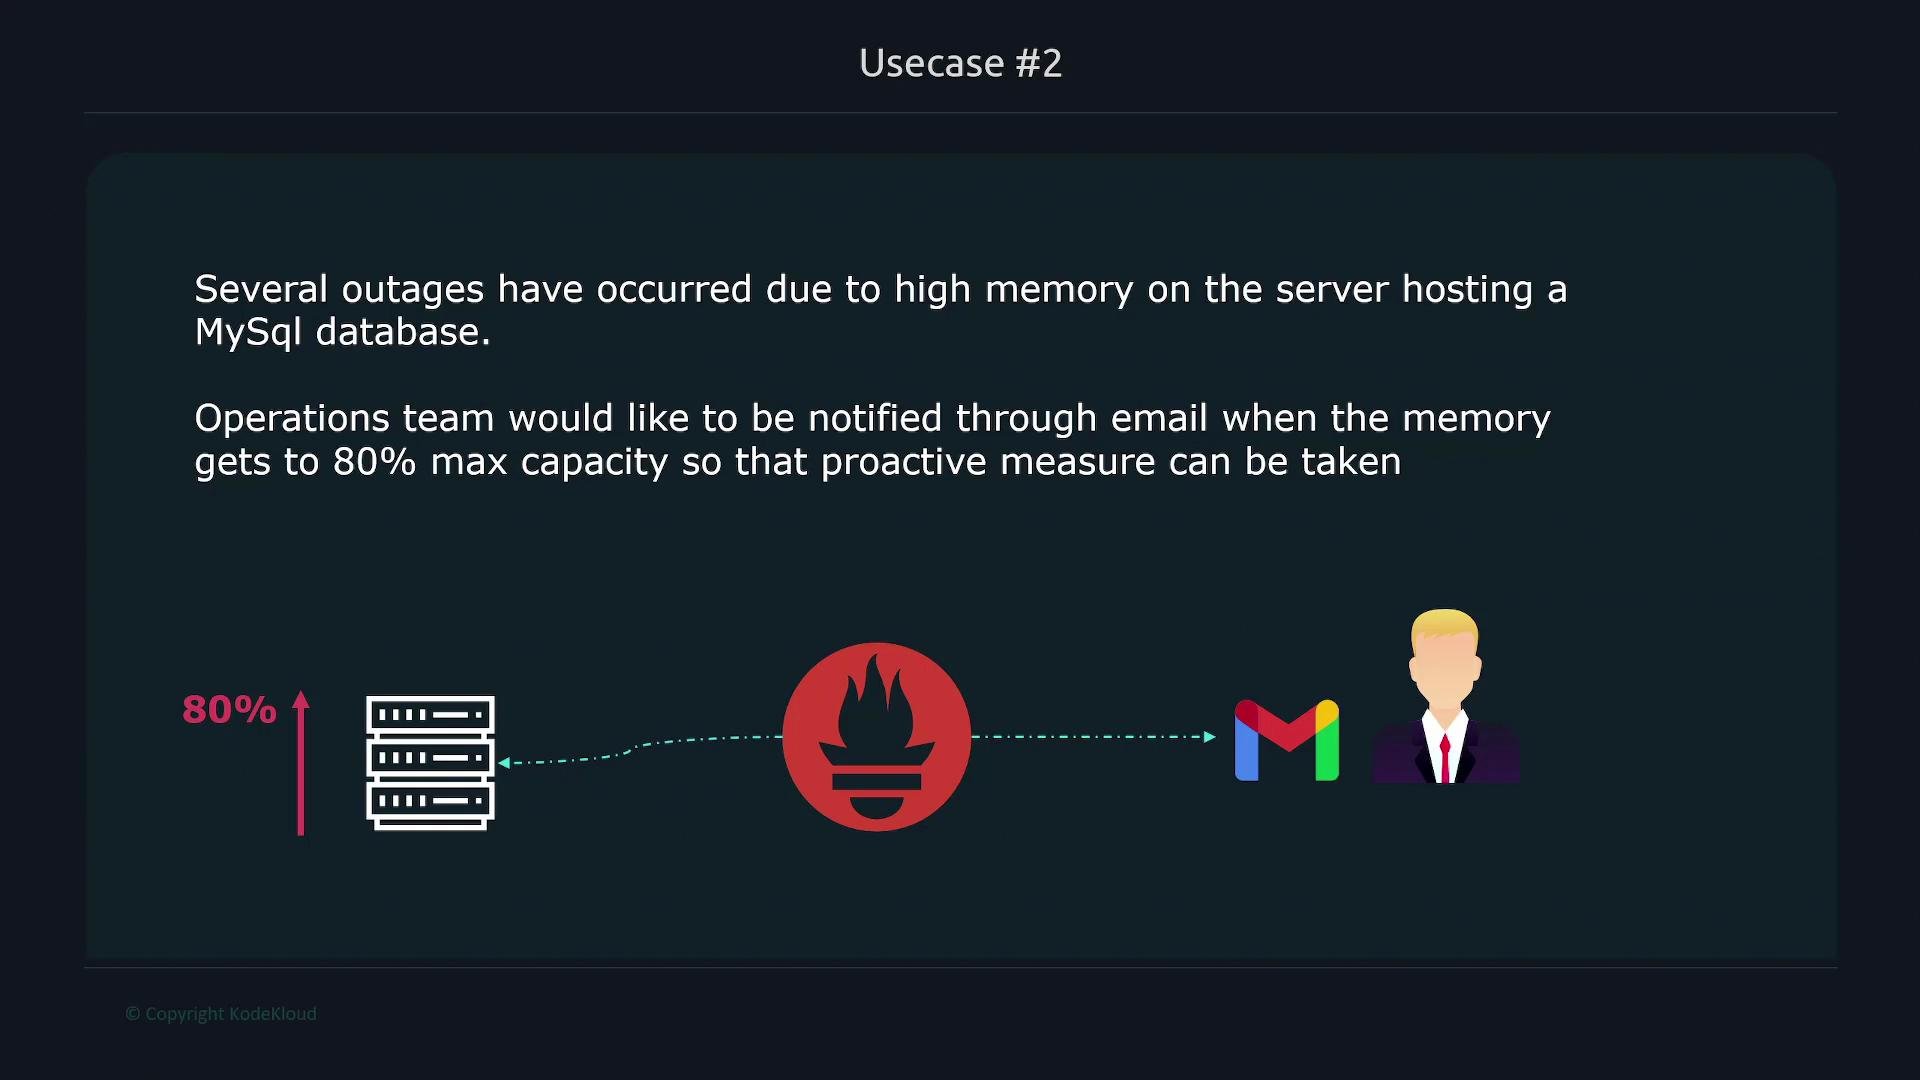
Prometheus evaluates alerting rules; Alertmanager is responsible for routing and delivering alerts to channels (email, Slack, PagerDuty, SMS). Configure Alertmanager receivers and routing rules to control notification behavior and silence management.
Use case 3: Finding the upload size where latency degrades
You’ve shipped a video upload feature and need to know the file size at which request latency begins to increase noticeably. The recommended approach:- Instrument the application to expose upload metrics:
- Use a histogram for request durations, e.g.
upload_request_duration_seconds_bucket. - Record upload sizes as a gauge or histogram (e.g.,
upload_size_bytes). - Attach meaningful labels (endpoint, status_code, instance) when appropriate.
- Use a histogram for request durations, e.g.
- Scrape these metrics with Prometheus and visualize them in Grafana or the Prometheus expression browser.
- Use PromQL to correlate average upload size and latency over time.
- Average upload size over the last 5 minutes (if each upload reports
upload_size_bytesas a per-request gauge):
- 95th percentile request duration over the last 5 minutes (based on a histogram named
upload_request_duration_seconds_bucket):
When combining vector results with logical operators (for example
and), ensure the vectors have compatible label sets. Use aggregation or vector matching (for example, on(instance)) to align labels so the compound expression behaves as intended.Putting it all together
Prometheus supports the full workflow for these use cases:- Distributed collection and aggregation: run per-site Prometheus instances and consolidate with federation or
remote_write. - Alerting: express rules in PromQL, evaluate them in Prometheus, and manage delivery through Alertmanager.
- Instrumentation-driven observability: use histograms for latency and size, counters for counts, and gauges for instantaneous values to correlate metrics and drive data-informed decisions.
- Instrument services with appropriate metric types (histogram for latency, gauge for sizes, counters for totals).
- Scrape application endpoints and exporters reliably (configure scrape intervals and relabeling).
- Define and test PromQL queries in the expression browser and dashboards.
- Create alerting rules with appropriate
fordurations to avoid flapping. - Configure Alertmanager routes and receivers for on-call workflows.
- Choose aggregation/retention strategy (federation vs
remote_write) based on query needs and retention requirements.