

Prerequisites
- A Linux host (or another OS) with network access from your Prometheus server.
- wget or curl for downloading the release.
- systemd (recommended) if you want Pushgateway to run as a managed service.
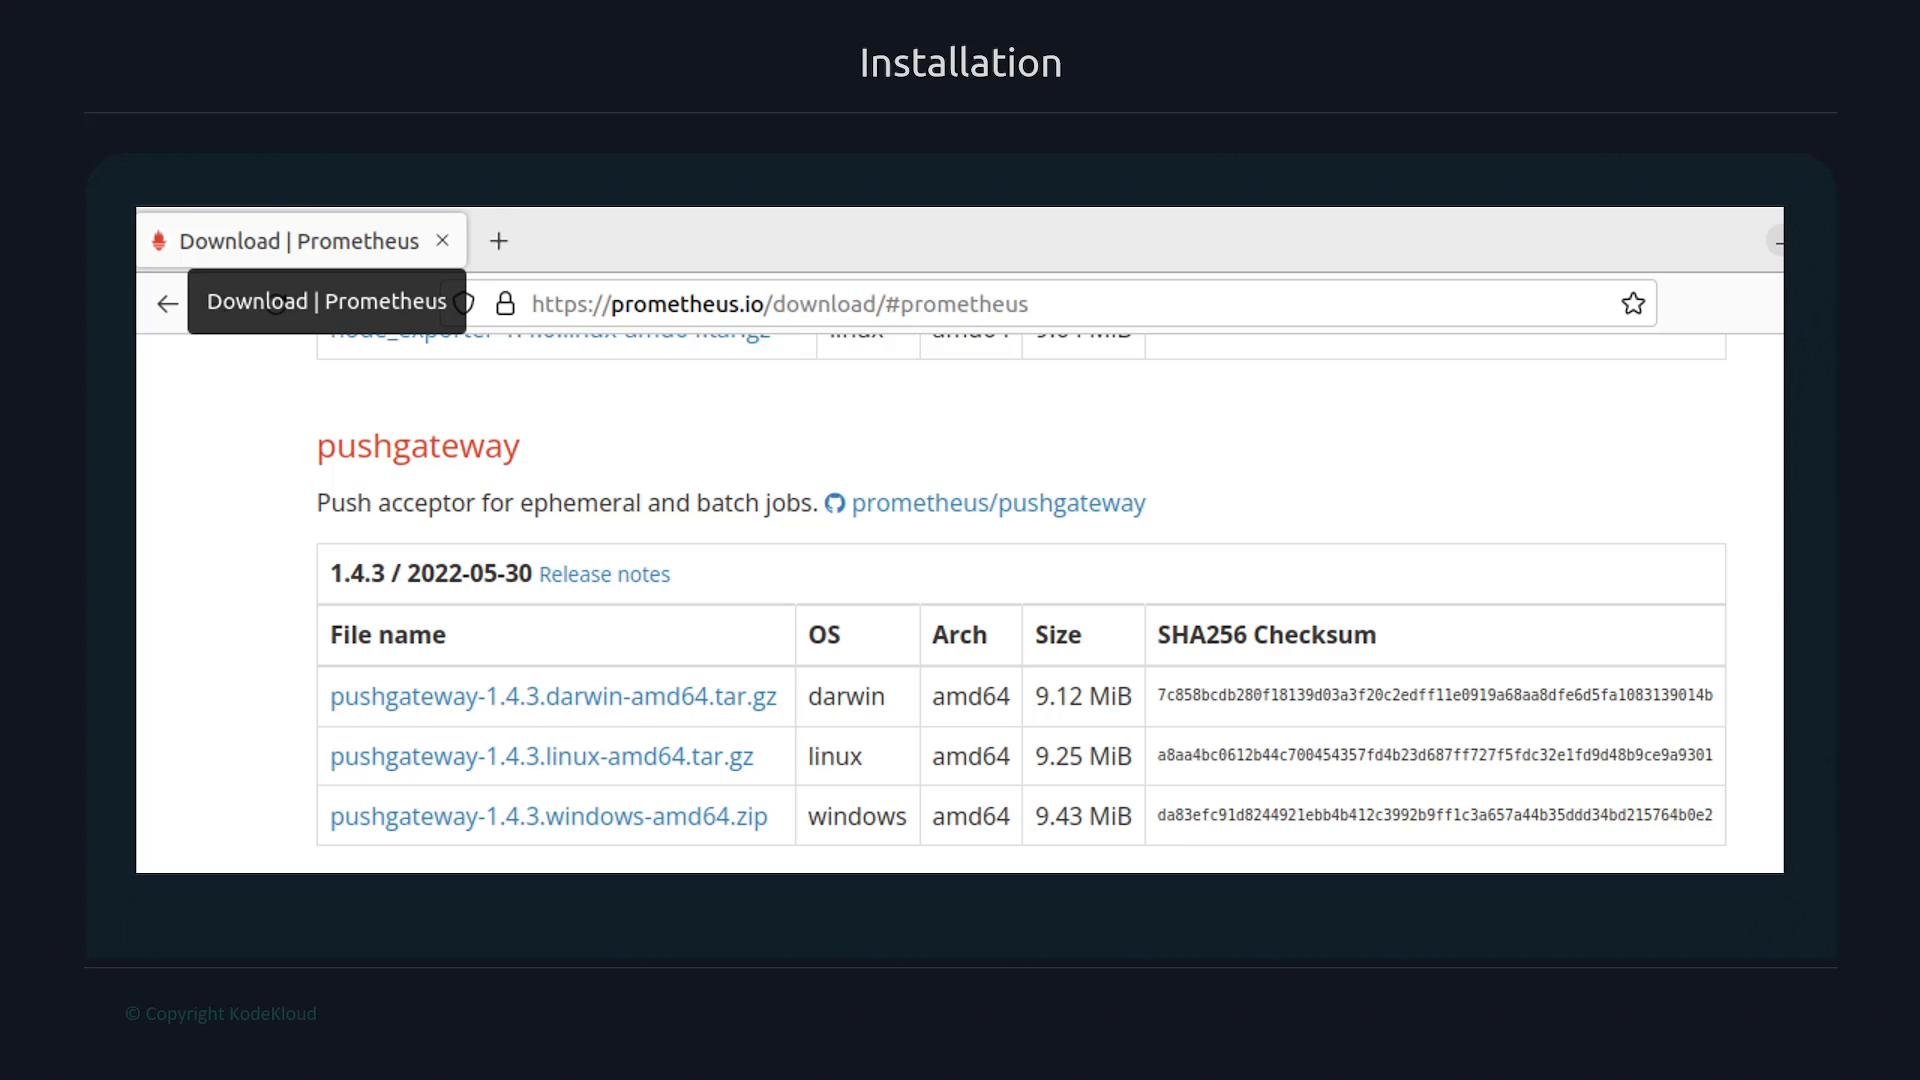
Quick install and test (Linux example)
- Download and extract the release (example: v1.4.3, Linux amd64):
- Start Pushgateway directly for a quick smoke test (listens on port 9091 by default):
- Verify the metrics endpoint that Prometheus will scrape:
Install Pushgateway as a systemd service (recommended for production)
Running Pushgateway under systemd makes it easier to manage, restart on failure, and control permissions.- Create a dedicated system user and copy the binary:
- Create the systemd unit file
/etc/systemd/system/pushgateway.servicewith the following content:
- Reload systemd, start, enable, and check status:
When exposing Pushgateway, ensure only trusted processes can push metrics. The Pushgateway accepts pushed metrics and preserves labels; untrusted pushers may inject or overwrite labels. Use network controls and authentication where necessary.
Common commands reference
Configure Prometheus to scrape Pushgateway
Add a scrape job to yourprometheus.yml. The key setting is honor_labels: true. Many jobs that push metrics to Pushgateway include their own job and instance labels; by default Prometheus would overwrite those labels with the scrape job’s labels. honor_labels: true preserves the labels provided by pushers.
Example prometheus.yml snippet:
Setting
honor_labels: true ensures metrics pushed to the Pushgateway retain the original labels (for example job and instance) provided by the pushing jobs rather than being overwritten by the scrape job’s labels.- Multiple jobs can push metrics to the Pushgateway and set identifying labels.
- Prometheus will scrape the Pushgateway and preserve those label values, allowing metrics to reflect their true source.
Troubleshooting & tips
- If metrics appear missing or labels are different than expected, check that the clients pushing metrics set the labels as intended and that
honor_labelsis enabled. - If Pushgateway fails to start under systemd, inspect
journalctl -u pushgatewayfor logs. - For secure or multi-tenant setups, consider using network-level controls, authentication proxies, or restricting who can push metrics.
Links and references
- Prometheus Pushgateway releases: https://github.com/prometheus/pushgateway/releases
- Prometheus documentation: https://prometheus.io/docs/