

Accessing the expression browser
Open your web browser and navigate to your Prometheus server. For a local instance the default is:http://localhost:9090
The expression browser UI includes:
- An “Expression” input for PromQL queries.
- Options to view raw query results or switch to the Graph tab for time-series visualization.
- An “Evaluation time” field to evaluate queries at specific timestamps.
Quick example: the up metric
The up metric is the simplest diagnostic query — 1 indicates a reachable target, 0 indicates unreachable.
- Type
upinto the Expression field. - Click Execute.
Inspecting multi-label metrics
Many metrics include multiple labels. For example,node_cpu_seconds_total returns per-CPU and per-mode counters:
node_cpu_seconds_total is a cumulative (monotonic) counter. Plotting it directly shows total accumulated CPU-seconds. To visualize CPU usage rate over time, use rate(node_cpu_seconds_total[5m]), irate(...), or another rate function appropriate to your resolution.Evaluating queries at a specific time
Use the “Evaluation time” field to run a query as of a historical timestamp. This returns the values that were valid at that time — helpful for debugging incidents or validating historical alert firings.Graphing queries
Switch to the Graph tab to visualize query results: Example query to graph a particular series:- Click Execute (or the graph button) to render a time-series chart.
- Adjust the time range (e.g., last 1 hour, last 30 minutes), change chart type, or zoom into a sub-interval.
- If you omit label filters, one series is drawn for each matching time series; this can make the chart crowded when many series exist.
Editor features and ergonomics
The expression input supports:- Auto-completion for metric names and label keys.
- Syntax highlighting.
- Basic inline help.
Useful server pages
The expression browser exposes several server pages that are useful when troubleshooting or inspecting Prometheus state. Use the menu at the top of the UI to navigate.
Example (truncated) running configuration:
Targets page (example)
The Targets page is especially useful for tracking down unreachable endpoints: it shows each configured scrape target, discovered labels, the last scrape result, and the scrape health. When a target is DOWN, the page provides an error message (for example, “context deadline exceeded”) that helps diagnose network or service-side issues.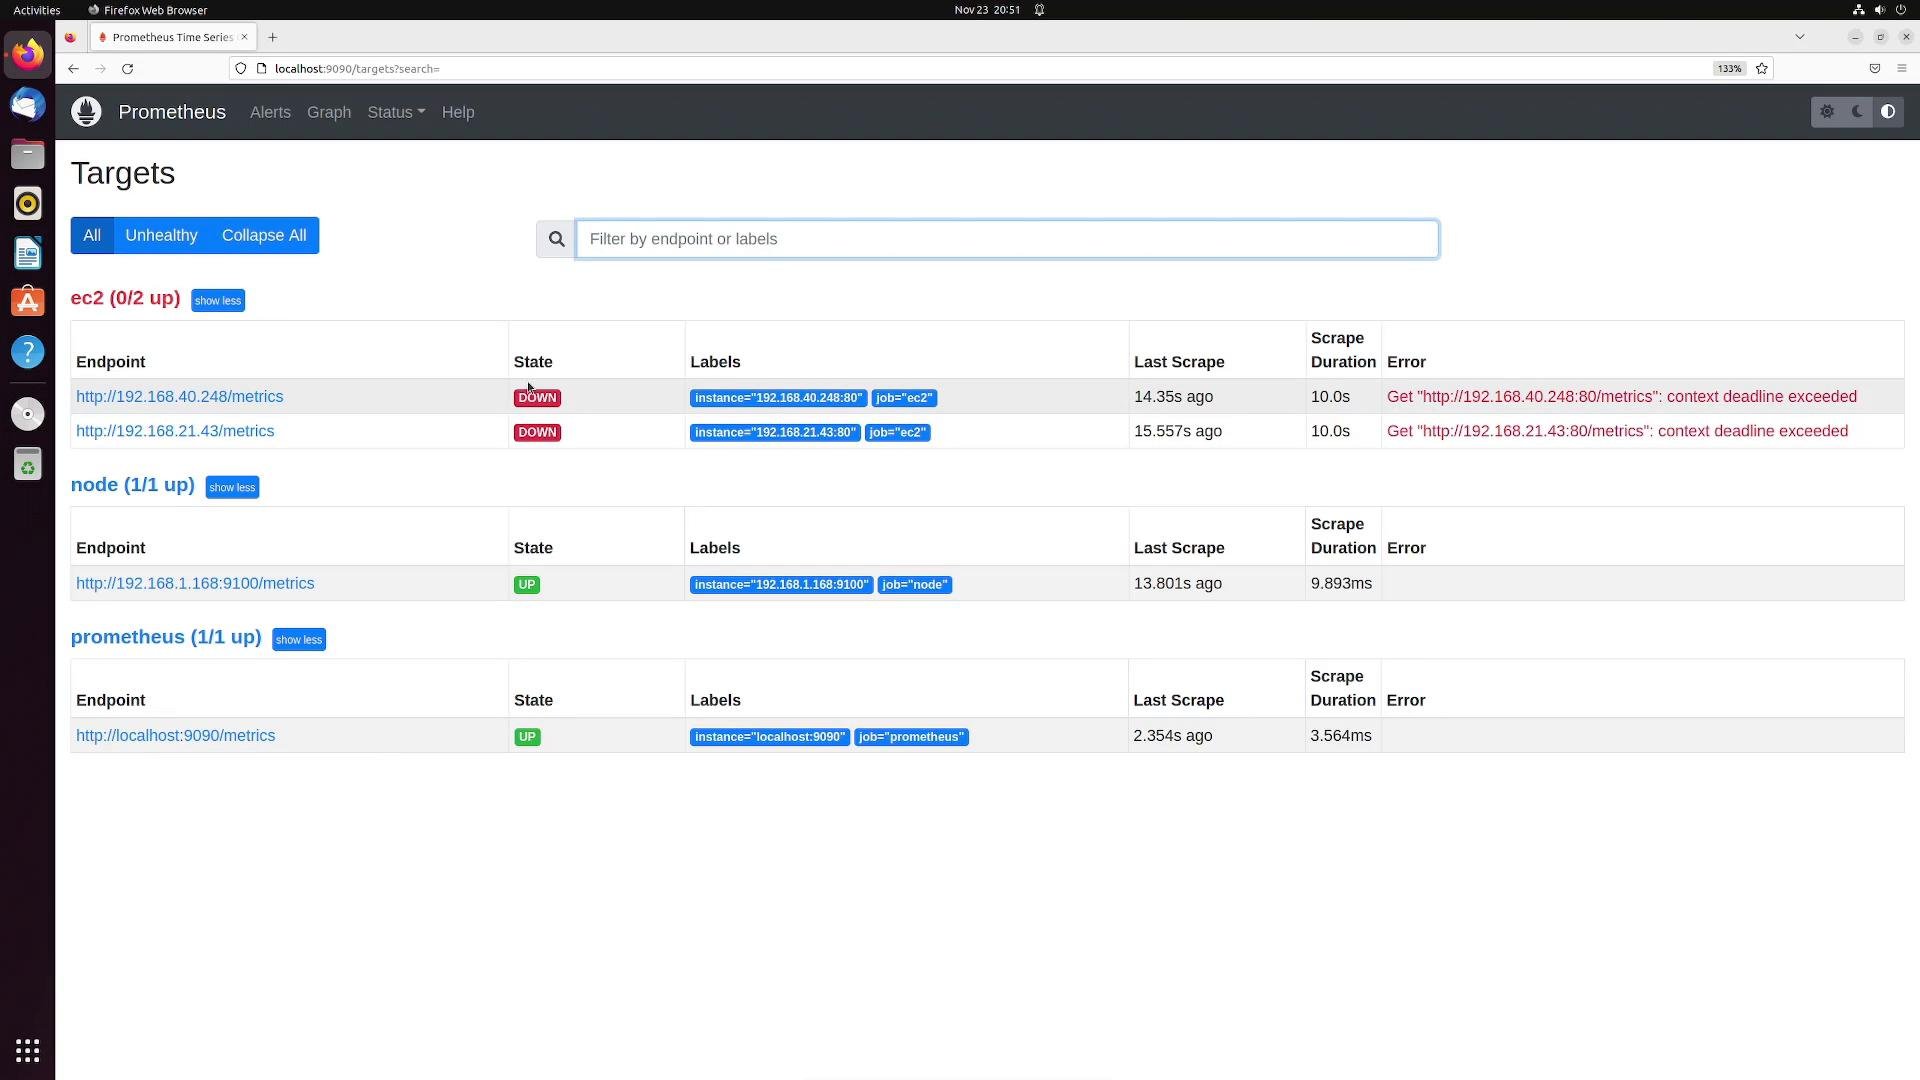
Rules and Alerts
- Rules: recording rules create new time series to simplify repeated PromQL expressions; alerting rules generate alerts when their conditions are met.
- Alerts: lists currently active alerts, their labels, state (firing/pending), and links to alert history/details.
Quick reference — common PromQL patterns
Conclusion
The Prometheus expression browser is a lightweight, built-in tool for interactive querying, debugging, and quick visualizations. For production dashboards, team-facing views, and richer visualizations, integrate Prometheus with a dedicated dashboarding tool such as Grafana.The expression browser is perfect for quick exploration and troubleshooting. For long-term dashboards and collaborative views, connect Prometheus to Grafana or another visualization tool.