

- Monitor application-level metrics from services and web servers running in pods.
- Monitor cluster-level metrics for control plane components, nodes, and Kubernetes object state.
- Places Prometheus close to scrape targets (lower latency, fewer network hurdles).
- Reuses existing Kubernetes infrastructure (no separate VM required).
- Lets you use Kubernetes-native deployment patterns (Helm charts, Operators, ServiceDiscovery).
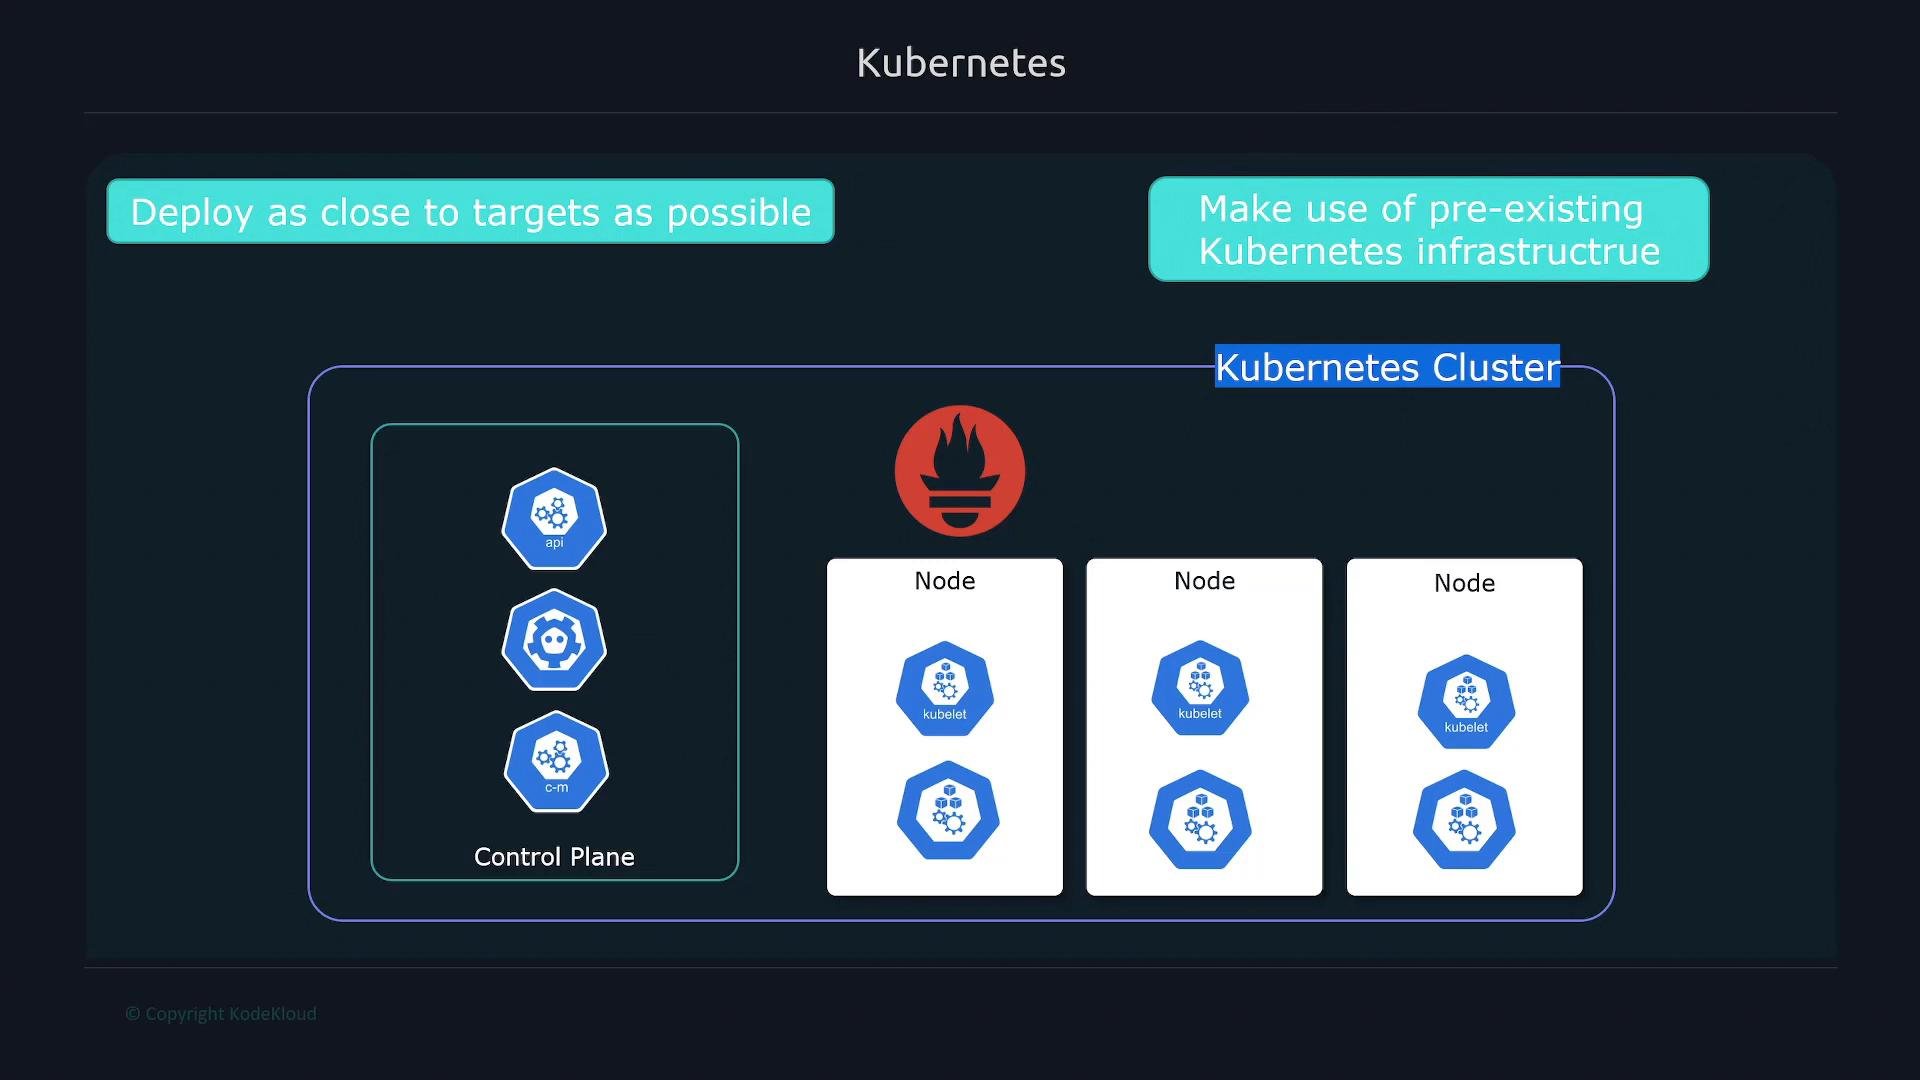
- Application-level metrics — custom and framework metrics emitted by applications running inside pods.
- Cluster-level metrics — metrics about the Kubernetes control plane, nodes, and Kubernetes objects.
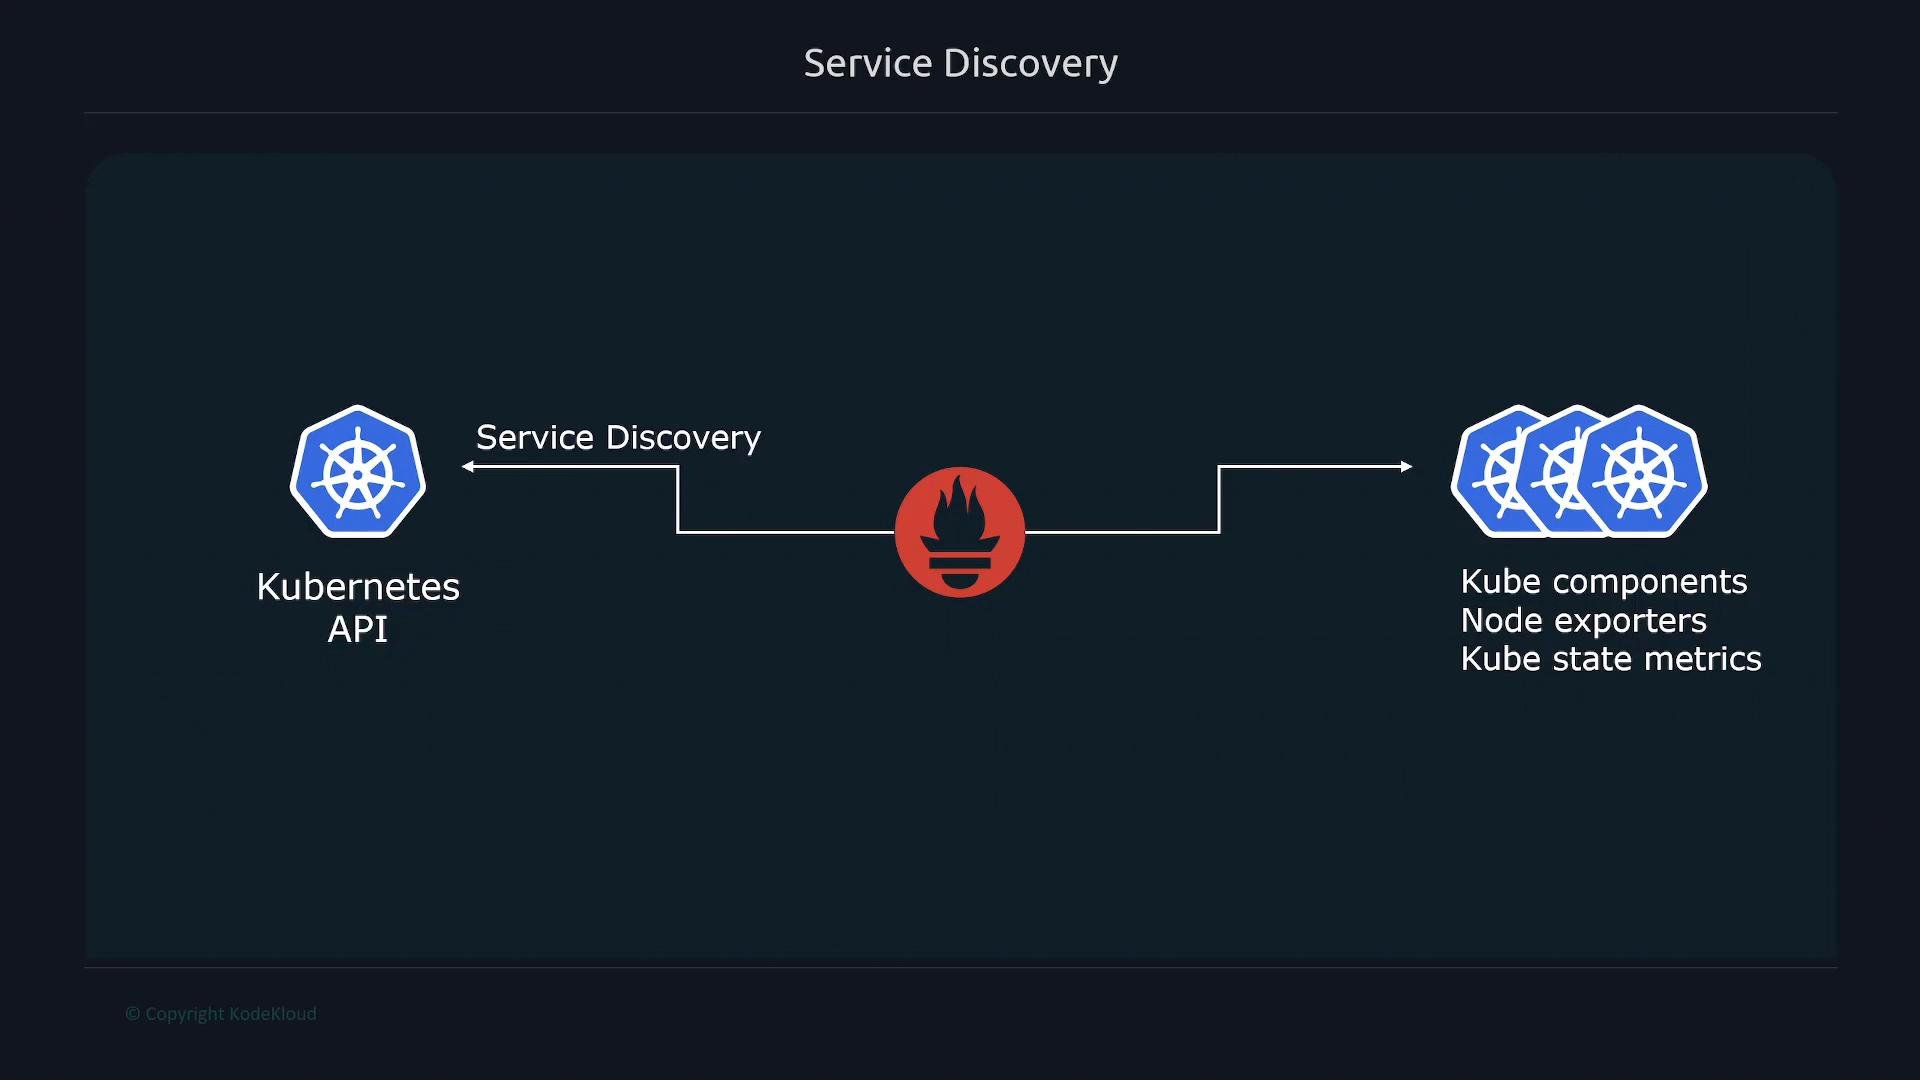
- Control plane components (API server, kube-scheduler, CoreDNS, etcd, etc.).
- kubelet / cAdvisor — provides container- and node-level metrics.
- kube-state-metrics — emits metrics about Kubernetes objects (Deployments, Pods, Services, etc.). Kubernetes does not expose these object-level metrics by default.
- node_exporter — exposes OS-level metrics (CPU, memory, disk, network) from each node.
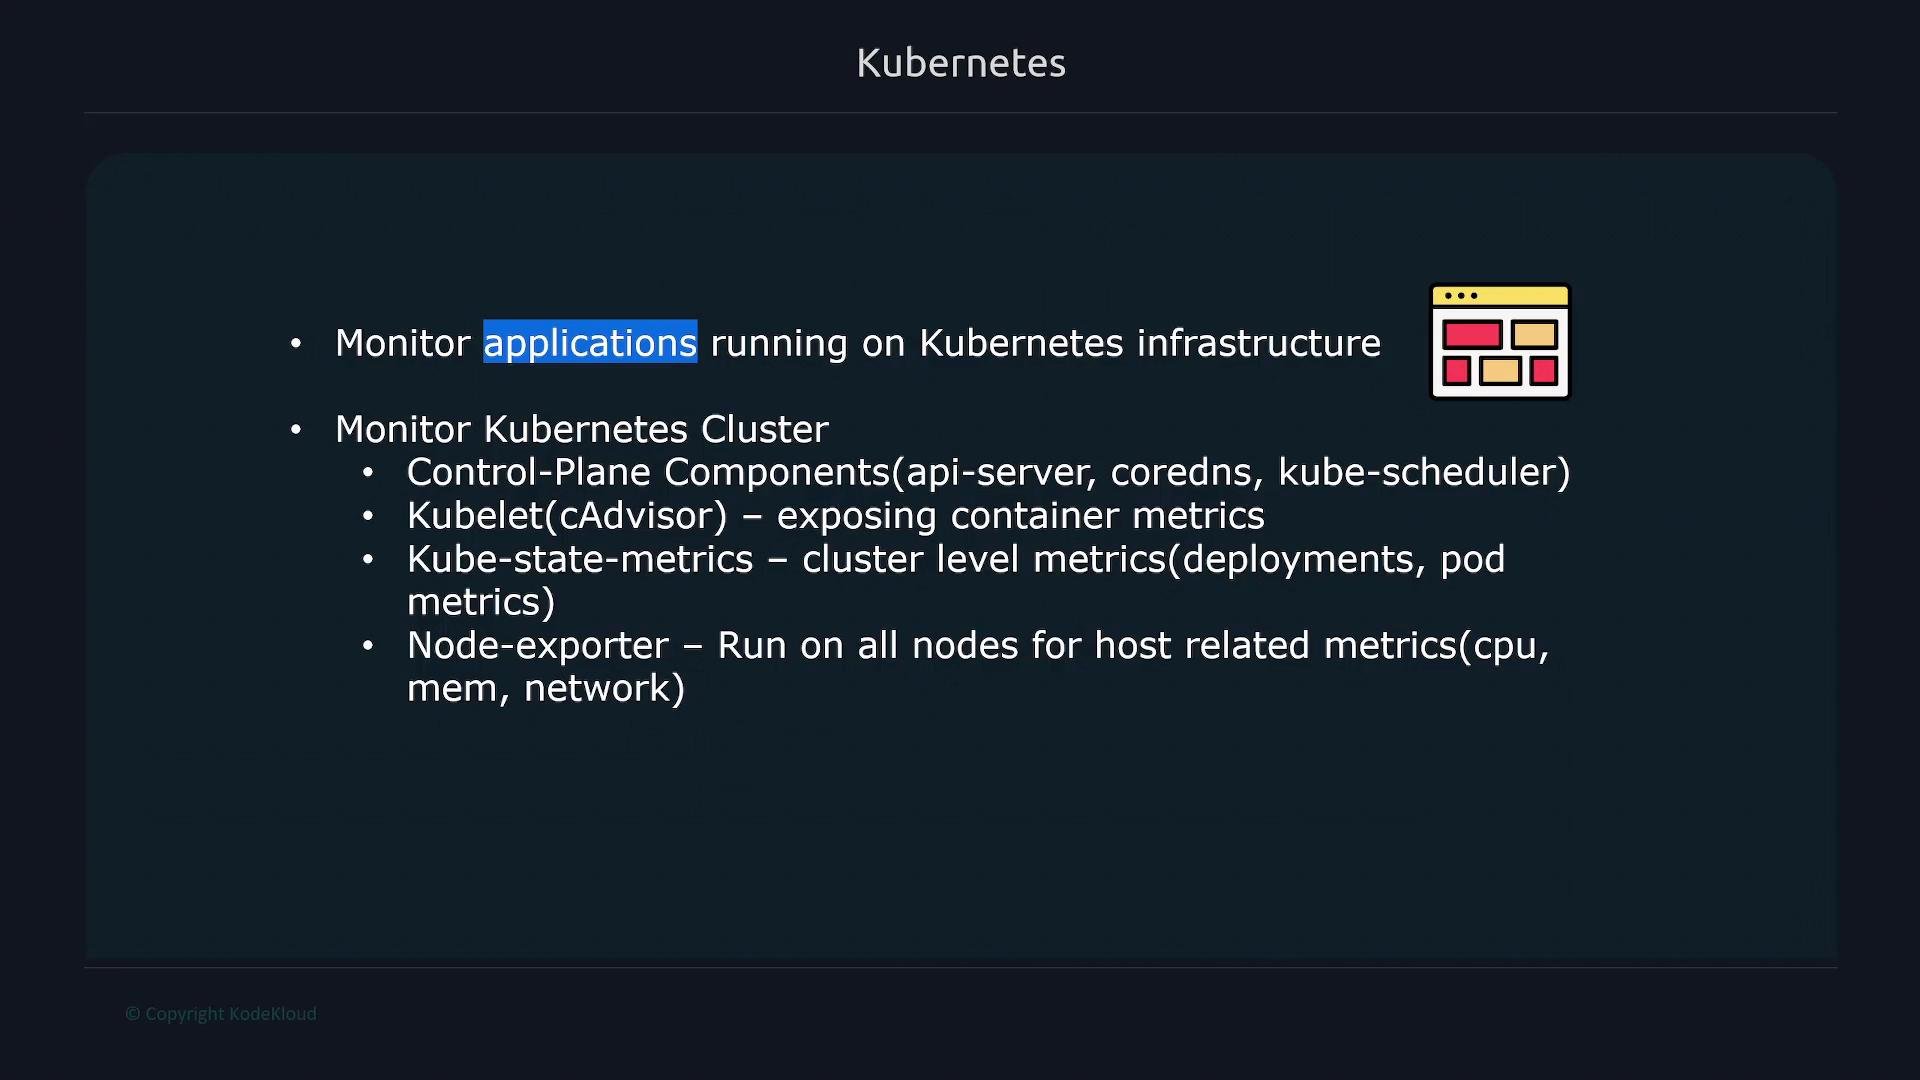
kube_deployment_status_replicas_available or kube_pod_status_phase). Deploy kube-state-metrics in your cluster to enable scraping of deployment/pod/service counts and status information.
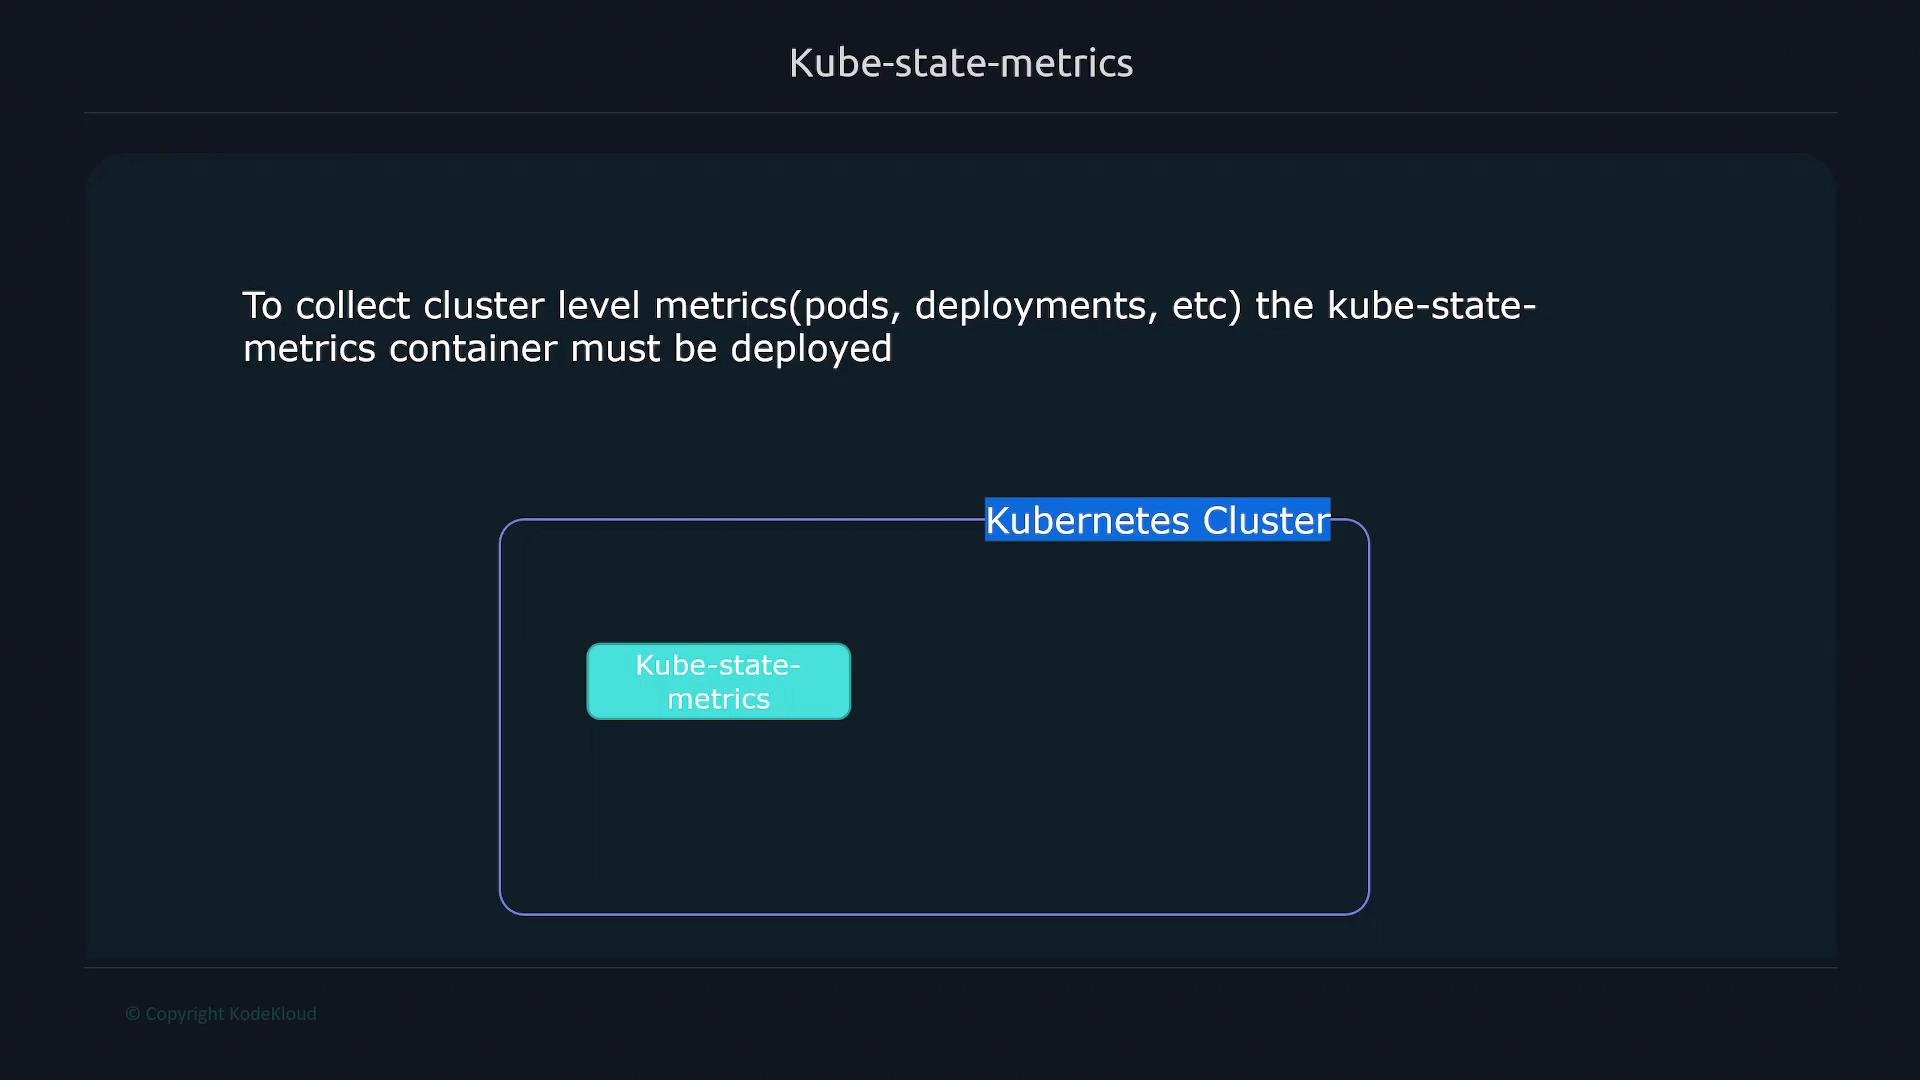
node_exporter to expose OS-level metrics such as CPU, memory, disk and network usage. In Kubernetes, the recommended way to ensure one exporter per node is a DaemonSet because it automatically schedules the exporter pod on every node (including new nodes).
Common options to run node_exporter:
- Manual install on each host (not scalable).
- Bake into the node image (possible but inflexible).
- Use a Kubernetes DaemonSet (recommended).
ServiceMonitor and PodMonitor. This dynamic discovery removes the need to hard-code target addresses.
How to deploy Prometheus in Kubernetes
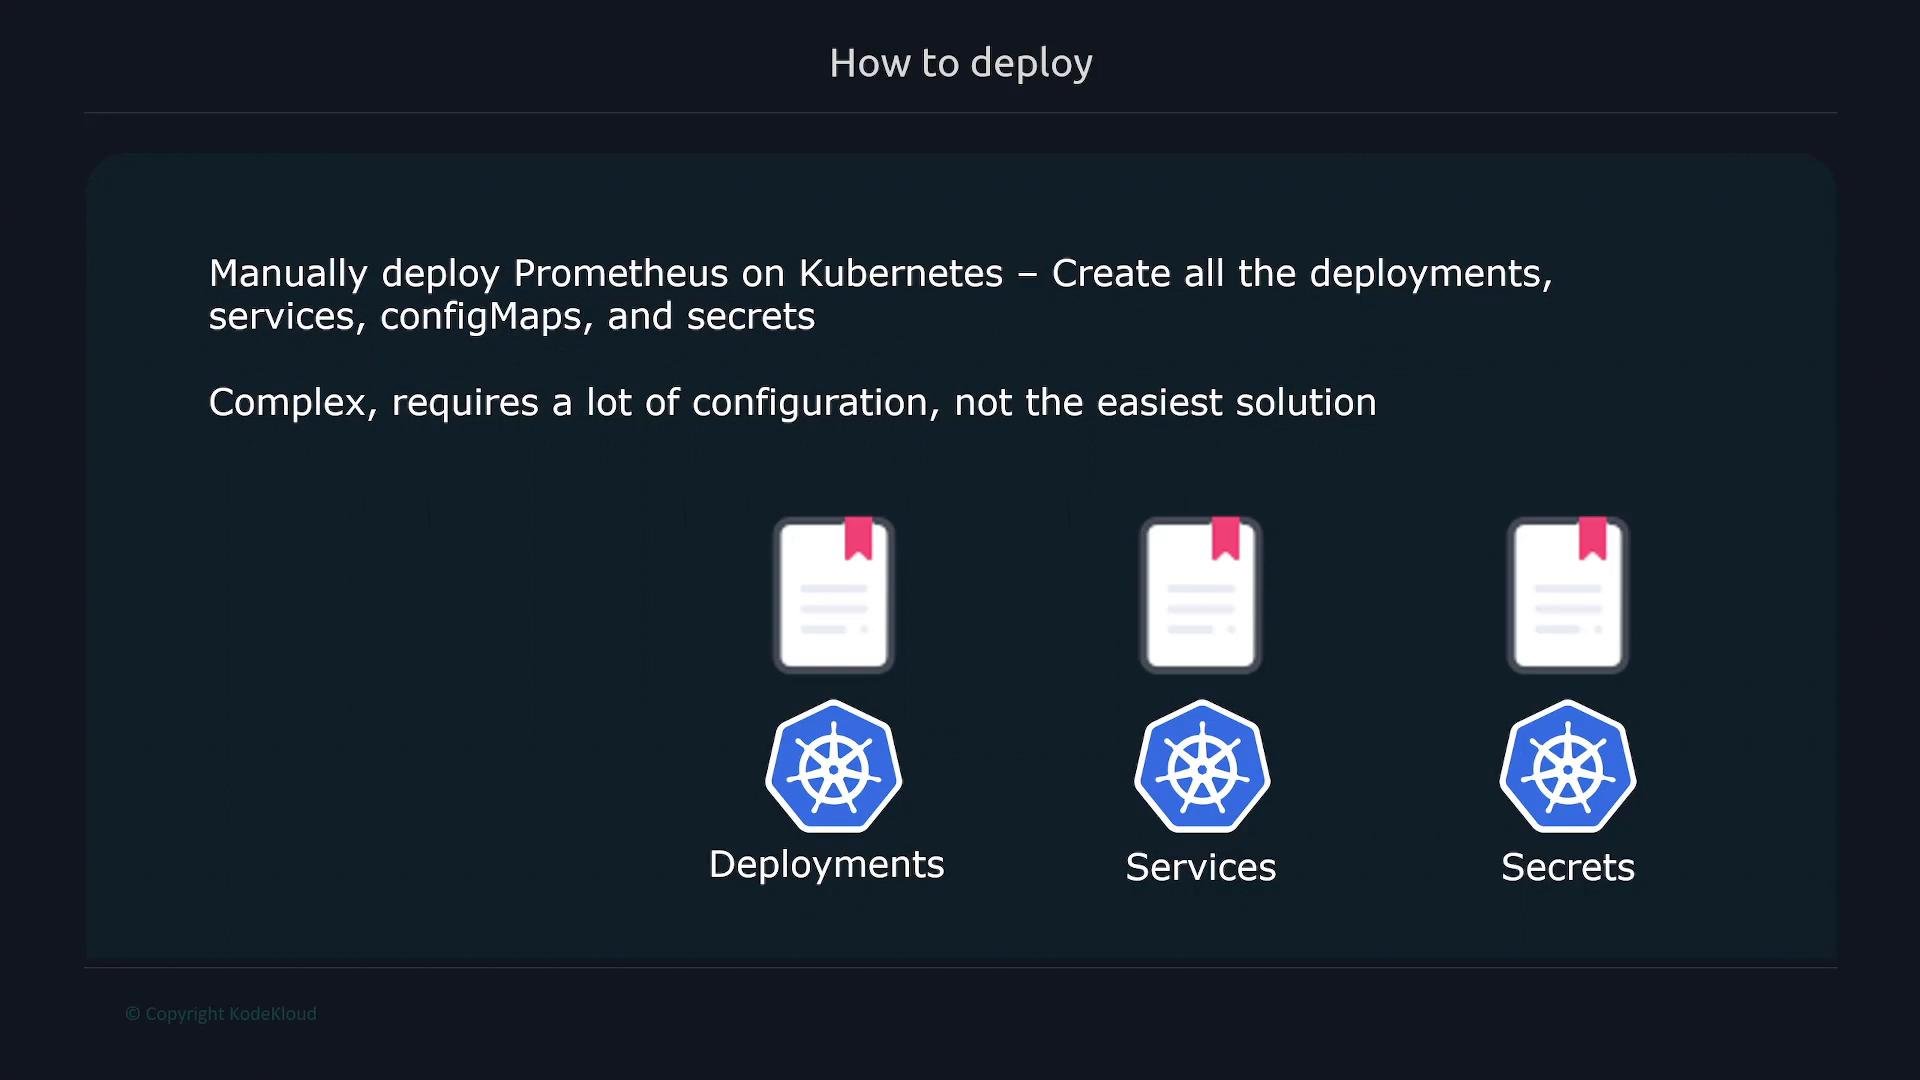
You have two main approaches:
Manual deployment requires creating all Kubernetes objects (Deployments/StatefulSets, Services, ConfigMaps, Secrets, RBAC, etc.), which can be educational but is operationally heavy.
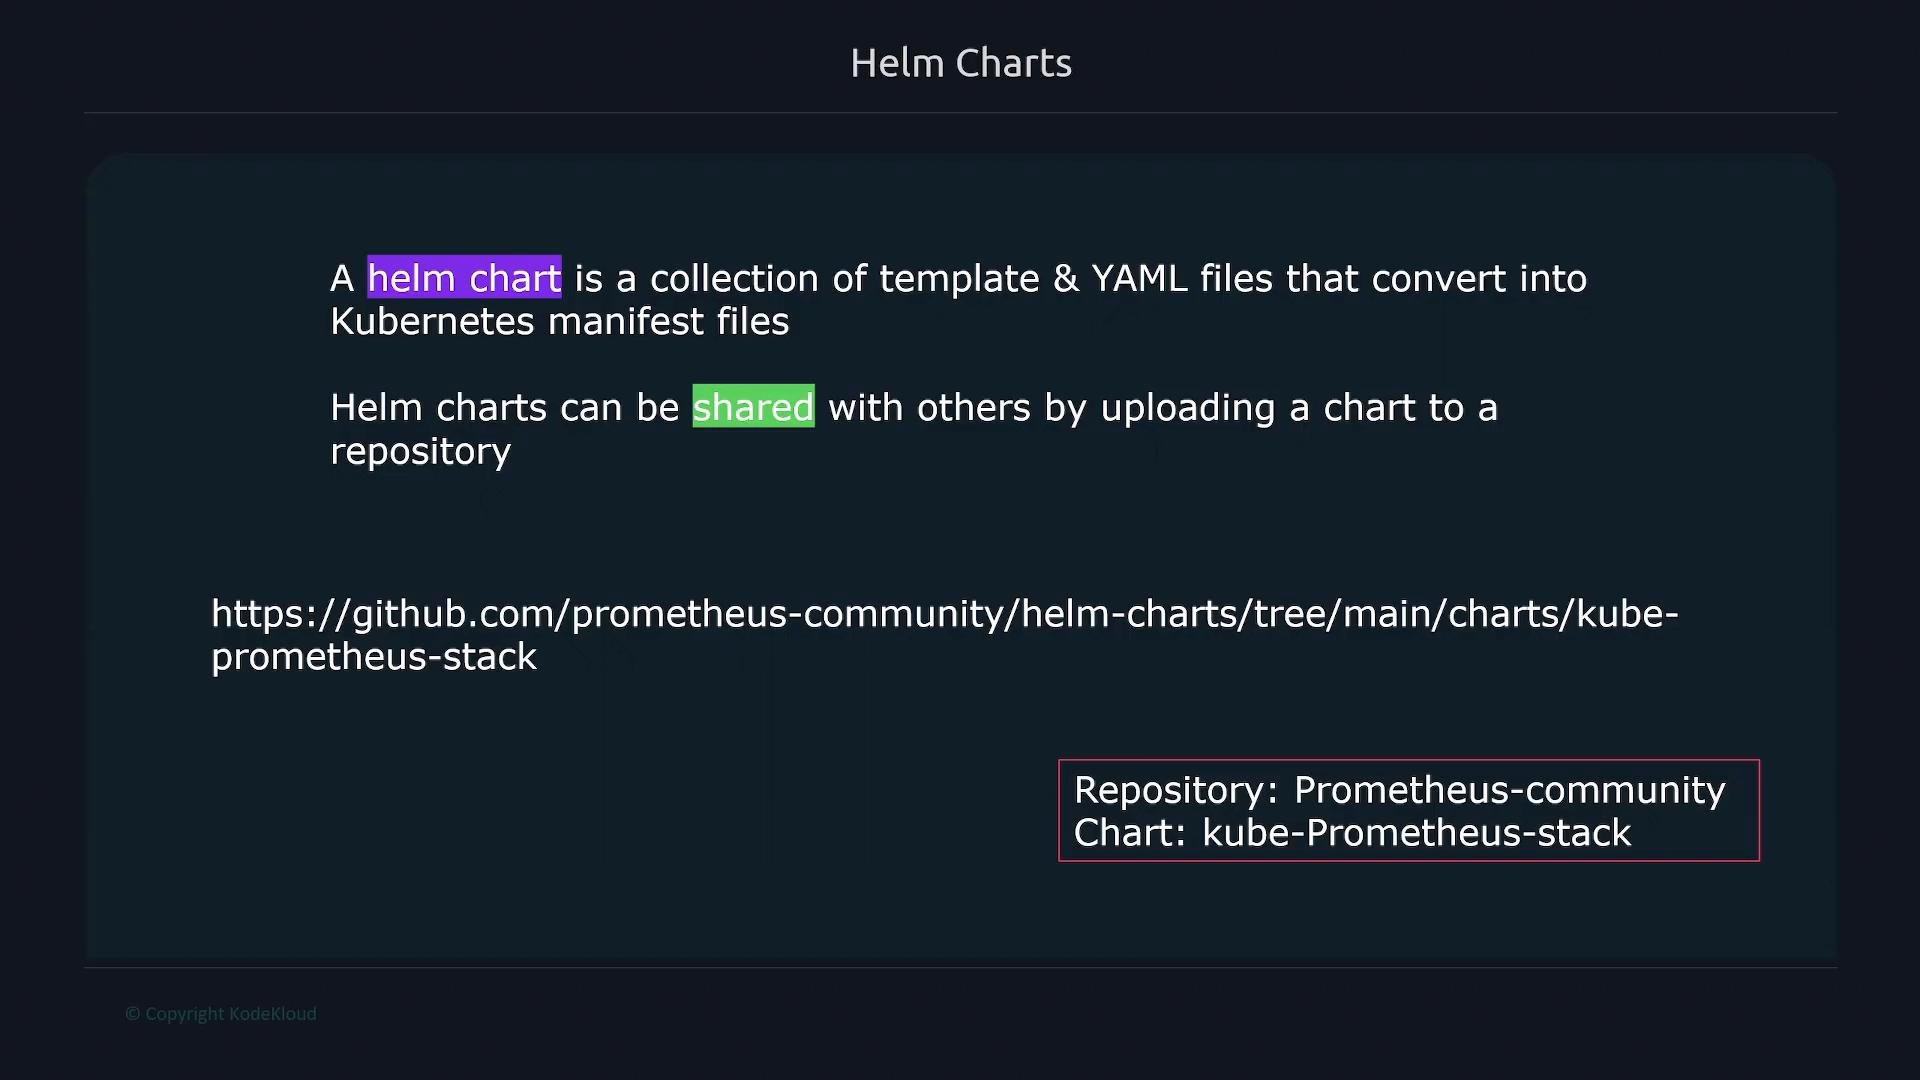
kube-prometheus-stack installs Prometheus, Alertmanager, node-exporter, kube-state-metrics, Pushgateway, Grafana, and the Prometheus Operator — all configured and wired together.
Helm is a Kubernetes package manager that installs versioned, templated charts. To install the community stack:
Prometheus— CRD representing a Prometheus deployment.Alertmanager— CRD for Alertmanager instances.PrometheusRule— CRD for alerting and recording rules.ServiceMonitorandPodMonitor— CRDs to declare scrape targets in a Kubernetes-native way.
Prometheus CRD (created by the Operator):
ServiceMonitor and PodMonitor CRDs let you declare which services or pods Prometheus should scrape. The Operator converts those CRDs into Prometheus scrape configs automatically, so you don’t need to edit Prometheus config files directly.
Running Prometheus inside Kubernetes (for example with the
kube-prometheus-stack Helm chart and the Prometheus Operator) is recommended for most clusters. It reduces manual configuration and uses Kubernetes-native mechanisms such as DaemonSets, ServiceMonitor/PodMonitor, and RBAC.When installing with Helm/Operator, review RBAC and resource limits before deploying to production. The stack creates cluster-level resources and strong permissions — apply least privilege and test upgrades in a staging cluster first.
- Prometheus: https://prometheus.io/
- Prometheus Operator / kube-prometheus: https://github.com/prometheus-operator/kube-prometheus
- kube-prometheus-stack Helm chart: https://github.com/prometheus-community/helm-charts/tree/main/charts/kube-prometheus-stack
- Helm documentation: https://helm.sh/docs/
- Kubernetes documentation: https://kubernetes.io/docs/