

Kubernetes service discovery roles
Prometheus supports multiple Kubernetes SD roles. Below is a concise reference of the most common roles and when to use them.The kube-prometheus-stack Helm chart uses
role: endpoints by default. This gives Prometheus access to all endpoints, and relabeling rules are applied so ServiceMonitor-derived jobs only scrape the intended endpoints.Representative global configuration
Below is a cleaned excerpt of the default Prometheus configuration produced by the Helm chart. Note thekubernetes_sd_configs block is set to role: endpoints, and alerting is wired to Alertmanager discovered via ServiceMonitor.
role: endpointsis used so Prometheus discovers IP:port pairs for every Service.- Alertmanager is discovered via labels and endpoint port selection, then referenced in
alertmanagers. - Rule files are mounted into the
rule_filessection.
How ServiceMonitor resources become scrape jobs
Helm (via the Prometheus Operator flow) converts ServiceMonitor objects into Prometheusscrape_configs. Each ServiceMonitor results in a scrape job configured to search the endpoints SD stream and then apply relabeling to select only the endpoints that match the ServiceMonitor’s labels and port name.
Below is a representative scrape_config for the Alertmanager ServiceMonitor and the relabeling used to keep only the intended Alertmanager endpoint.
- Copy the
joblabel into a temporary label for bookkeeping (__tmp_prometheus_job_name). - The
keeprules ensure the discovered endpoint belongs to a Service with specific labels:app=kube-prometheus-stack-alertmanagerrelease=prometheusself-monitor=trueThese combined label checks ensure only the Alertmanager Service is kept for this job.
__meta_kubernetes_endpoint_port_name: http-webensures the endpoint port is the intended HTTP port.- Node/Pod relabels extract the target name into
node/podlabels for easier identification. - The namespace is recorded on the target label set.
Example: API server ServiceMonitor (HTTPS + service account auth)
Some components (like the API server) require TLS and token-based authorization. The ServiceMonitor-derived scrape job includesauthorization and tls_config to securely access /metrics over HTTPS:
Inspecting Service Discovery and active targets
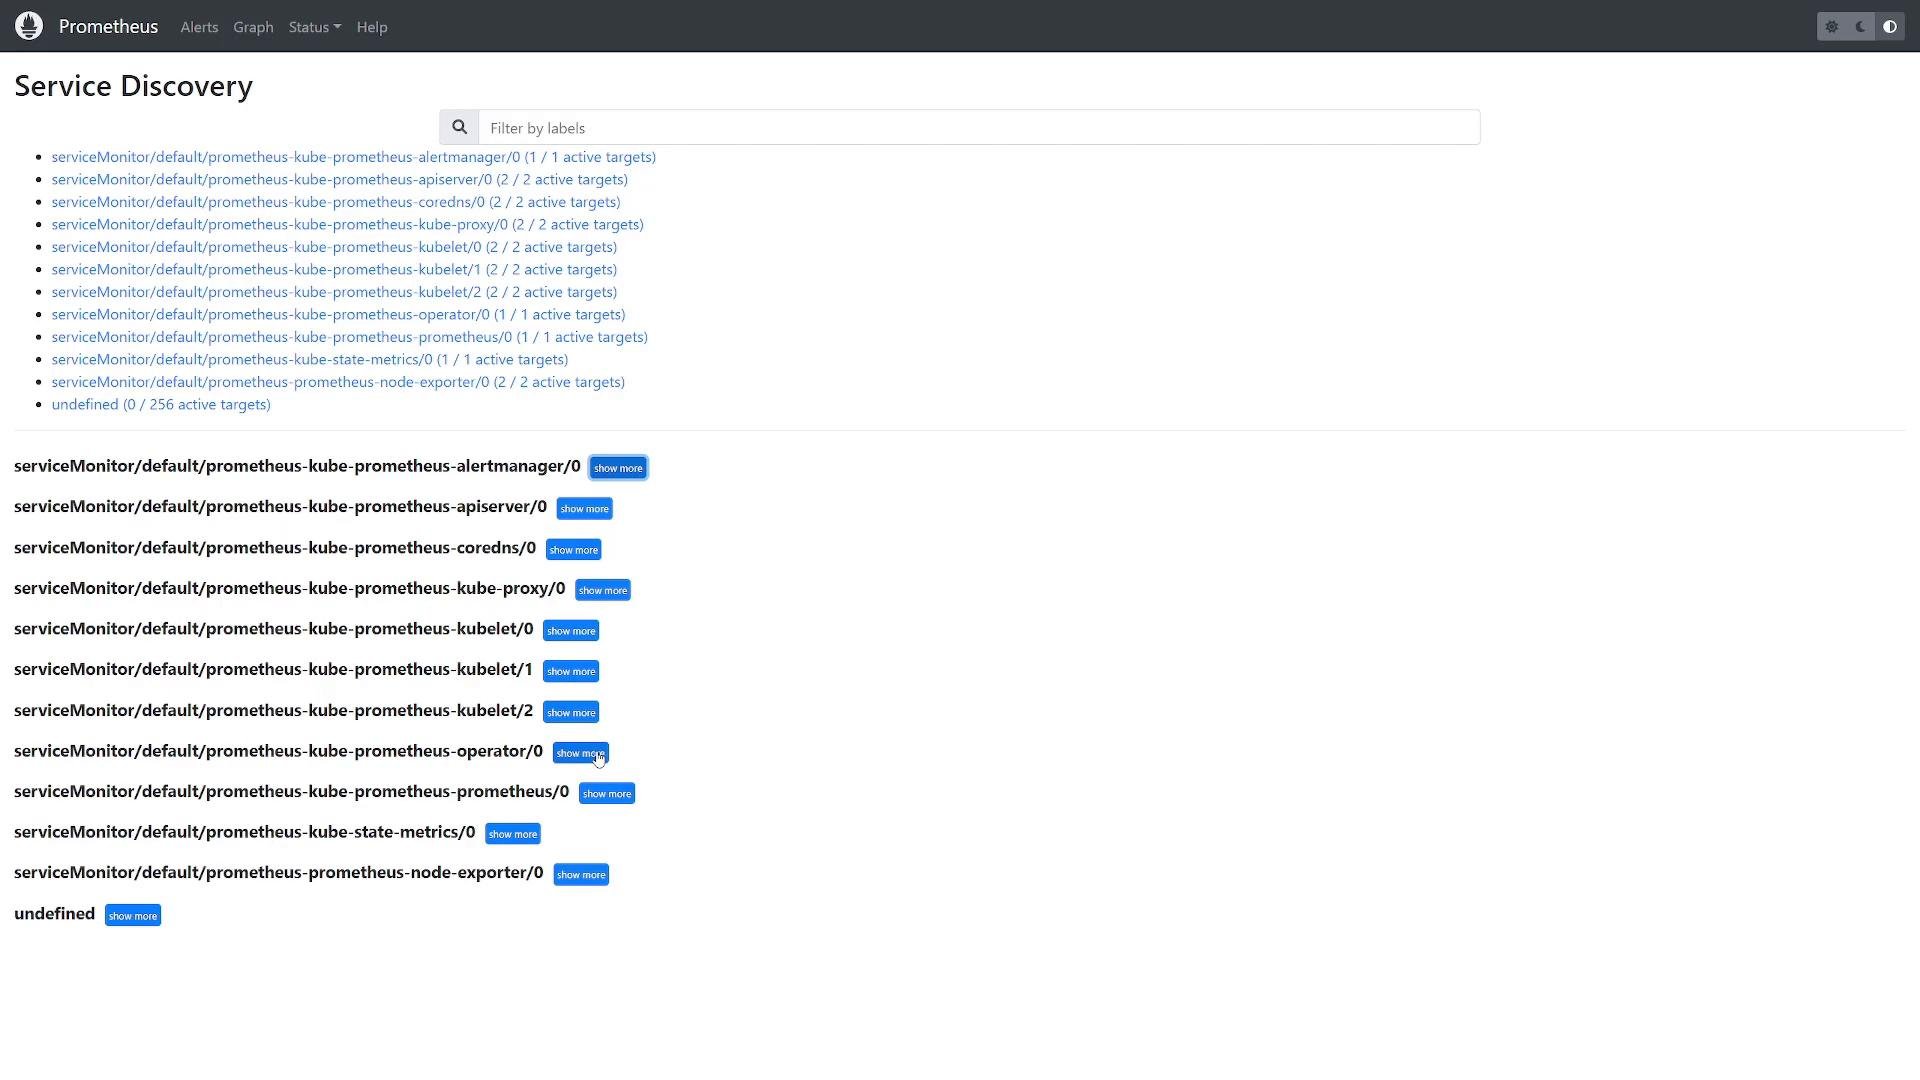
You can verify how the SD and relabel rules behave in the Prometheus UI:- Status → Service Discovery shows the raw discovered endpoints from Kubernetes.
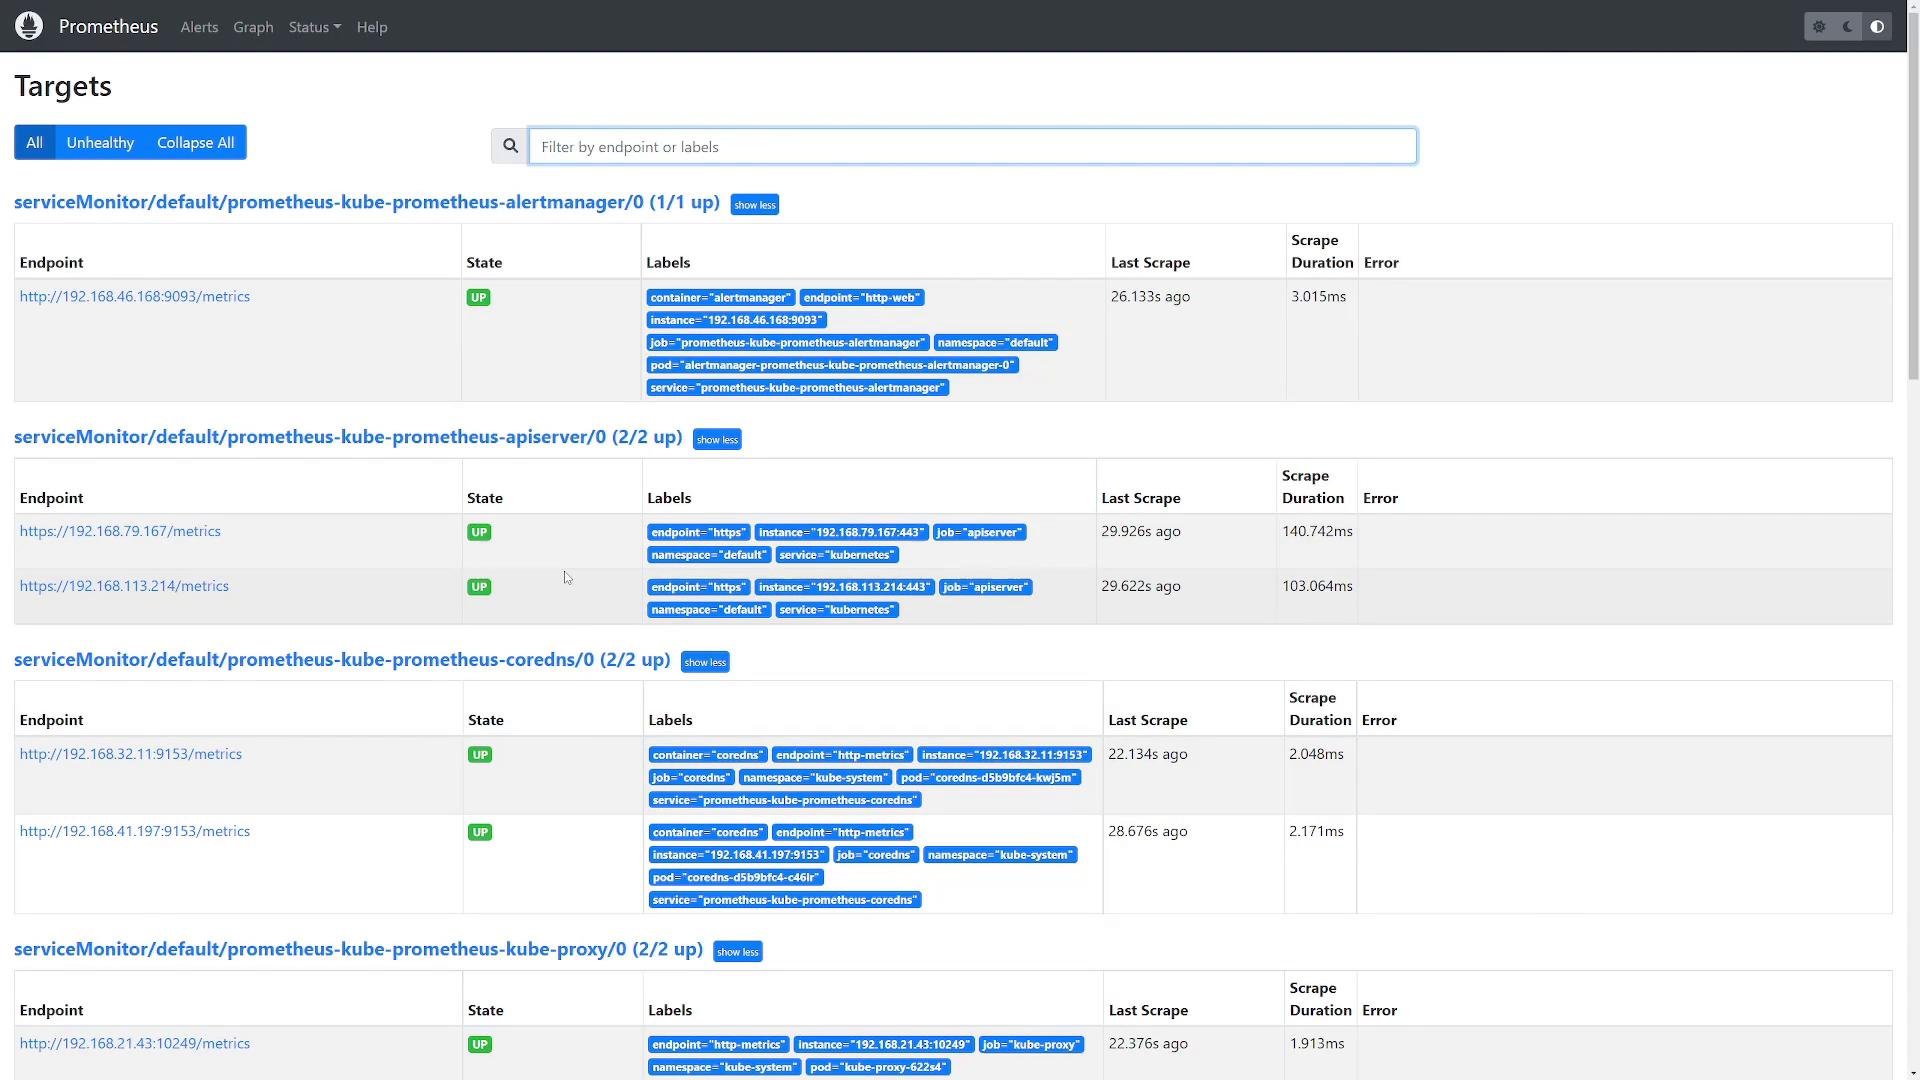
- Status → Targets shows the final active targets Prometheus is scraping (with their UP/Down state, last scrape, and scrape duration).
Summary
- The kube-prometheus-stack Helm chart configures Prometheus to use Kubernetes endpoints SD (
role: endpoints) for broad discovery. - ServiceMonitor resources are translated into
scrape_configsthat filter the endpoints stream usingrelabel_configs, ensuring each job scrapes only its intended targets. - Use the Prometheus UI (Service Discovery and Targets) to inspect discovered endpoints and active scrapes.
- Custom relabeling is available when you need to alter defaults or implement more selective scraping.
Links and references
- Prometheus Service Discovery: https://prometheus.io/docs/prometheus/latest/configuration/configuration/#kubernetes_sd_config
- Kubernetes Service Discovery in Prometheus: https://prometheus.io/docs/prometheus/latest/configuration/configuration/#kubernetes_sd_config
- Prometheus Operator / kube-prometheus-stack: https://github.com/prometheus-operator/kube-prometheus
- Kubernetes documentation: https://kubernetes.io/docs/