

1. Download and extract Alertmanager
On the machine that will run Alertmanager, download the appropriate tarball from the Prometheus downloads page and extract it. Replace<ALERTMANAGER_TARBALL_URL> with the URL you copied for your platform.
2. Start Alertmanager
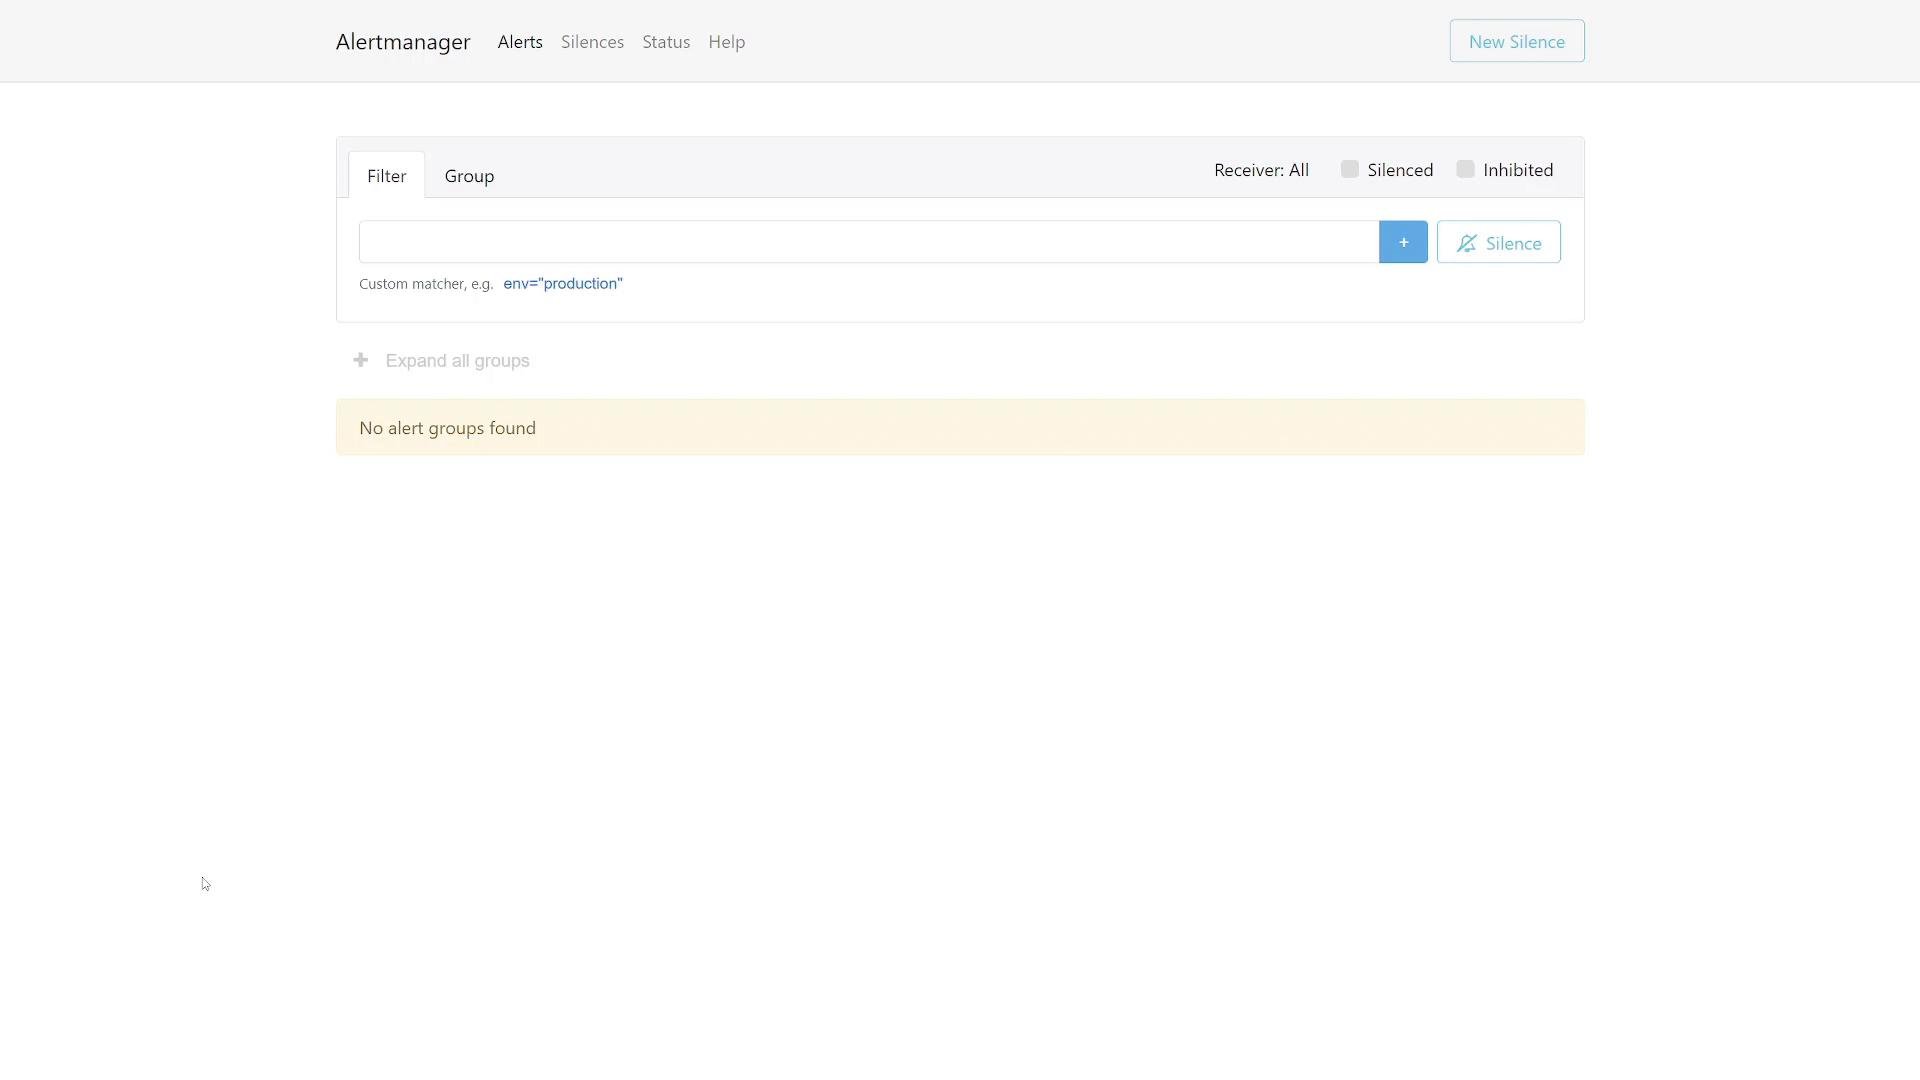
From inside the extracted directory you can start Alertmanager directly:9093. Open a browser to http://localhost:9093 (or http://<server-ip>:9093) to access the web UI.
3. Configure Prometheus to send alerts to Alertmanager
Tell Prometheus where your Alertmanager instances are by adding analerting.alertmanagers section to prometheus.yml. Below is a minimal example showing a global block, the alerting configuration, and a sample rule file reference:
alertmanager1:9093 and alertmanager2:9093 with the hostnames or IPs (and ports) of your Alertmanager instances. Prometheus will push alerts to all listed targets.
Tips and troubleshooting
Alertmanager reads
alertmanager.yml from the current working directory by default. To use a different config path start it with --config.file=/path/to/alertmanager.yml. Use amtool for quick CLI checks and validations — see the docs for amtool (e.g., ./amtool check-config alertmanager.yml) for examples: https://prometheus.io/docs/alerting/latest/alertmanager/#amtoolIf Alertmanager is running on a remote host, ensure port
9093 is reachable from your Prometheus server (open firewalls, allow security group rules, and adjust SELinux if applicable). If you run multiple Alertmanager replicas, read the clustering docs to configure clustering and persistent storage correctly.Additional resources
- Prometheus Alerting: https://prometheus.io/docs/alerting/latest/
- Alertmanager docs and configuration examples: https://prometheus.io/docs/alerting/latest/alertmanager/
alerting.alertmanagers section in Prometheus to forward alerts.