

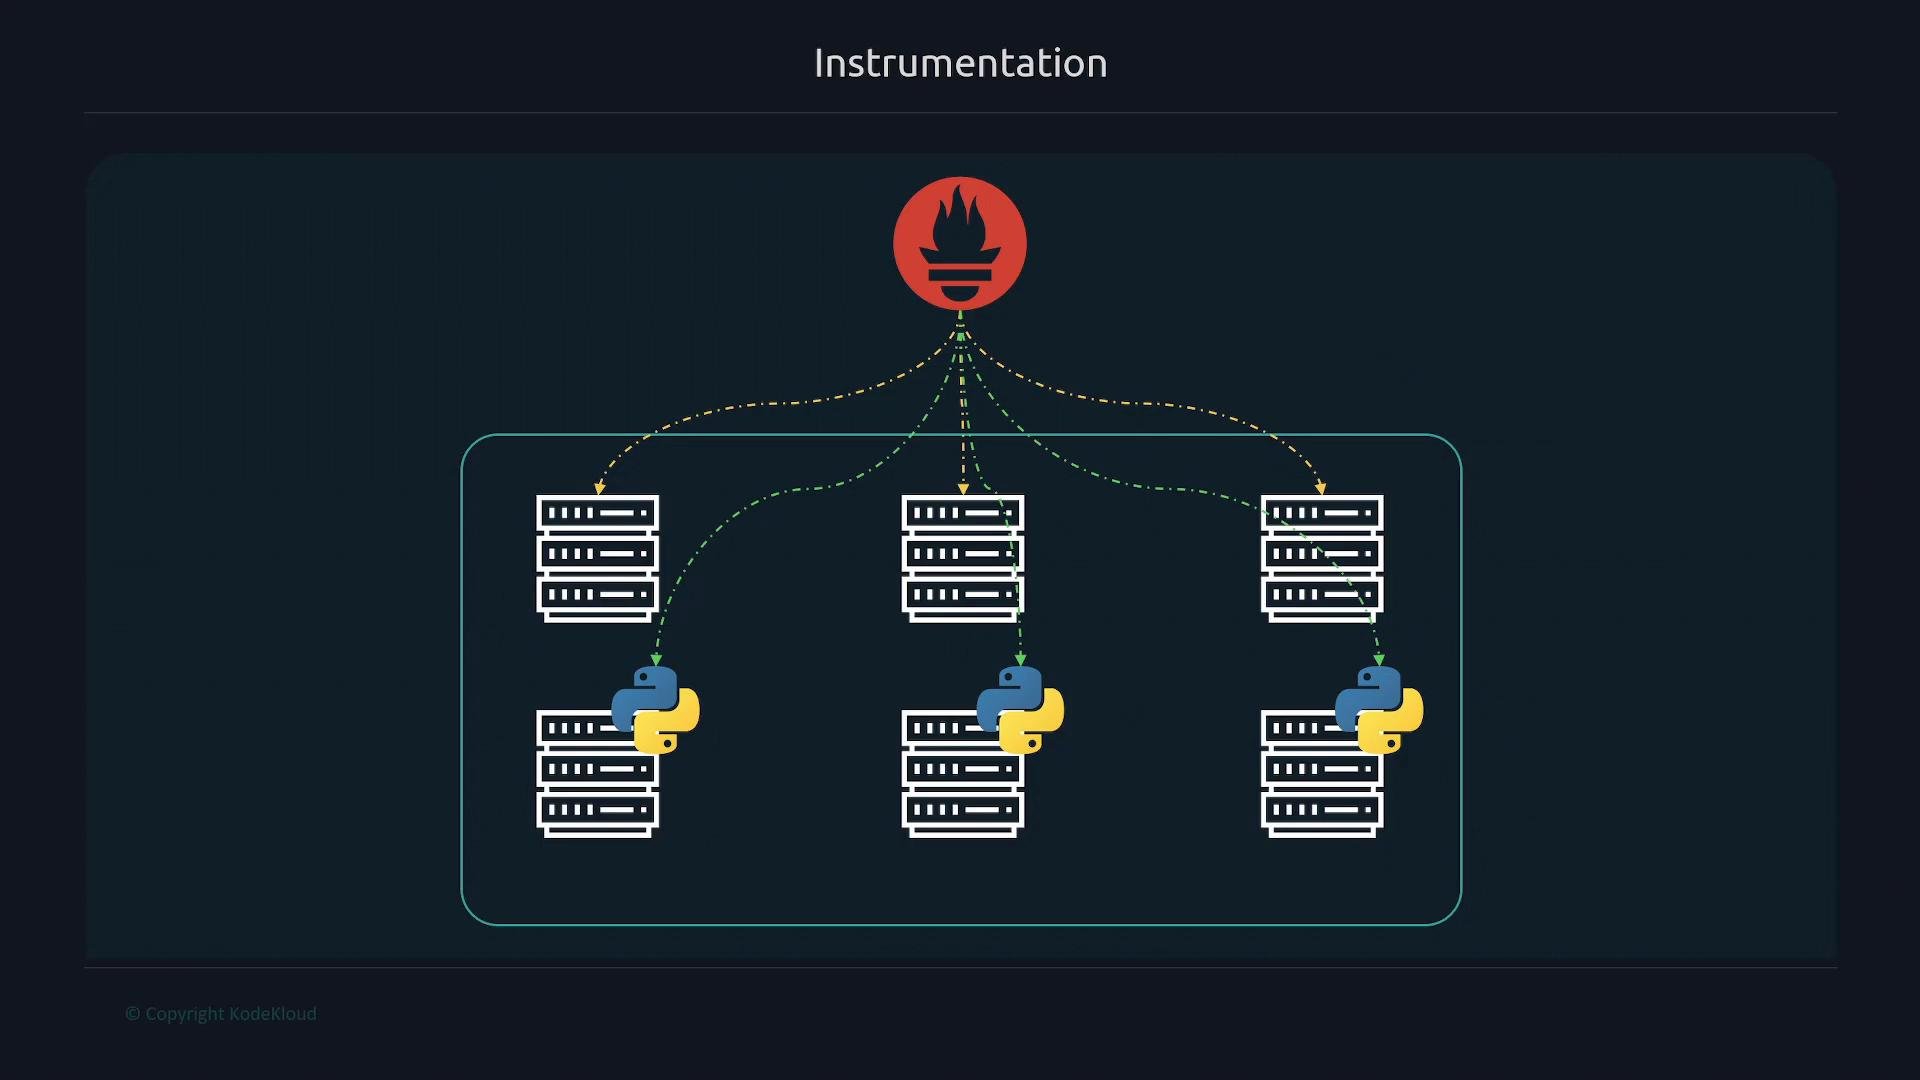
- Record metrics in the Prometheus exposition format using metric primitives such as
Counter,Gauge,Histogram, andSummary. - Expose those metrics at an HTTP endpoint (commonly
/metrics) so Prometheus can scrape them.
If you’re not familiar with Python, focus on what metrics are being added and what they measure. The instrumentation concepts — metric types, labels, and the
/metrics endpoint — apply across languages and frameworks.Prometheus metric primitives
Understanding the main metric types helps you choose the right primitive for each signal you want to record.Common client libraries
Example: instrumenting a Python API
Below is a minimal example showing how to instrument a Python Flask API using the officialprometheus_client library. It demonstrates:
- Defining a
CounterandHistogram - Incrementing the counter and observing latency
- Exposing metrics at
/metricsfor Prometheus to scrape
http://<host>:5000/metrics to collect these application-level metrics.
Avoid exposing sensitive information via metrics and be mindful of cardinality when using labels (high-cardinality labels can cause high memory use in Prometheus). Prefer a limited set of stable label values.
Next steps and references
- Instrument critical endpoints and business transactions first (requests, errors, latency, queue depth).
- Keep label cardinality low and stable.
- Combine application metrics with infrastructure metrics for full-stack observability.