

kubectl port-forward for local access.
We’ll cover:
- Inspecting the Prometheus Service
- Options to expose Prometheus externally (NodePort, LoadBalancer, Ingress)
- Quick demo: port-forwarding for local access
Inspect the Prometheus Service
First, list services to find Prometheus:prometheus-kube-prometheus-prometheus is type: ClusterIP, meaning it’s only reachable from inside the cluster (pods and other cluster-local clients).
To export the full Service manifest for inspection:
Options to access Prometheus from outside the cluster
You have several ways to make Prometheus accessible externally:- Change the Service
type:- NodePort — exposes the Service on a node port accessible on each node.
- LoadBalancer — requests a cloud provider load balancer to route external traffic.
- Create an Ingress that routes HTTP(S) to the Service.
- Use
kubectl port-forwardfor a short-lived local tunnel (great for demos and debugging).
Quick commands to change the Service type to
NodePort:
Patch the Service (one-liner):
For production or multi-user access, prefer
LoadBalancer (cloud) or an Ingress with authentication and TLS. NodePort is simple but less flexible for serving traffic securely at scale.Quick demo — port-forward Prometheus to localhost
Port-forwarding is the fastest way to access the Prometheus UI from your laptop for verification or troubleshooting.- Find a Prometheus pod using labels:
- Forward port 9090 from the Service or a specific pod to your local machine:
- Forward the Service (recommended — will route to the pod backing the Service):
- Or forward a specific Prometheus pod:
- Open the Prometheus UI in your browser:
kubectl port-forward is temporary and only binds to your client machine. It is not a replacement for proper external access (NodePort/LoadBalancer/Ingress) in production.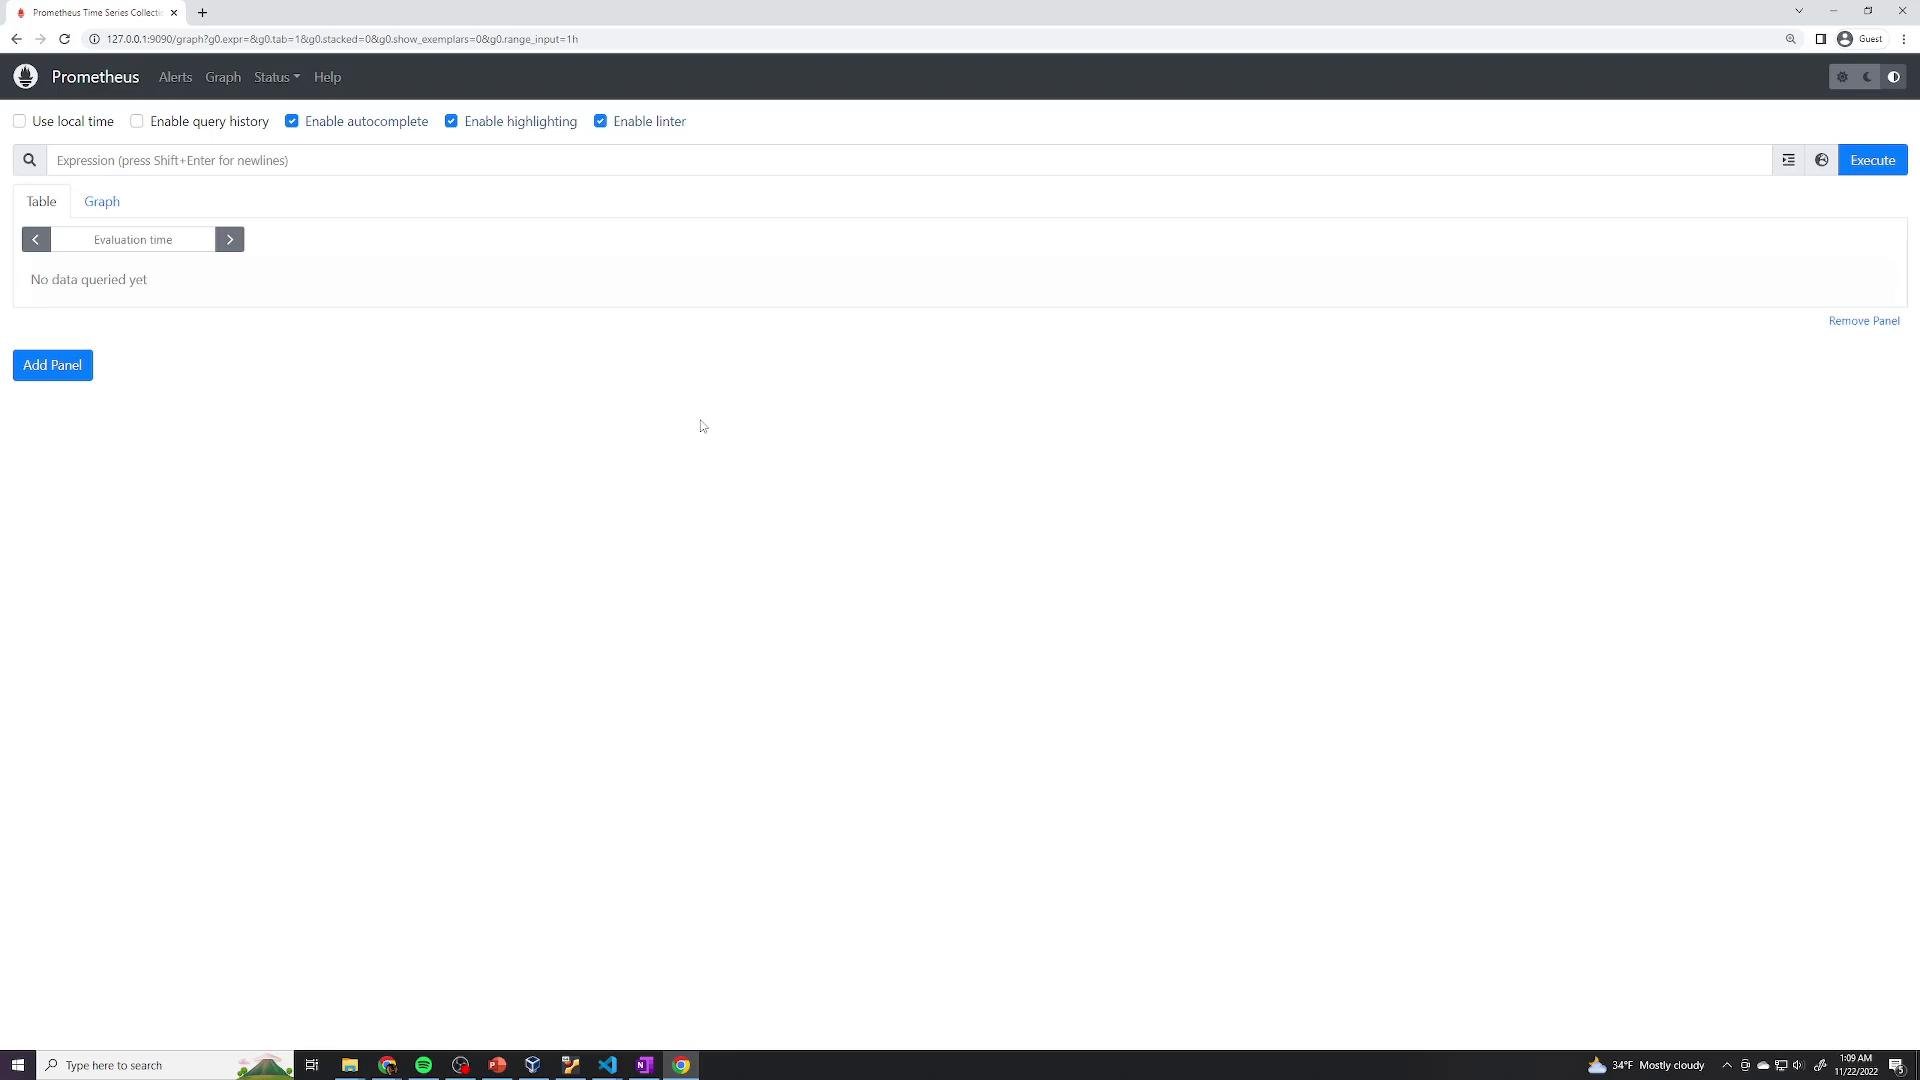
Summary
- A Service of
type: ClusterIPis cluster-internal only. - For quick access use
kubectl port-forward. - For sustained or production access prefer
LoadBalancerorIngresswith TLS and authentication;NodePortis a simple alternative for non-production use.
Links and References
- Prometheus: https://prometheus.io/docs/introduction/overview/
- Kubernetes: https://kubernetes.io/docs/concepts/overview/what-is-kubernetes/
- Services (Kubernetes): https://kubernetes.io/docs/concepts/services-networking/service/
- Port forwarding (kubectl): https://kubernetes.io/docs/tasks/access-application-cluster/port-forward-access-application/
- Ingress (Kubernetes): https://kubernetes.io/docs/concepts/services-networking/ingress/