

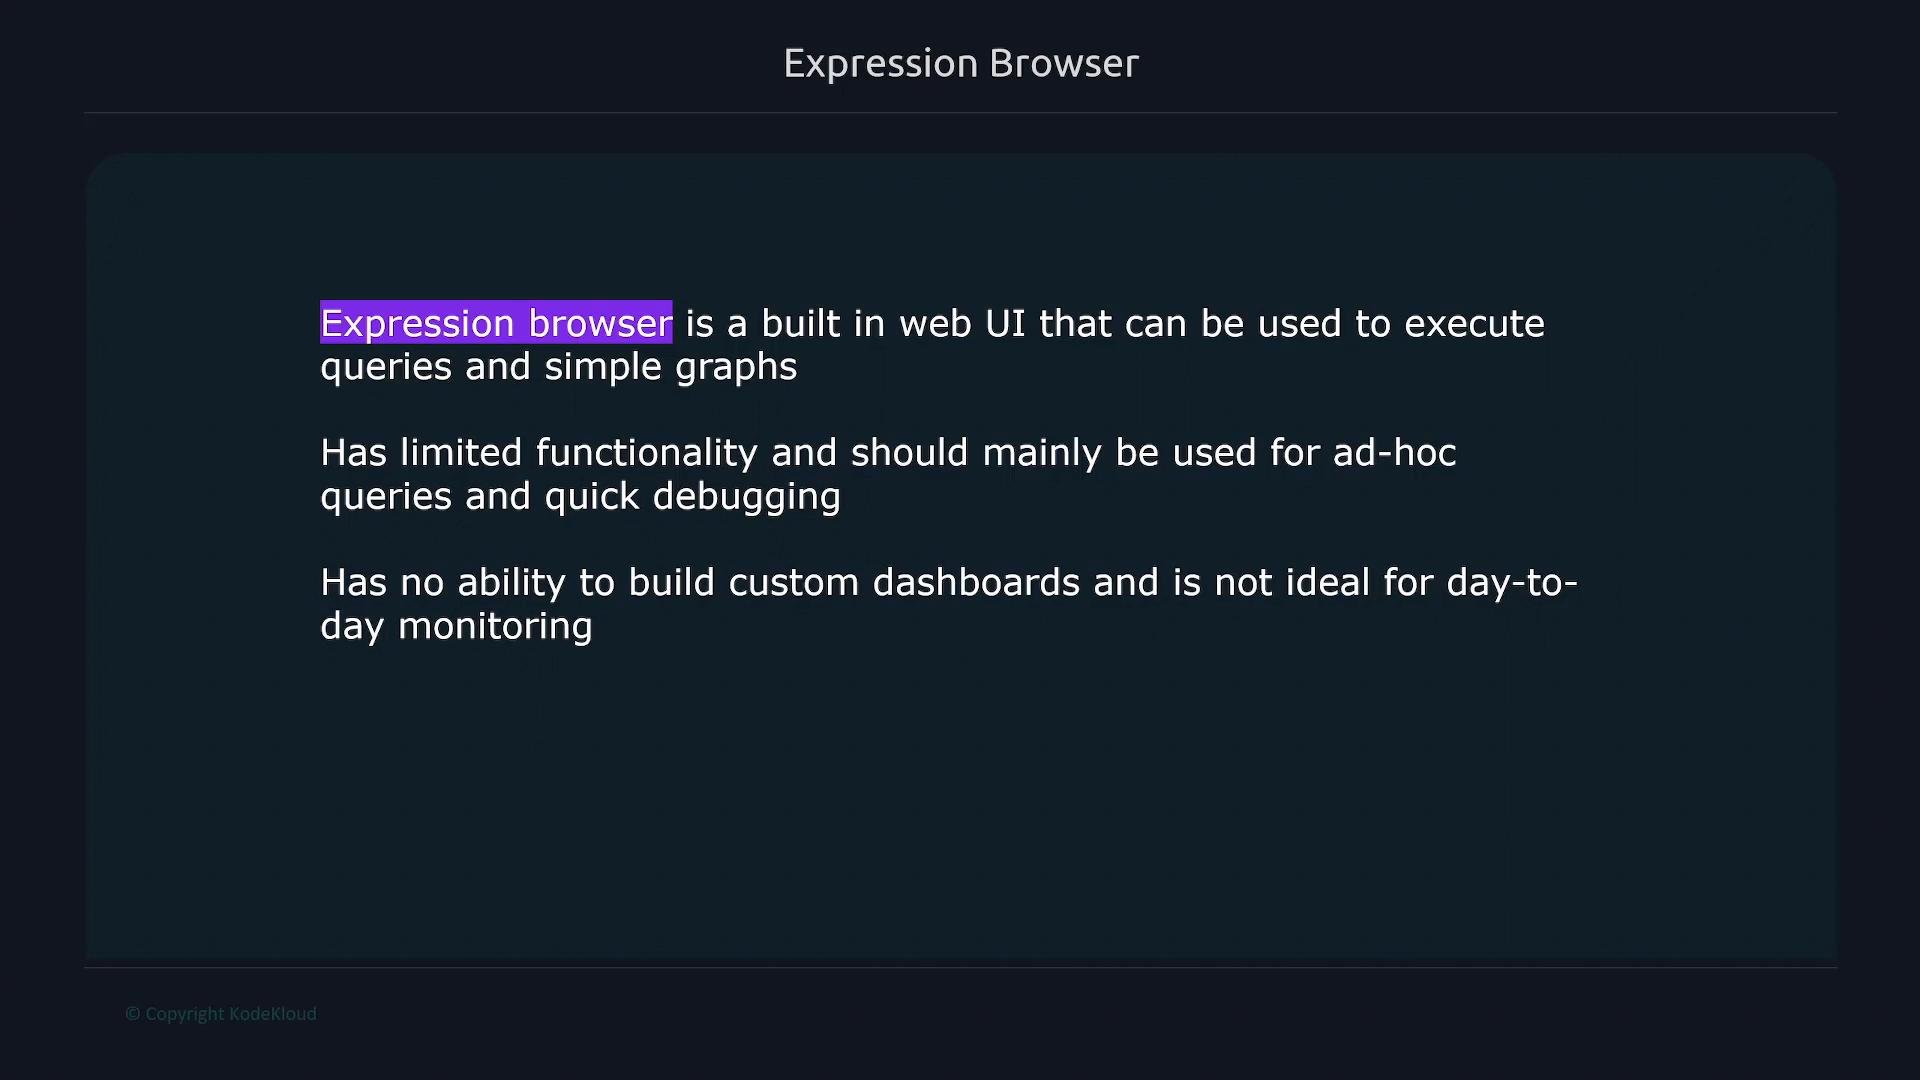
The Expression Browser is excellent for experimentation: test PromQL expressions, validate label fingerprints, and verify the behavior of instant vs range vectors before promoting queries to dashboards.
Quick access
- Open your browser and navigate to your Prometheus server, for example:
http://<PROMETHEUS_IP>:9090 - The default view is the Query page. Enter PromQL expressions in the query box and click Execute.
Query box and autocomplete
- The query input supports autocomplete for metric names and functions. Toggle autocomplete via the checkbox in the UI.
- Autocomplete speeds up discovery of available metrics and reduces typos.
Execute queries and inspect results
- Type a PromQL expression in the Query box and click Execute.
- The UI displays matching series with labels and current values.
- Use the “Evaluation time” dropdown to evaluate queries at a past timestamp.
- Understand vector types:
- Instant vectors: single sample per series at a specified timestamp (used by the Graph page).
- Range vectors: sequences of samples over a time range (used by functions like
rate()).
Range vectors cannot be plotted directly on the Graph page. Wrap range vectors with functions that return instant vectors (for example,
rate() or increase()) before plotting.Panels
- The Query page supports multiple panels so you can run several queries side-by-side.
- Each panel has its own query box and results area — useful for comparing series or testing variations of a query.
Graph page — plotting queries
- The Graph tab visualizes query results over time. The Graph expects an instant vector (or an expression that evaluates to an instant vector).
- Supplying a raw range vector directly to the Graph page will produce an error:
- For time-based rates or derivatives, wrap a range-vector expression with a function that returns an instant vector. Common example for counters:
- After evaluating to an instant vector, the Graph page will render the time-series. Use the graph time window selector (e.g., 30m, 2h) and the evaluation time control to view historical data.
- The graph legend shows one entry per returned series (for example, different
modelabel values). Click legend entries to toggle series visibility.
Summary and best practices
- Use the Expression Browser for:
- One-off PromQL evaluations and debugging.
- Inspecting label sets, sample values, and behavior of functions.
- Remember:
- The Query page is for ad-hoc evaluation; the Graph page expects instant vectors.
- Use
rate()or similar functions to convert range vectors into plottable instant vectors.
- For production dashboards and alerting, use a dedicated visualization tool and promote validated queries from the Expression Browser into that environment.