

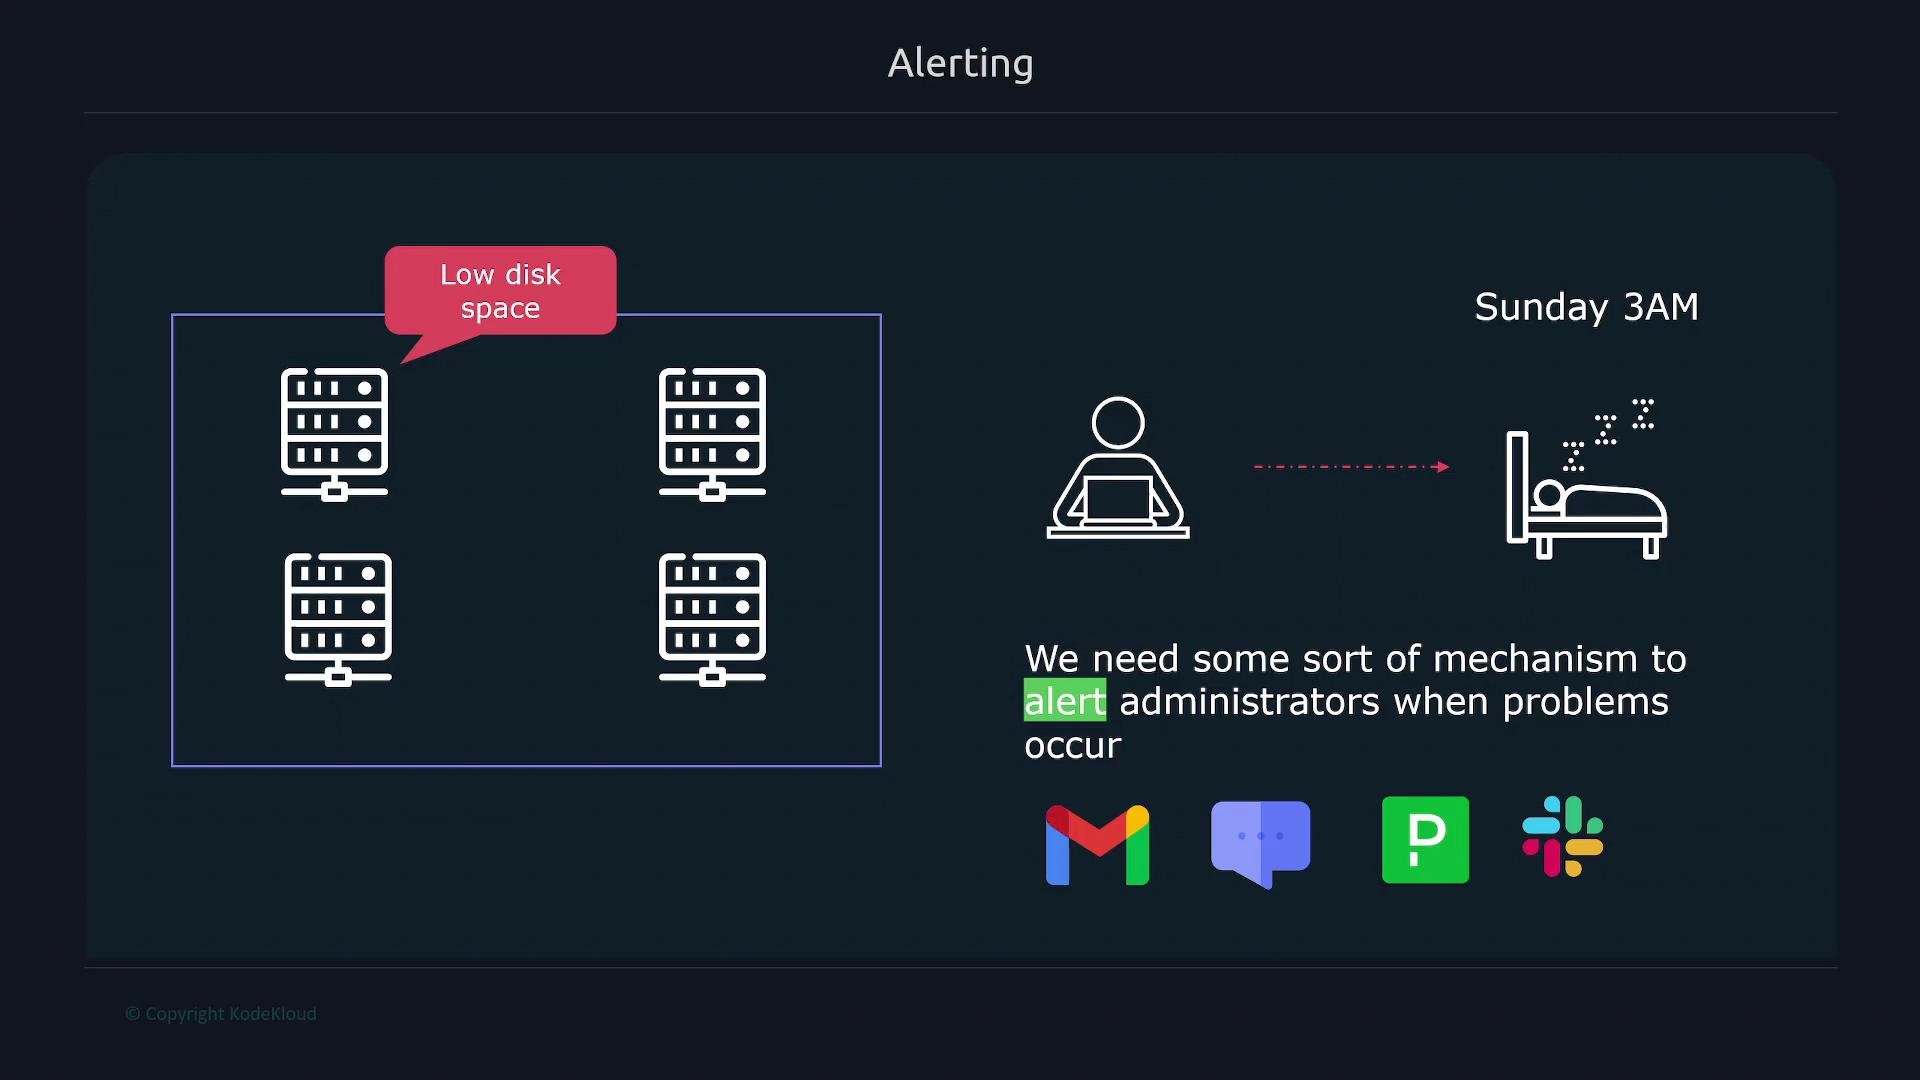
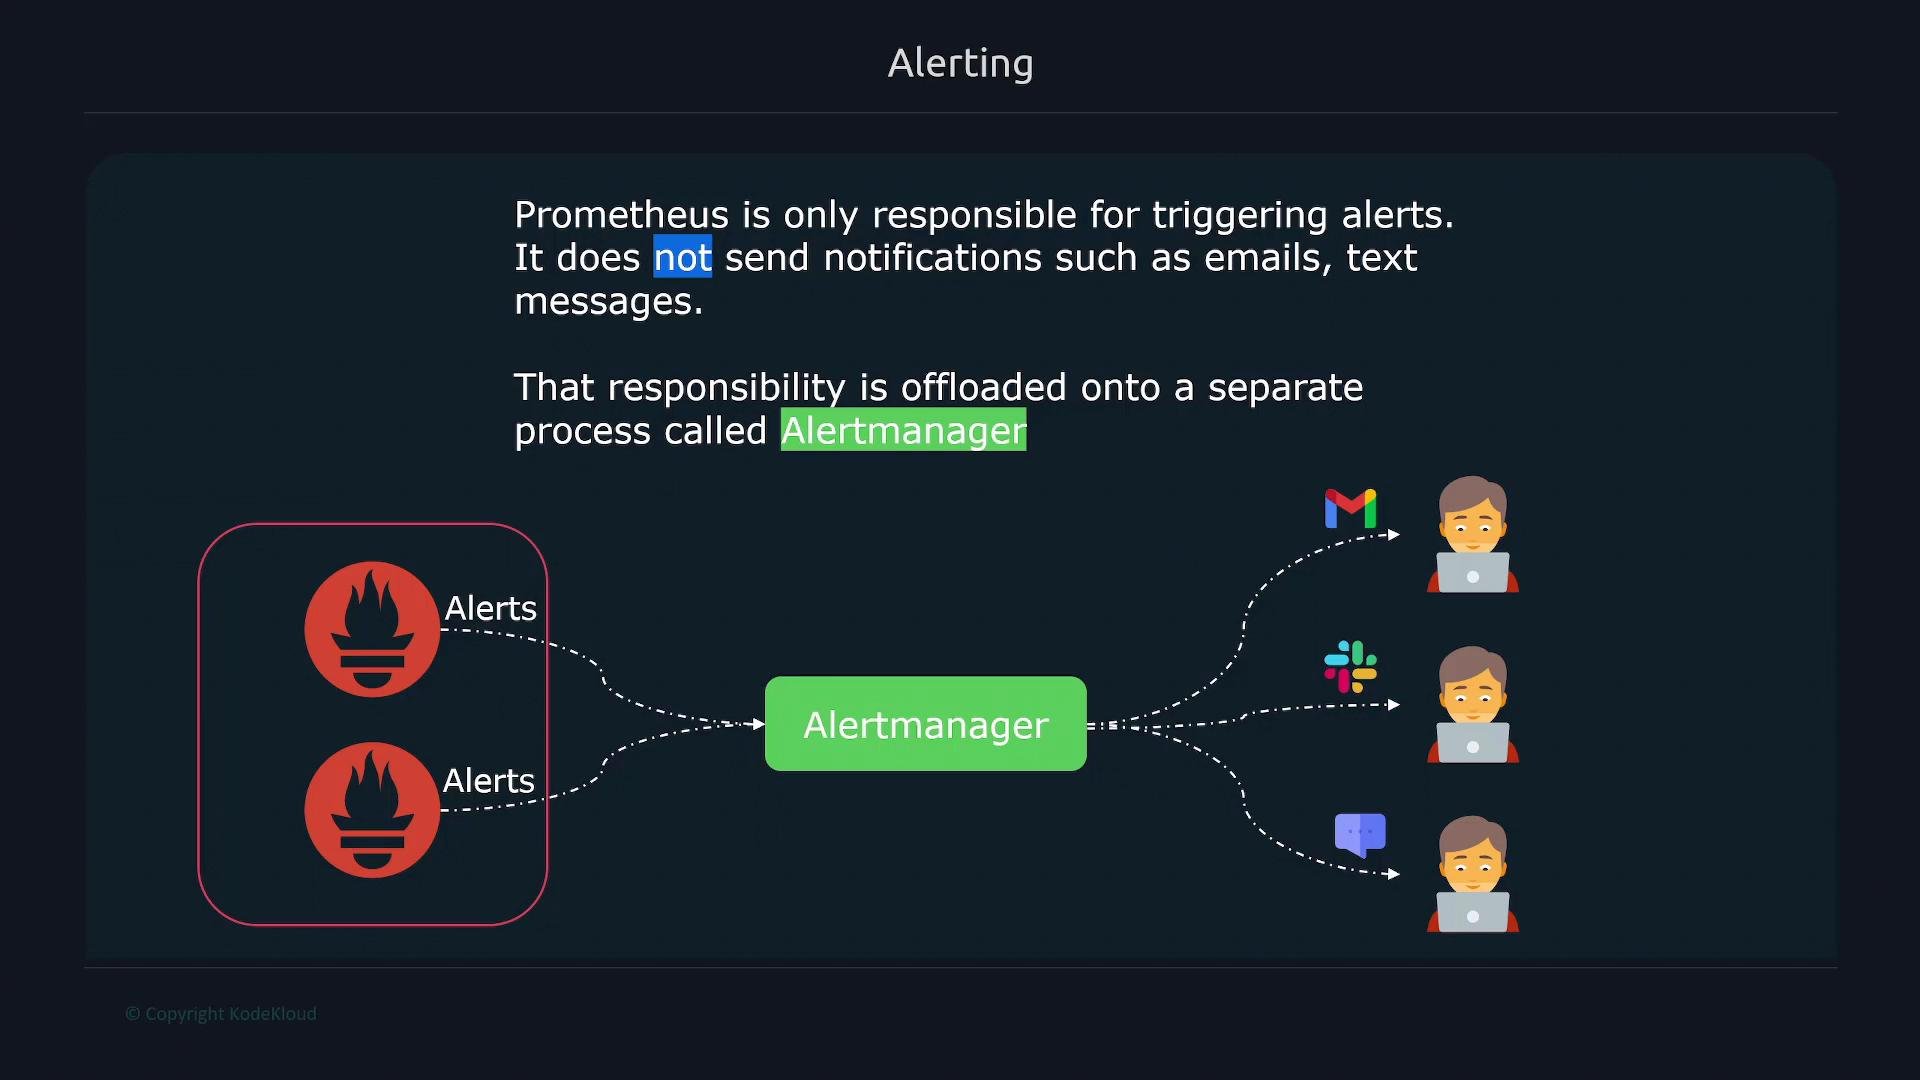
Prometheus sends alert objects to Alertmanager. Alertmanager handles silencing, grouping, routing, and delivering notifications to various receivers such as email, Slack, or PagerDuty.
alert instead of record. You can also set a for clause on an alert to require the expression to be true continuously for a duration before the alert moves to firing — useful to avoid transient flaps.
Example rule group that defines a recording rule for memory free percent and an alert that fires when that percent falls below 20%:
- The recording rule computes the percent of free memory for targets with
job="node". - The
LowMemoryalert uses that recorded metric and requires the condition to be true for 3 minutes (for: 3m) before transitioning to firing.
up metric. The for clause helps avoid false positives due to short-lived scrape failures:
Use the
for clause to reduce alert noise from short-lived network or scrape blips. If a node recovers before the for period elapses, the alert remains Pending and will not transition to Firing.- Group recording and alerting rules logically in rule files and set a reasonable
intervalfor evaluation to balance timeliness and load. - Use label-based grouping (in Alertmanager) to route alerts to the appropriate team or channel.
- Test alert rules in a non-production environment and use silence windows for maintenance.
- Add descriptive
annotationsto alerts to include runbook links and helpful context for responders.