

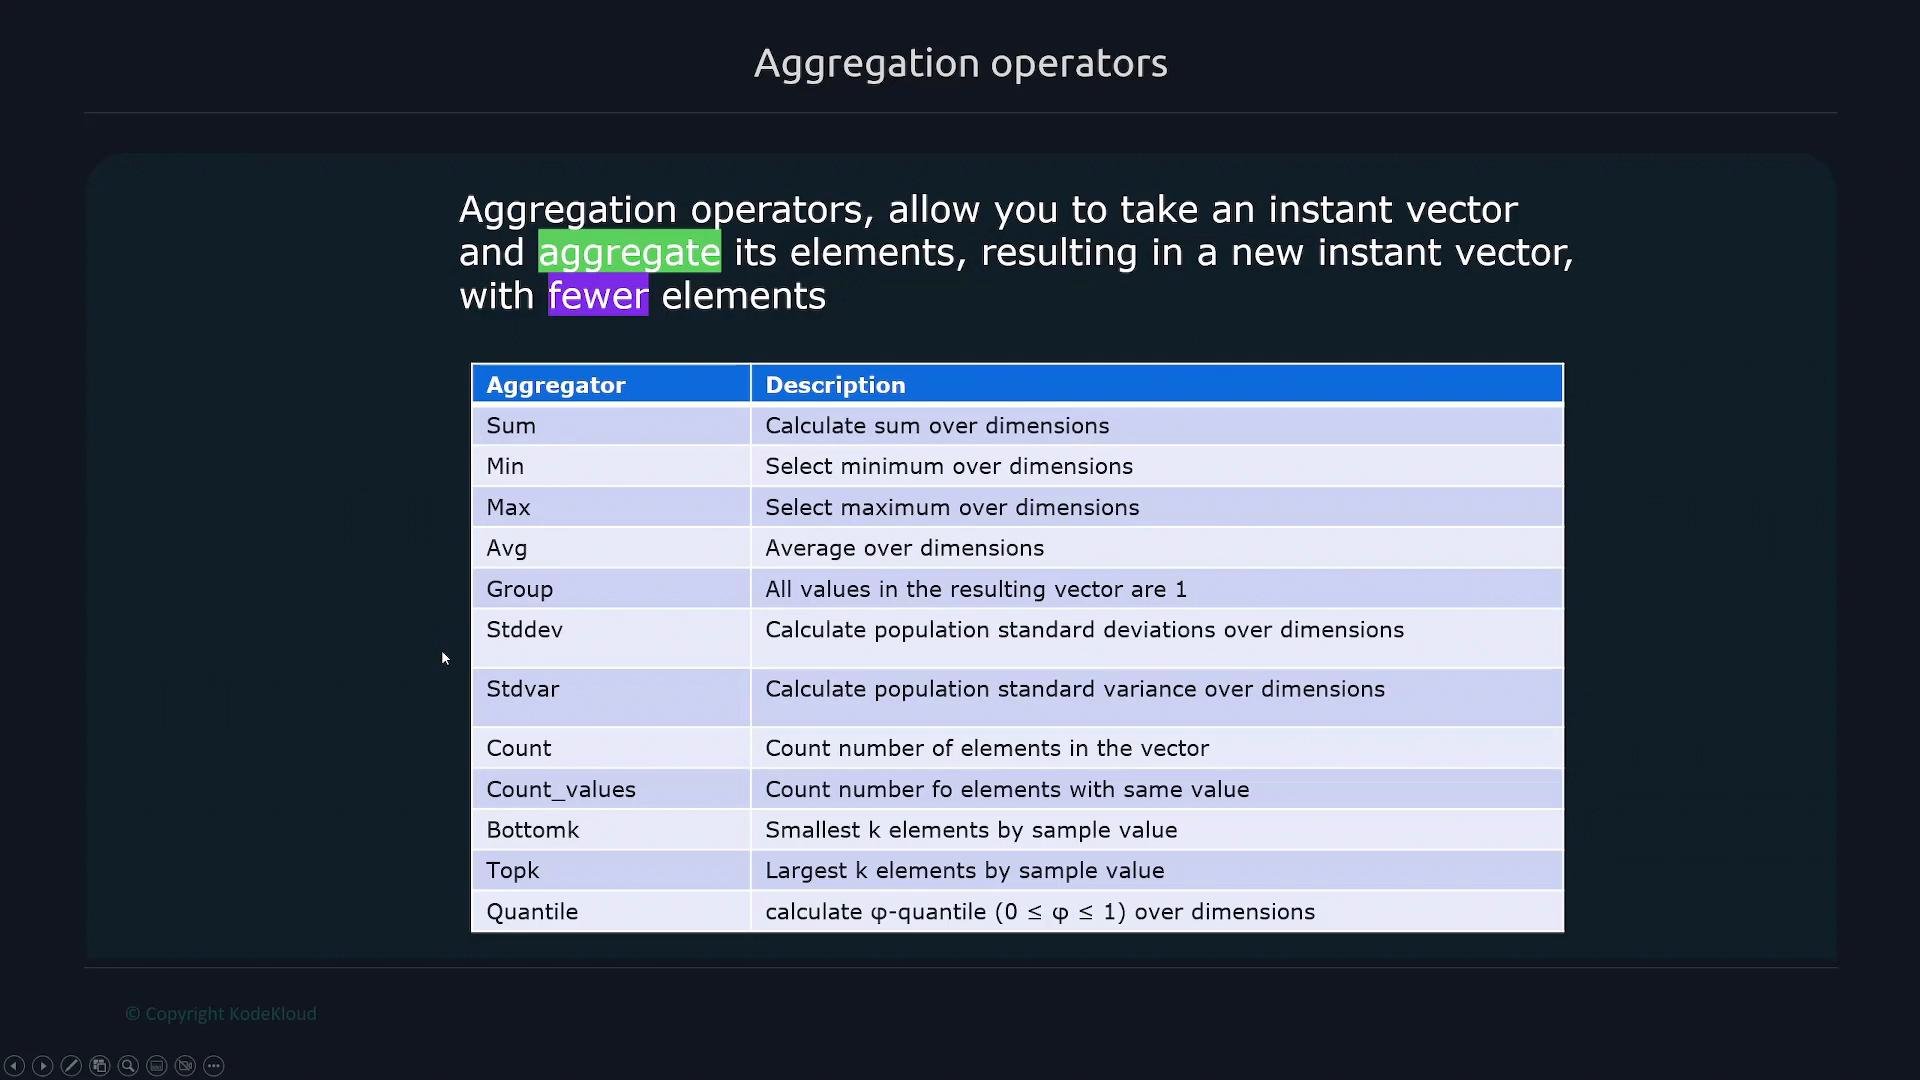
Aggregation operators reduce an instant vector into coarser results. Use
by(...) to keep specific labels in the output, or without(...) to drop labels from the aggregation key.Common aggregation functions
Simple aggregation examples
Given anhttp_requests instant vector (each line is a distinct series sample):
Grouping results with by(...)
To aggregate while preserving one or more label dimensions, use by(...). Series that share the listed labels are combined.
Example: group by path to sum requests per path:
method to get totals per HTTP method:
Multi-label grouping
If time series include aninstance label (two nodes: node1 and node2), the dataset might look like:
instance and method:
The without(...) clause
without(...) is the inverse of by(...) — it tells Prometheus which labels to exclude from the aggregation key. The result keeps all other labels.
Using the dataset above, sum without(path) (http_requests) removes the path label and aggregates across that dimension. For this dataset it is equivalent to sum by(instance, method) (http_requests):
Be cautious when grouping by high-cardinality labels (for example,
pod, instance, or user IDs): by(...) can produce many result series and increase memory/CPU usage. Prefer grouping by stable, low-cardinality labels for dashboards and alerts.Real-world example: CPU seconds
Considernode_cpu_seconds_total, where each series has labels like instance, cpu, mode, and job:
sum(node_cpu_seconds_total) aggregates every CPU and instance into a single number. More useful rollups:
- Total CPU seconds per instance:
- Totals per CPU per instance:
- Keep
instanceandjobbut dropcpuandmode:
Quick reference
Links and references
- Prometheus aggregation docs: https://prometheus.io/docs/prometheus/latest/querying/operators/#aggregation-operators
- PromQL basics: https://prometheus.io/docs/prometheus/latest/querying/basics/
by(...) to declare which labels to preserve in the result, and without(...) to remove labels from the aggregation key — both are essential for meaningful, efficient rollups in Prometheus queries.