

- Docker Engine metrics (engine-level metrics)
- Per-container metrics using cAdvisor
Before you begin, ensure:
- Prometheus is reachable and configured to reload or be restarted after config updates.
- You have administrative access to the Docker host(s).
- Networking between Prometheus and the target host/ports is allowed by firewalls/security groups.
Overview
Metrics from containerized environments can come from either the Docker daemon itself (engine metrics) or from an agent that inspects running containers (cAdvisor). Use engine metrics for daemon-level telemetry and cAdvisor for per-container resource usage and lifecycle details.Docker Engine metrics
Docker exposes an experimental metrics endpoint on the host daemon. To enable it:- Edit or create
/etc/docker/daemon.jsonand add:
- Restart Docker and verify the endpoint:
12.1.13.4 with the IP address of your Docker host (or DNS name) and ensure the port matches metrics-addr in daemon.json.
Exposing Docker’s metrics endpoint can reveal operational details about your host. Binding to
127.0.0.1 restricts access to the local machine; do not bind to a public interface unless you have proper network controls and authentication in place.cAdvisor (container-level metrics)
cAdvisor (Container Advisor) collects resource usage and performance characteristics for each running container. It runs as a container and needs access to host paths and permissions to gather accurate per-container metrics. Example Docker Compose file (docker-compose.yml) to run cAdvisor:
privileged access and read-only mounts to several host paths so it can inspect container state and metrics.
For full configuration details and explanation of mounts/flags, see the cAdvisor repository on GitHub: https://github.com/google/cadvisor
Prometheus: combined example
Here is an example showing both jobs in a single Prometheusscrape_configs block:
kubernetes_sd_configs, file_sd_configs, or relabeling to discover hosts dynamically.
What’s the difference between Docker Engine metrics and cAdvisor metrics?
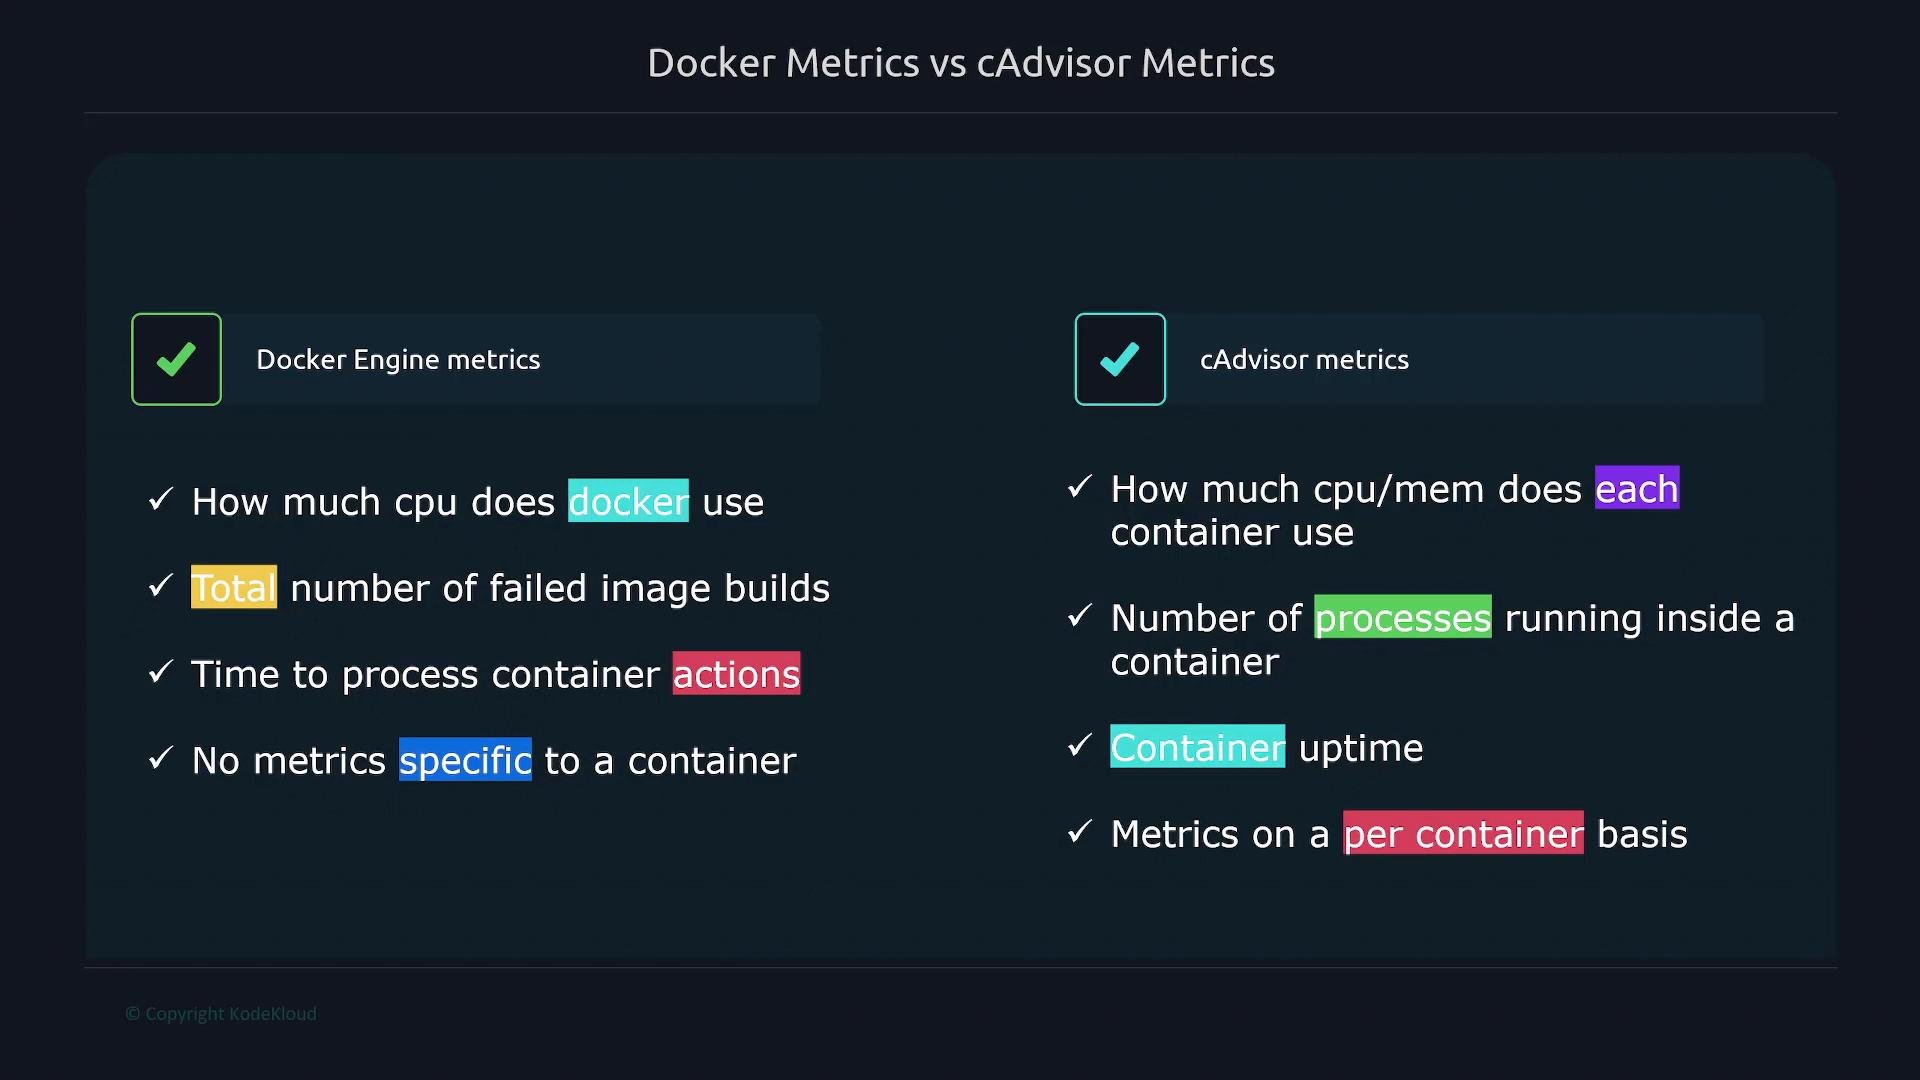
Summary
- Use Docker Engine metrics for daemon-focused telemetry and operational counts.
- Use cAdvisor when you need per-container resource metrics and lifecycle information.
- Configure Prometheus scrape jobs to point at the appropriate host and port; secure endpoints appropriately.
- Prometheus documentation: https://prometheus.io/docs/
- cAdvisor (GitHub): https://github.com/google/cadvisor