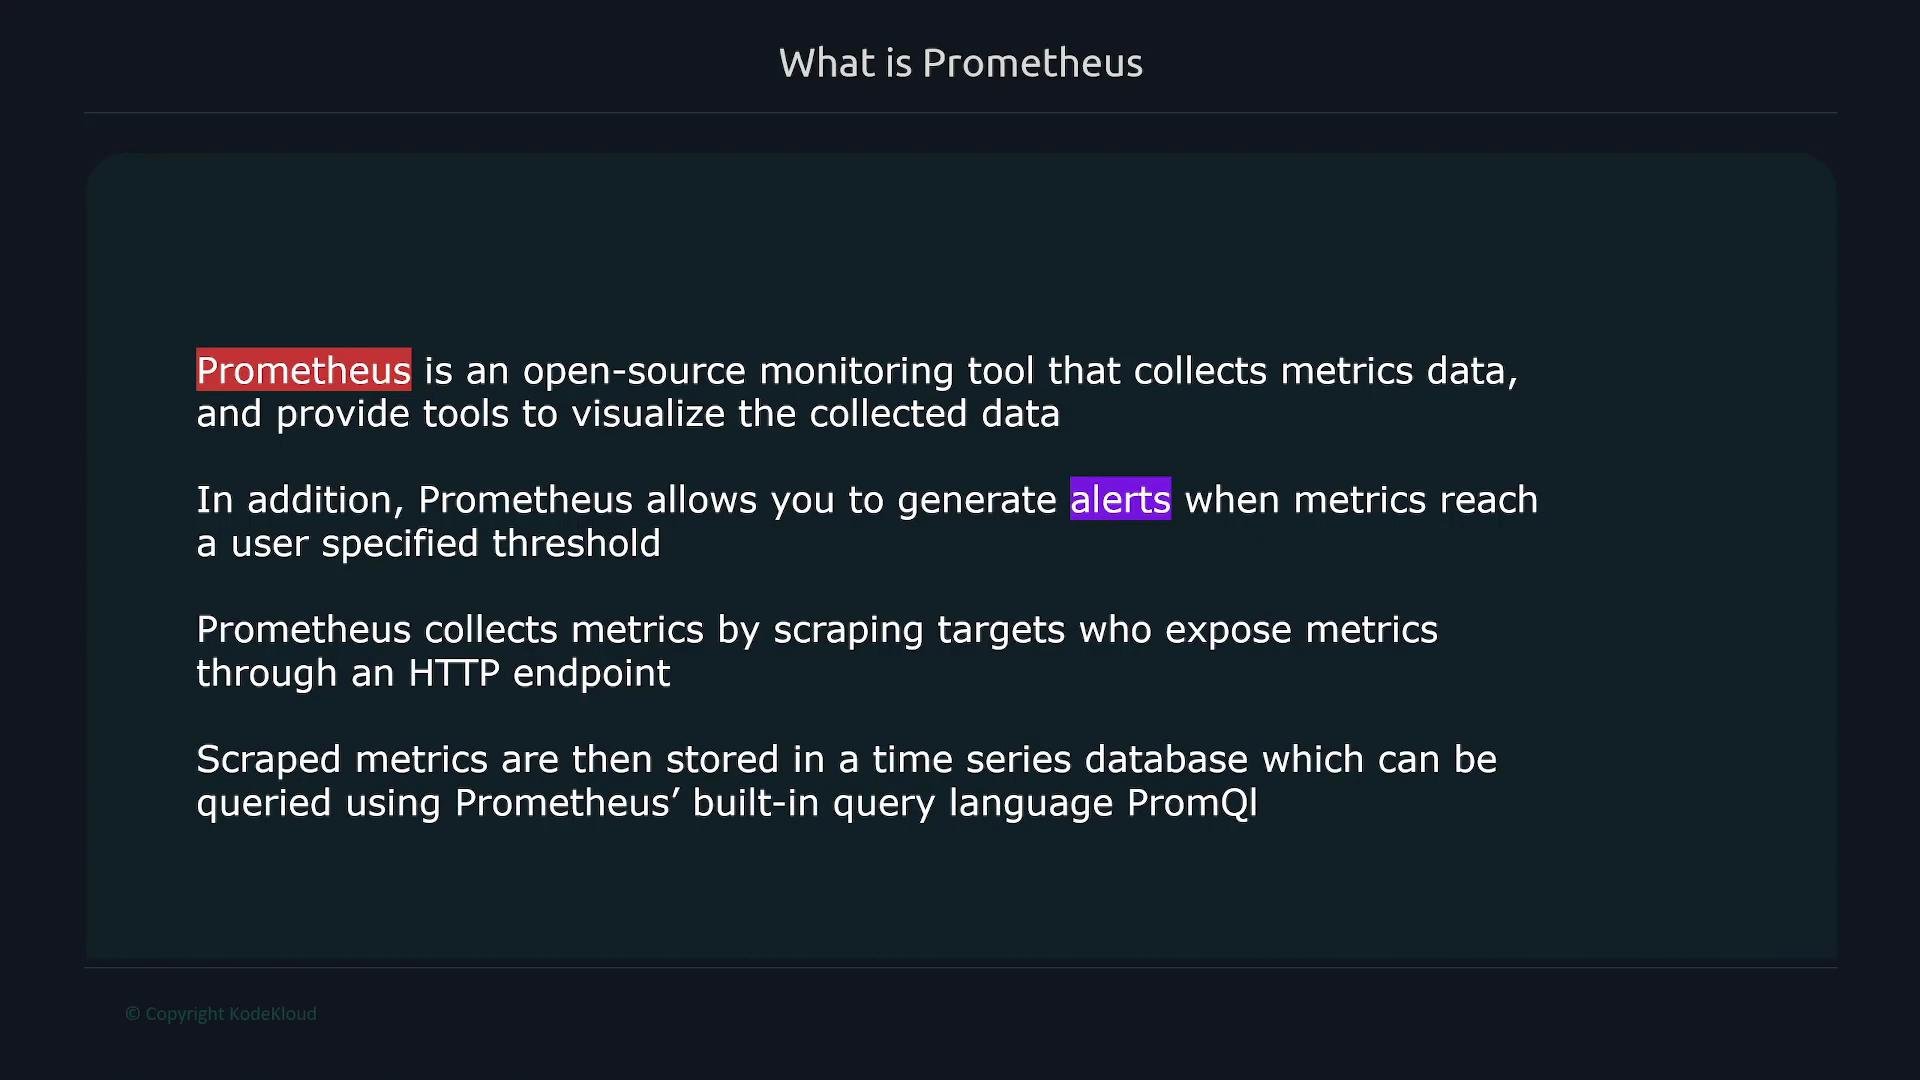
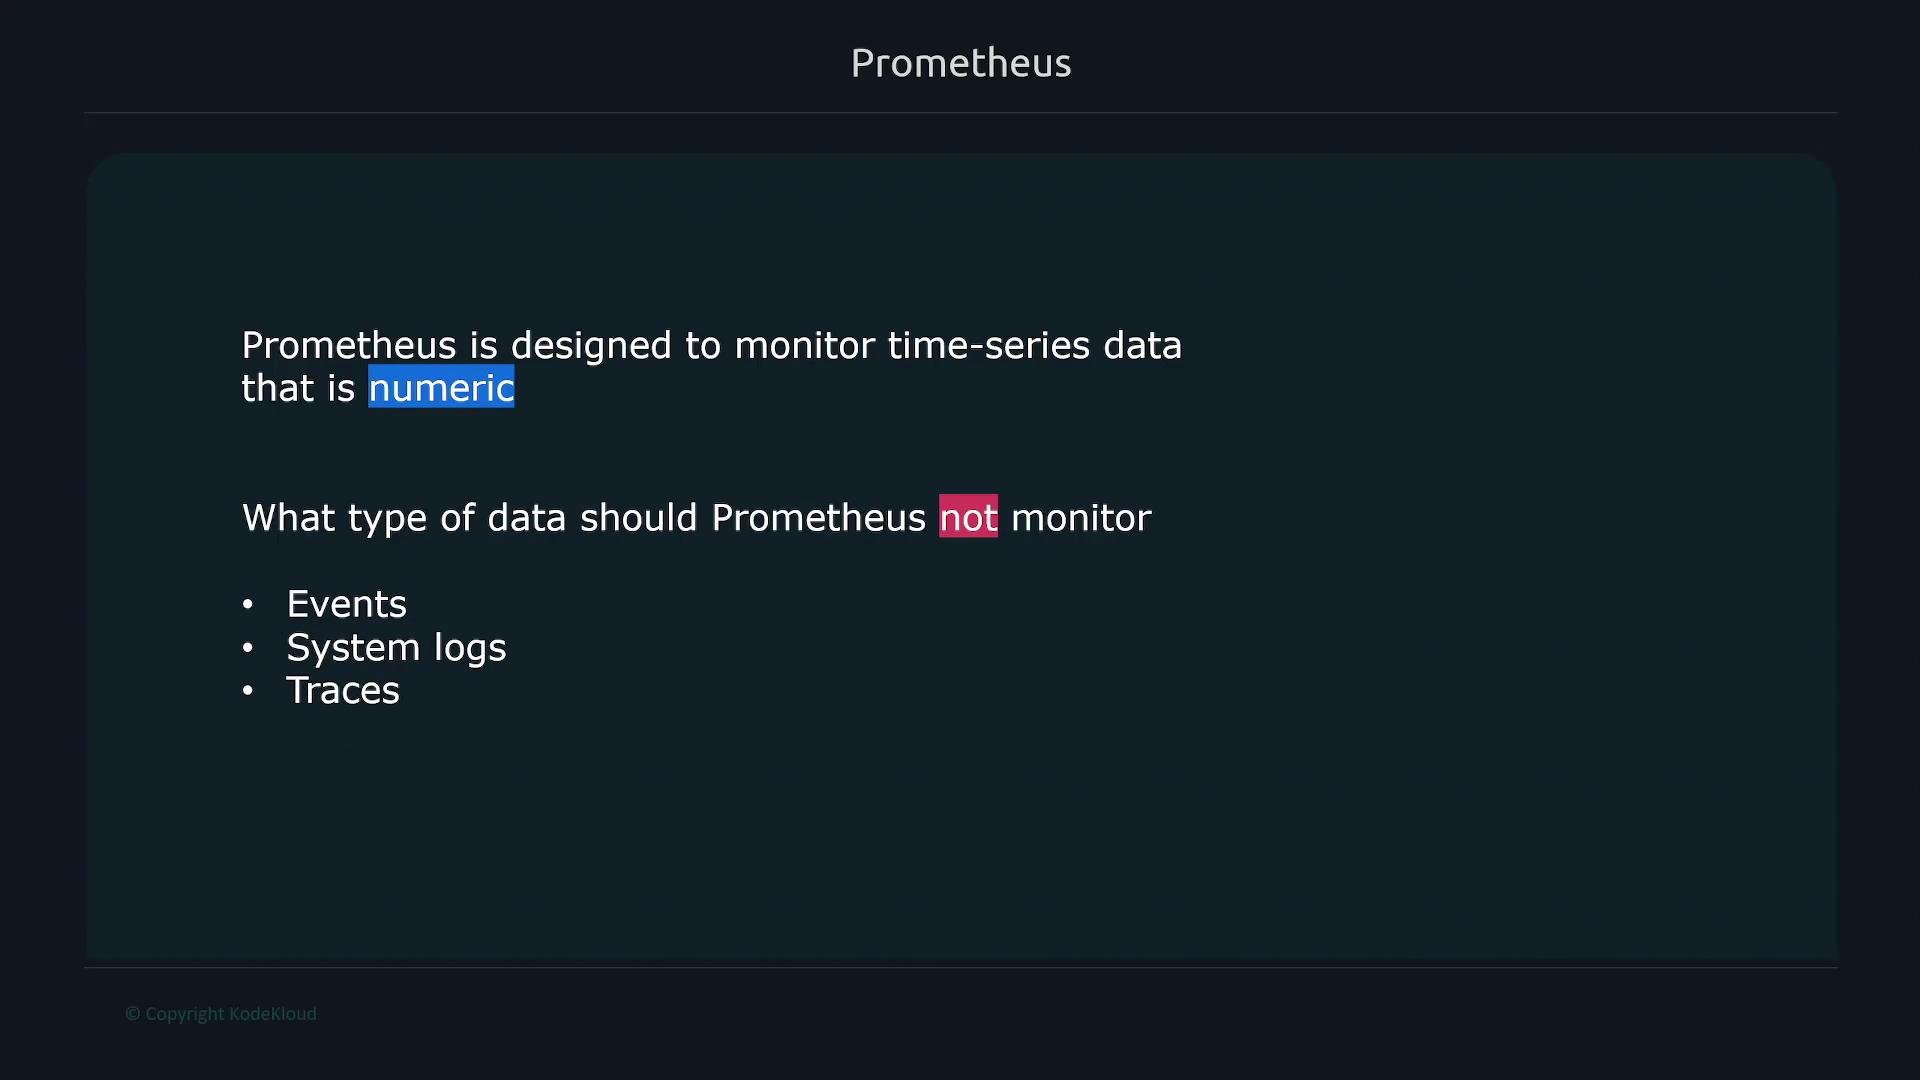
- Collects numeric time-series metrics from configured targets.
- Stores metrics in a local time-series database (TSDB) optimized for high-write, high-query workloads.
- Provides a powerful query language, PromQL, for aggregating and analyzing time-series data.
- Integrates with an alerting pipeline (Alertmanager) to route notifications when metrics cross thresholds.
/metrics HTTP path). Scraped samples are persisted in the local TSDB and can be queried with PromQL or visualized in tools like Grafana.
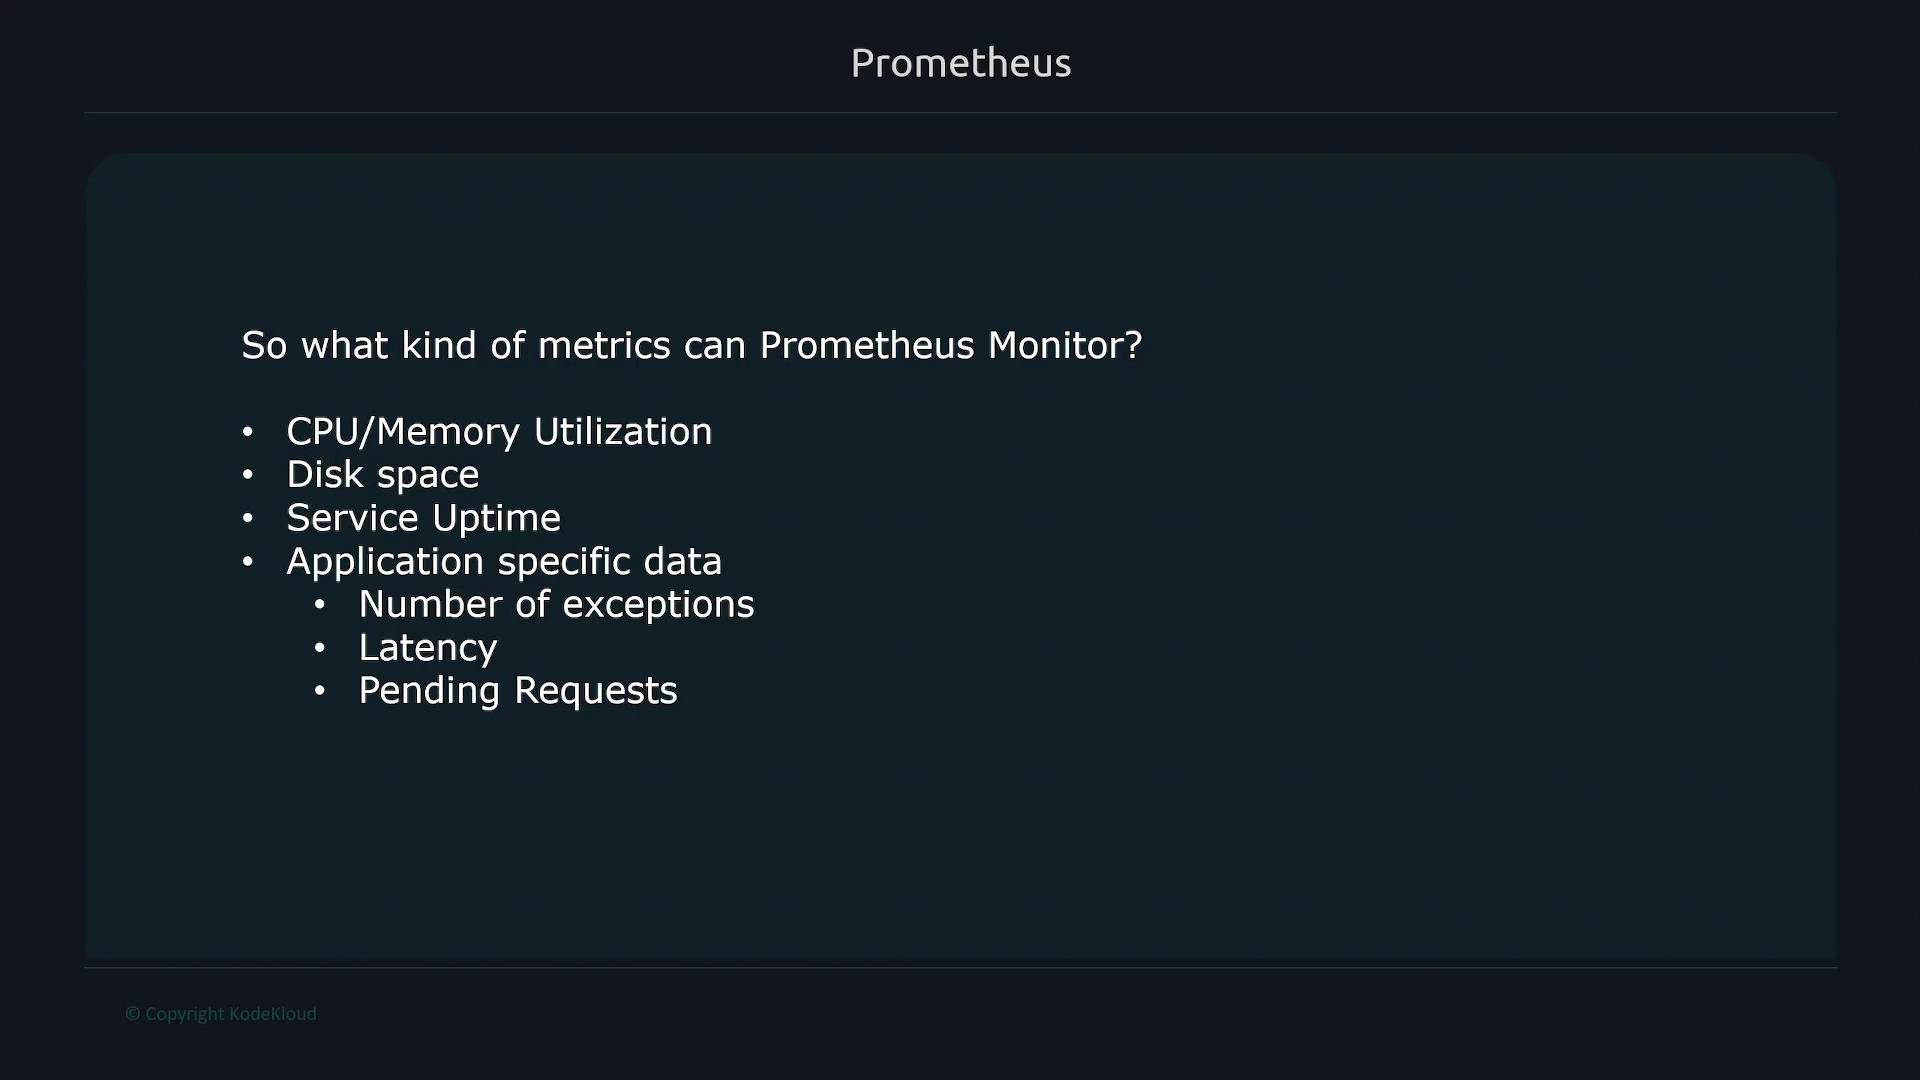
- Host and OS metrics: CPU, memory, disk, and network statistics.
- Service metrics: uptime, request/sec, error rates, and latency percentiles (p50/p95/p99).
- Application/business metrics: exceptions, queue depth, job counts, revenue metrics.
- Instrument code directly using a Prometheus client library (Go, Java, Python, Ruby, etc.).
- Use exporters for systems that cannot be instrumented natively (for example,
node_exporterfor host metrics,blackbox_exporterfor probing endpoints, or database exporters). - Use Pushgateway for short-lived batch jobs that cannot be scraped periodically.
Prometheus includes an Alertmanager component for routing notifications (email, PagerDuty, Slack, etc.). For long-term metric retention beyond Prometheus’ local TSDB retention window, integrate remote storage solutions using Prometheus’
remote_write/remote_read APIs.
Prometheus components at a glance
A few additional technical notes
- Service discovery: Prometheus supports multiple discovery mechanisms (Kubernetes, Consul, EC2, DNS) so targets can be discovered dynamically.
- Alerting rules: Define rules in Prometheus to evaluate conditions and send alerts to Alertmanager for notification and silencing.
- Retention and remote storage: Prometheus’ local TSDB is optimized for recent data. For long-term retention, use compatible remote storage backends via
remote_write/remote_read. - Choosing metric types: Use counters for totals, gauges for instantaneous values, histograms/summaries for latency distributions.
https://prometheus.io/docs/.
Links and references
- Prometheus querying basics (PromQL)
- Grafana
- node_exporter
- blackbox_exporter
- Pushgateway
- Prometheus documentation