

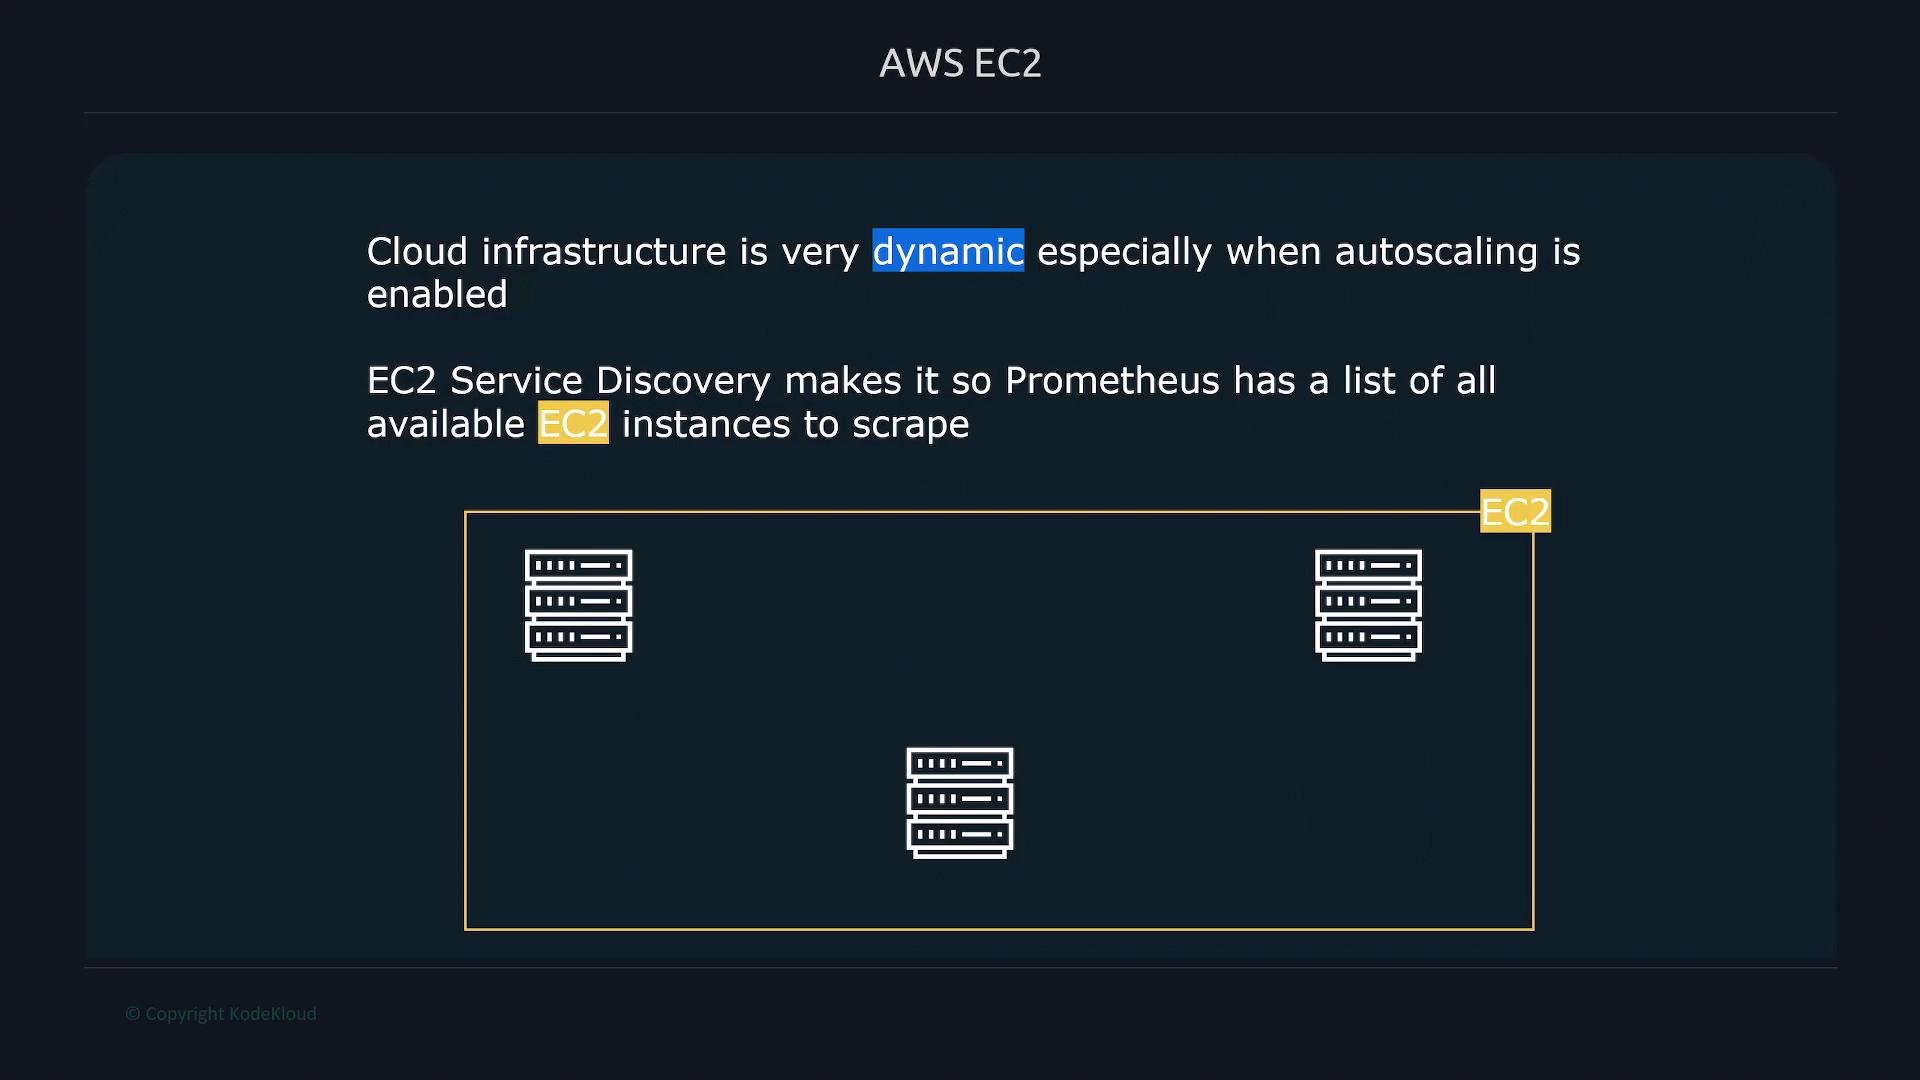
How EC2 service discovery works
Prometheus queries the EC2 Describe APIs to receive a list of available instances. For each discovered instance it exposes a rich set of metadata labels that you can use for filtering, relabeling, and target selection. To enable EC2 service discovery, add anec2_sd_configs block to your scrape_configs in prometheus.yml. The minimal required fields are:
- the AWS region to query,
- AWS credentials (access key and secret key) or a secure alternative (recommended),
- optionally filters to limit discovered instances.
instance label (and __address__) typically use the private IP and port, because Prometheus is commonly deployed inside the same VPC. If Prometheus runs outside the VPC or cannot reach private IPs, use relabeling to change the target address to the public IP (for example set __address__ to __meta_ec2_public_ip__:9100).
See the official docs for ec2_sd_config and relabel_config:
- https://prometheus.io/docs/prometheus/latest/configuration/configuration/#ec2_sd_config
- https://prometheus.io/docs/prometheus/latest/configuration/configuration/#relabel_config
Prometheus exposes useful EC2 metadata labels for filtering and relabeling, such as
__meta_ec2_tag_Name__, instance type, VPC ID, private/public IPs, and AMI IDs — use these to limit scrapes to relevant instances.Common EC2 metadata labels
Setting up IAM credentials for Prometheus
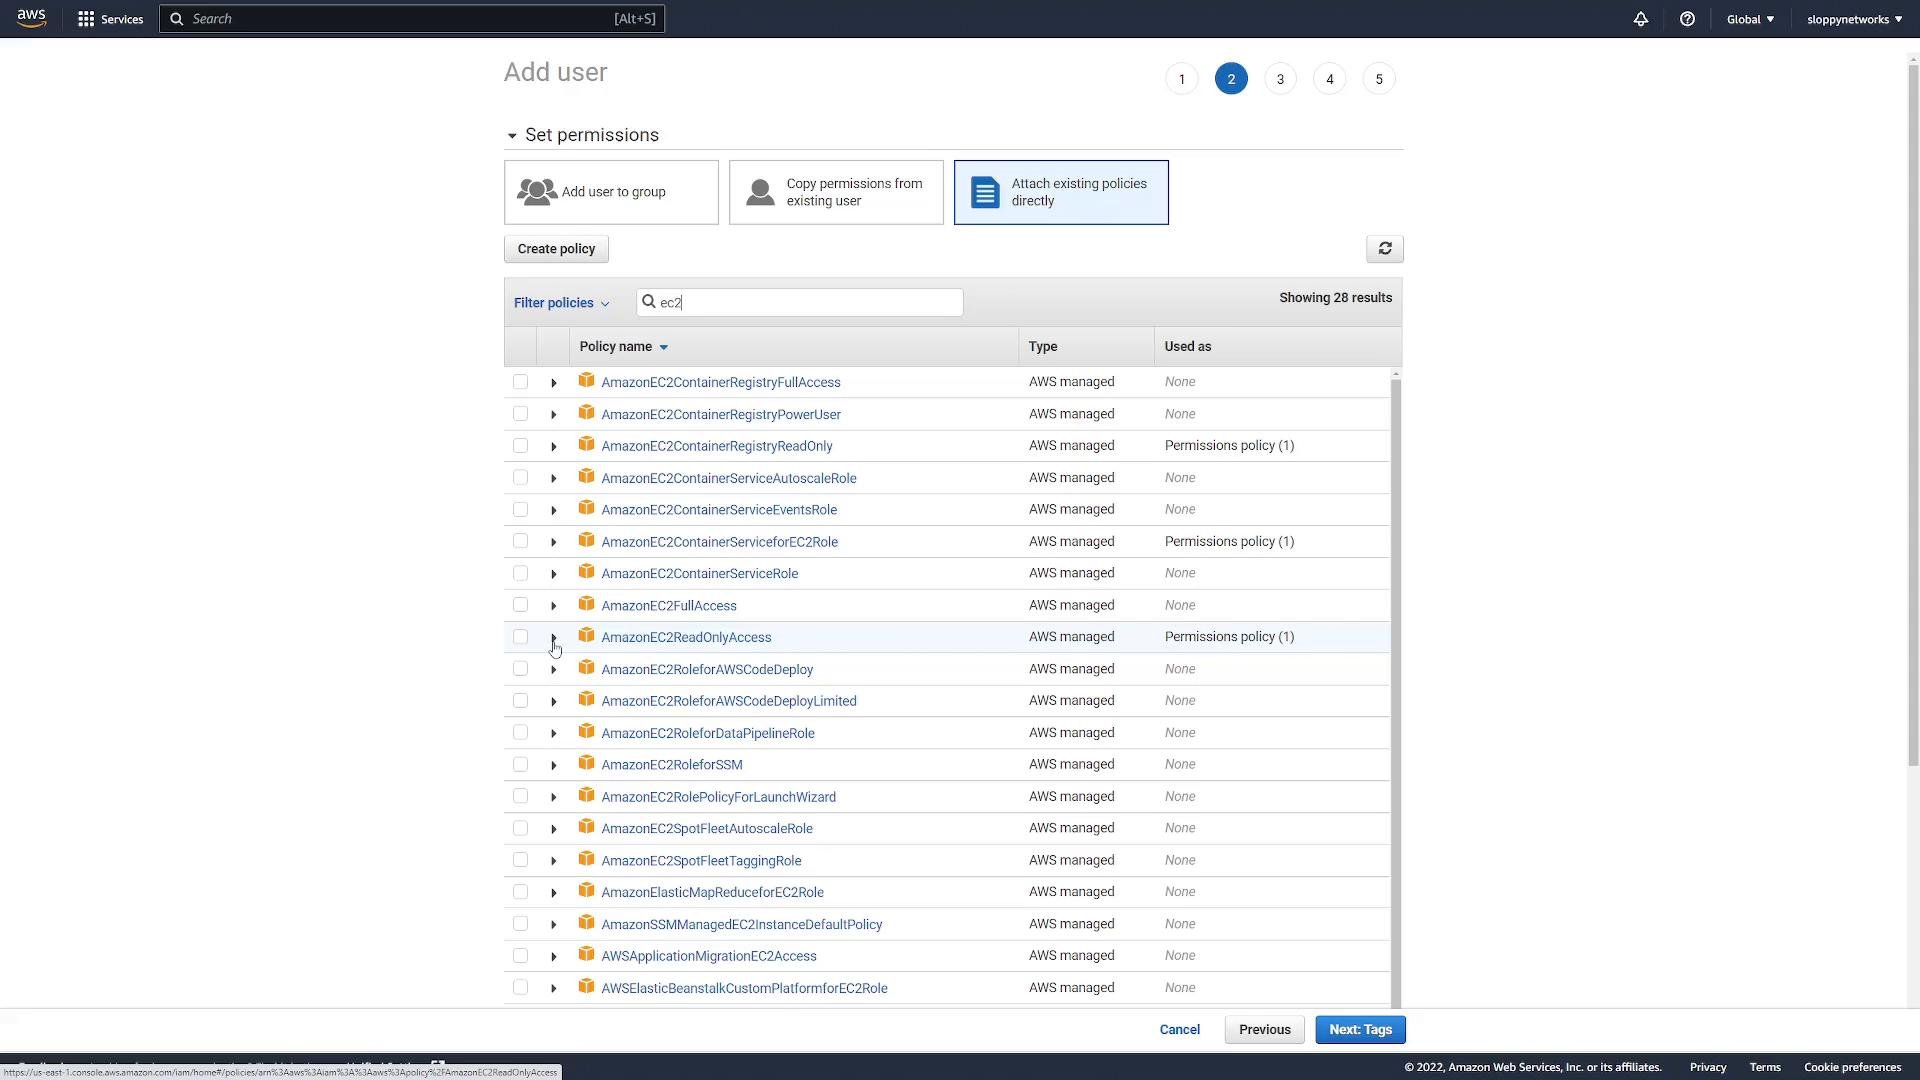
Prometheus needs permission to call EC2 Describe APIs. Create an IAM user or role with read-only EC2 permissions. Recommended steps:- Open the AWS Console: IAM → Users → Create user.
- Create a user for programmatic access only (no console sign-in).
- Attach the managed policy
AmazonEC2ReadOnlyAccessor a custom scoped policy that permits the EC2 read-only actions Prometheus requires. - Save the Access key ID and Secret access key — the secret is shown only once. Use secure mechanisms to provide credentials to Prometheus (see warning below).
Do not store long-lived AWS access keys directly in
prometheus.yml in production. Prefer IAM roles (instance profiles), short-lived credentials (via STS), environment variables, or a secrets manager.Recommended Prometheus configuration example
Replace the placeholders with your AWS region and preferred credential configuration. For production, prefer IAM roles or environment-based credentials instead of embedding keys in the YAML.prometheus.yml, restart Prometheus:
- Status → Service Discovery: confirm EC2 is listed and shows the number of discovered targets.
- Status → Targets: inspect each discovered target, its labels, and scrape status.
DOWN, check:
- Network connectivity (security groups, VPC routing, NAT/Gateway),
- Whether Prometheus can reach the instance private IP (or switch to public IP via relabeling),
- That the node exporter or other exporter is running on the expected port.
Additional references
- Prometheus EC2 service discovery: https://prometheus.io/docs/prometheus/latest/configuration/configuration/#ec2_sd_config
- Prometheus relabeling: https://prometheus.io/docs/prometheus/latest/configuration/configuration/#relabel_config
- AWS IAM users: https://docs.aws.amazon.com/IAM/latest/UserGuide/id_users_create.html
- Amazon EC2 read-only policy: https://docs.aws.amazon.com/AWSEC2/latest/UserGuide/iam-policies-for-amazon-ec2.html